REPORT OUTLOOK
| Market Size | CAGR | Dominating Region |
|---|---|---|
| USD 8.12 billion | 3.23% | Asia Pacific |
| By Material | By Method | By Region |
|---|---|---|
|
|
|
SCOPE OF THE REPORT
EMI Shielding Market Overview
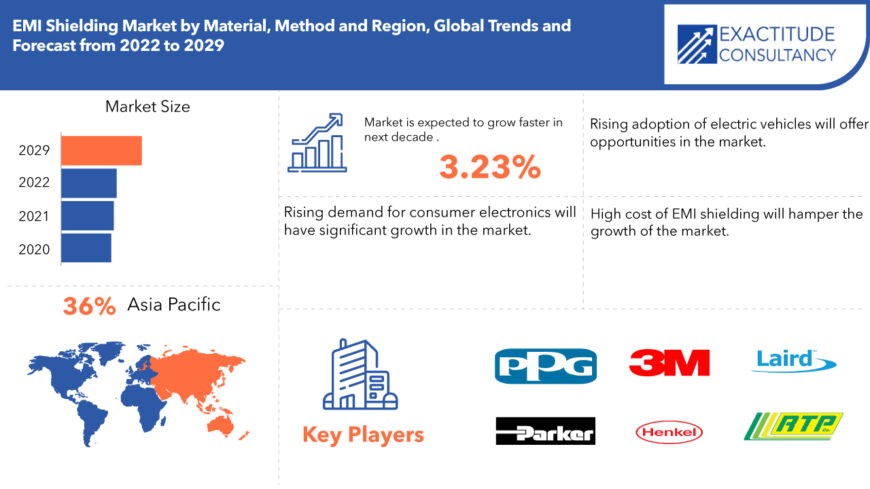
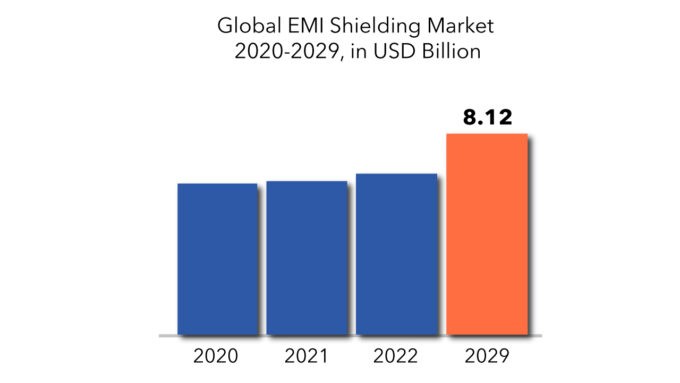
The global EMI shielding market is expected to grow at a 3.23% CAGR from 2022 to 2029. It is expected to reach above USD 8.12 billion by 2029 from USD 6.1 billion in 2020.
EMI shielding is the reflection or absorption of electromagnetic radiation by materials placed in the path of electromagnetic interference. Electromagnetic fields, electrostatic fields, and radio wave coupling can all be reduced through EMI shielding. The EMI shielding market has grown over the previous decade as the usage of electronics in a variety of industries such as aerospace and defense, automotive, telecom and IT, healthcare, consumer electronics, and others has expanded. Metals, conductive coatings, laminates, and other EMI shielding materials are used to prevent electronic equipment from malfunctioning by filtering incoming and outgoing interferences. Increased government investment in defense will assist the EMI shielding materials industry, as the product is used to shield weapon systems from interference.
EMI shielding materials are common in electronics, defense, aerospace, automotive, telecommunications, and medical applications. Because of constant innovation in electronic devices and the employment of increasingly advanced integrated chips and circuits in gadgets, which result in higher levels of radiation, the electronic category is a primary driver of development. A surge in investment on technologically complex EMI shielding technologies has resulted in significant growth for several electronic device manufacturers Technistro, Coatex industries, and others in different countries such as India, China, Japan, and South Korea, among others.
| ATTRIBUTE | DETAILS |
| Study period | 2020-2029 |
| Base year | 2021 |
| Estimated year | 2022 |
| Forecasted year | 2022-2029 |
| Historical period | 2018-2020 |
| Unit | USD Millions |
| Segmentation | By Material, Method |
| By Material
|
|
| By Method
|
|
| By Region
|
|
Increased demand for consumer electronics has benefited EMI shielding in recent years, and this trend is expected to continue during the forecast period. The usage of EMI with well-established processes and techniques drives the market. Furthermore, the growing usage of various types of EMI shielding materials and technologies in automotive devices such as automatic sliding doors, keyless ignitions, remote starters, power seats, and power windows, among others, is propelling the EMI market forward. The Standards Association of the Institute of Electrical and Electronics Engineers has made EMI shielding a standard. These standards must be strictly observed by EMI shielding companies. The restrictions for compliance with such standards are preventing many EMI shielding firms from joining the market. This might stifle market expansion over the next few years.
Conductive coatings and metals are the major materials used for EMI shields. Metals were once frequently used; however, conductive coatings are now widely used due to increased features such as high heat conductivity and others. Product manufacturers utilize conductive coatings and paints with EMI shielding for non-metallic surfaces and plastics in telephones, telecommunications, medical, and military systems. In addition, demand from the automotive industry for a variety of applications like sliding doors, keyless ignitions, and others is favorably boosting the market growth. Factors driving the market include ongoing field trials and pilot projects to show the viability of 5G technology, as well as stringent environmental and EMC regulations across industries. One of the key elements driving market development is rapid industrialization.

In 2020, many countries faced strict lockdowns due to the covid-19 pandemic. These lockdowns have resulted in the partial or complete shutdown of manufacturing facilities. The shutdown of manufacturing facilities had a major impact on the consumption of materials. This led to reduced transportation resulting in a slowing down of updating the railway system. However, with the ease of lockdown manufacturing sector is expected to return to its normal growth. The global EMI shielding market is crowded with established players. These players have a commanding say in the market. The technology used in the EMI shielding market is proprietary and needs long-term research and development planning implemented efficiently.
EMI Shielding Market Segment Analysis
On the basis of material, the EMI shielding market is divided into EMI shielding tapes & laminates, conductive coatings & paints, metal shielding, conductive polymers, and EMI/EMC filters. Conductive coatings and paints are expected to account for the largest proportion of the EMI shielding market throughout the projected period. In 2021, conductive coatings & paints are predicted to hold the largest market share, followed by conductive polymers. Non-metal surfaces are protected from electromagnetic radiation by conductive coatings and paints. They are, nevertheless, more expensive than alternative EMI shielding solutions. The surface resistance of a conductive coating is inversely proportional to the coating thickness. Silver, nickel, graphite, and silver-coated copper are used to create a conductive shield around the casing to prevent electromagnetic interference.
Based on the method, the EMI shielding market is segmented into radiation and conduction. The radiation category is expected to lead the EMI shielding market in 2021. The radiation category is expected to lead the EMI shielding market in 2021, accounting for the largest share. Most electrical and electronic devices produce electromagnetic signals. The increased usage of consumer electronics contributes significantly to a rise in electromagnetic pollution. As a result, these signals must be limited in order to minimize interference and damage to a device’s electrical circuitry, as well as performance loss.

EMI Shielding Market Players
From large companies to small ones, many companies are actively working in the EMI shielding market. These key players include PPG Industries, Parker-Hannifin, 3M, Henkel, Laird Performance Materials, RTP Company, Schaffner, Tech-Etch, and others.
Companies are mainly in EMI shielding they are competing closely with each other. Innovation is one of the most important key strategies as it has to be for any market. However, companies in the market have also opted for and successfully driven inorganic growth strategies like mergers & acquisitions, and so on.
- In May 2021, Henkel collaborated with Smartz AG, a medical technology firm. The collaboration combines Henkel’s printed electronics portfolio’s conductive inks with Smartz’s current adult care IoT hardware and software solutions.
- In April 2021, Cetelon, a maker of automotive costings, was bought by PPG Industries. PPG will be able to expand its existing coatings product line, liquid and powder coating technologies, and colour matching capabilities as a result of the purchase.
- In March 2020, Softzorb MCS, a standard EMI absorber, was introduced by Laird Performance Materials. This flexible, conformable absorber decreases coupling without damaging sensitive components by absorbing undesired signal noise.
Who Should Buy? Or Key Stakeholders
- EMI Shielding suppliers
- Investors
- End user companies
- Research institutes
EMI Shielding Market Regional Analysis
The EMI shielding market includes Asia-Pacific (APAC), North America, Europe, Middle East & Africa (MEA), and South America.
- North America: includes the US, Canada, Mexico
- Asia Pacific: includes China, Japan, South Korea, India, Australia, ASEAN and Rest of APAC
- Europe: includes UK, Germany, France, Italy, Spain, Russia, and Rest of Europe
- South America: includes Brazil, Argentina and Rest of South America
- Middle East & Africa: includes Turkey, UAE, Saudi Arabia, South Africa, and the Rest of MEA
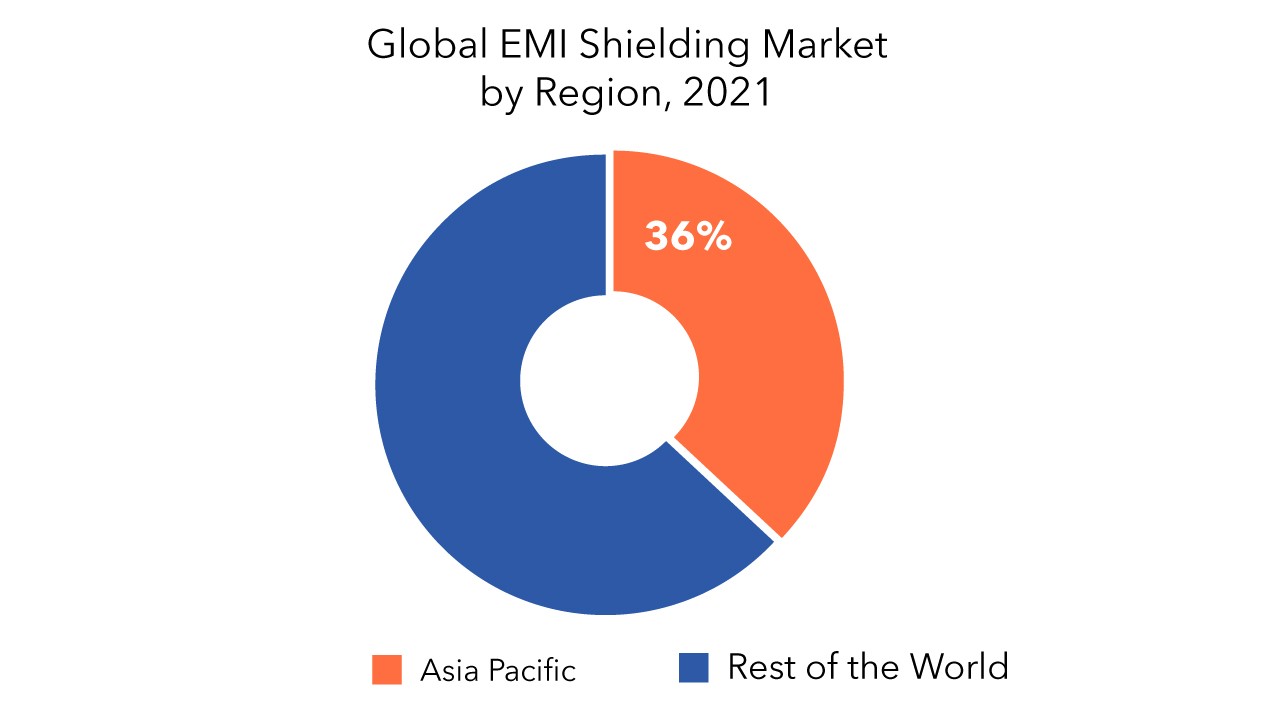
Its major share is occupied by Asia Pacific, North America, Middle East & Africa (MEA), and Europe. Asia Pacific shares 36% of the total market. The factors contributing to the region’s market growth include the increasing number of EMI shielding production plants and the rapid usage of EMI shielding. The market in the region is expanding as a result of increased foreign investment due to low labor costs and the availability of raw resources.

Key Market Segments: EMI Shielding Market
EMI Shielding Market by Material, 2020-2029, (USD Millions)
- Emi Shielding Tapes & Laminates
- Conductive Coatings & Paints
- Metal Shielding
- Conductive Polymers
- EMI/EMC Filters
EMI Shielding Market by Method, 2020-2029, (USD Millions)
- Radiation
- Conduction
EMI Shielding Market by Region, 2020-2029, (USD Millions)
- North America
- Europe
- Asia Pacific
- South America
- Middle East and Africa
Important Countries in All Regions Are Covered.
Key Question Answered
- What is the worth of global EMI shielding market?
- What are the new trends and advancements in the EMI shielding market?
- Which product categories are expected to have the highest growth rate in the EMI shielding market?
- Which are the key factors driving the EMI shielding market?
- What will the market growth rate, growth momentum, or acceleration the market carries during the forecast period?
Table of Content
- Introduction
- Market Definition
- Market Segmentation
- Research Timelines
- Assumptions and Limitations
- Research Methodology
- Data Mining
- Secondary Research
- Primary Research
- Subject-Matter Experts’ Advice
- Quality Checks
- Final Review
- Data Triangulation
- Bottom-Up Approach
- Top-Down Approach
- Research Flow
- Data Sources
- Data Mining
- Executive Summary
- Market Overview
- Global EMI Shielding Market Outlook
- Market Drivers
- Market Restraints
- Market Opportunities
- Impact of Covid-19 On Global EMI Shielding Market
- Global EMI Shielding Market Outlook
- Global EMI Shielding Market by Material, (USD Million)
- EMI shielding tapes & laminates
- Conductive coatings & paints
- Metal shielding
- Conductive polymers
- EMI/EMC filters
- Global EMI Shielding Market by Method, (USD Million)
- Radiation
- Conduction
- Global EMI Shielding Market by Region, (USD Million)
- Introduction
- Asia-Pacific
- China
- India
- Japan
- South Korea
- Australia
- South-East Asia
- Rest of Asia-Pacific
- North America
- United States
- Canada
- Mexico
- Europe
- Germany
- United Kingdom
- France
- Italy
- Spain
- Russia
- Rest of Europe
- South America
- Brazil
- Argentina
- Colombia
- Rest of South America
- Middle East and Africa
- UAE
- Saudi Arabia
- South Africa
- Rest of Middle East and Africa
- Company Profiles* (Business Overview, Company Snapshot, Materials Offered, Recent Developments)
8.1. PPG Industries
8.2. Parker-Hannifin
8.3. 3M
8.4. Henkel
8.5. Laird Performance Materials
8.6. RTP Company
8.7. Schaffner
8.8. Tech-Etch *The Company List Is Indicative
LIST OF TABLES
TABLE 1 GLOBAL EMI SHIELDING MARKET BY FABRIC MATERIAL (USD MILLIONS) 2020-2029
TABLE 2 GLOBAL EMI SHIELDING MARKET BY FILTER MEDIA (USD MILLIONS) 2020-2029
TABLE 3 GLOBAL EMI SHIELDING MARKET BY END USER (USD MILLIONS) 2020-2029
TABLE 4 GLOBAL EMI SHIELDING MARKET BY REGION (USD MILLIONS) 2020-2029
TABLE 5 US EMI SHIELDING MARKET BY FABRIC MATERIAL (USD MILLIONS) 2020-2029
TABLE 6 US EMI SHIELDING MARKET BY FILTER MEDIA (USD MILLIONS) 2020-2029
TABLE 7 US EMI SHIELDING MARKET BY END USER (USD MILLIONS) 2020-2029
TABLE 8 CANADA EMI SHIELDING MARKET BY FABRIC MATERIAL (USD MILLIONS) 2020-2029
TABLE 9 CANADA EMI SHIELDING MARKET BY FILTER MEDIA (USD MILLIONS) 2020-2029
TABLE 10 CANADA EMI SHIELDING MARKET BY END USER (USD MILLIONS) 2020-2029
TABLE 11 MEXICO EMI SHIELDING MARKET BY FABRIC MATERIAL (USD MILLIONS) 2020-2029
TABLE 12 MEXICO EMI SHIELDING MARKET BY FILTER MEDIA (USD MILLIONS) 2020-2029
TABLE 13 MEXICO EMI SHIELDING MARKET BY END USER (USD MILLIONS) 2020-2029
TABLE 14 BRAZIL EMI SHIELDING MARKET BY FABRIC MATERIAL (USD MILLIONS) 2020-2029
TABLE 15 BRAZIL EMI SHIELDING MARKET BY FILTER MEDIA (USD MILLIONS) 2020-2029
TABLE 16 BRAZIL EMI SHIELDING MARKET BY END USER (USD MILLIONS) 2020-2029
TABLE 17 ARGENTINA EMI SHIELDING MARKET BY FABRIC MATERIAL (USD MILLIONS) 2020-2029
TABLE 18 ARGENTINA EMI SHIELDING MARKET BY FILTER MEDIA (USD MILLIONS) 2020-2029
TABLE 19 ARGENTINA EMI SHIELDING MARKET BY END USER (USD MILLIONS) 2020-2029
TABLE 20 COLOMBIA EMI SHIELDING MARKET BY FABRIC MATERIAL (USD MILLIONS) 2020-2029
TABLE 21 COLOMBIA EMI SHIELDING MARKET BY FILTER MEDIA (USD MILLIONS) 2020-2029
TABLE 22 COLOMBIA EMI SHIELDING MARKET BY END USER (USD MILLIONS) 2020-2029
TABLE 23 REST OF SOUTH AMERICA EMI SHIELDING MARKET BY FABRIC MATERIAL (USD MILLIONS) 2020-2029
TABLE 24 REST OF SOUTH AMERICA EMI SHIELDING MARKET BY FILTER MEDIA (USD MILLIONS) 2020-2029
TABLE 25 REST OF SOUTH AMERICA EMI SHIELDING MARKET BY END USER (USD MILLIONS) 2020-2029
TABLE 26 INDIA EMI SHIELDING MARKET BY FABRIC MATERIAL (USD MILLIONS) 2020-2029
TABLE 27 INDIA EMI SHIELDING MARKET BY FILTER MEDIA (USD MILLIONS) 2020-2029
TABLE 28 INDIA EMI SHIELDING MARKET BY END USER (USD MILLIONS) 2020-2029
TABLE 29 CHINA EMI SHIELDING MARKET BY FABRIC MATERIAL (USD MILLIONS) 2020-2029
TABLE 30 CHINA EMI SHIELDING MARKET BY FILTER MEDIA (USD MILLIONS) 2020-2029
TABLE 31 CHINA EMI SHIELDING MARKET BY END USER (USD MILLIONS) 2020-2029
TABLE 32 JAPAN EMI SHIELDING MARKET BY FABRIC MATERIAL (USD MILLIONS) 2020-2029
TABLE 33 JAPAN EMI SHIELDING MARKET BY FILTER MEDIA (USD MILLIONS) 2020-2029
TABLE 34 JAPAN EMI SHIELDING MARKET BY END USER (USD MILLIONS) 2020-2029
TABLE 35 SOUTH KOREA EMI SHIELDING MARKET BY FABRIC MATERIAL (USD MILLIONS) 2020-2029
TABLE 36 SOUTH KOREA EMI SHIELDING MARKET BY FILTER MEDIA (USD MILLIONS) 2020-2029
TABLE 37 SOUTH KOREA EMI SHIELDING MARKET BY END USER (USD MILLIONS) 2020-2029
TABLE 38 AUSTRALIA EMI SHIELDING MARKET BY FABRIC MATERIAL (USD MILLIONS) 2020-2029
TABLE 39 AUSTRALIA EMI SHIELDING MARKET BY FILTER MEDIA (USD MILLIONS) 2020-2029
TABLE 40 AUSTRALIA EMI SHIELDING MARKET BY END USER (USD MILLIONS) 2020-2029
TABLE 41 SOUTH-EAST ASIA EMI SHIELDING MARKET BY FABRIC MATERIAL (USD MILLIONS) 2020-2029
TABLE 42 SOUTH-EAST ASIA EMI SHIELDING MARKET BY FILTER MEDIA (USD MILLIONS) 2020-2029
TABLE 43 SOUTH-EAST ASIA EMI SHIELDING MARKET BY END USER (USD MILLIONS) 2020-2029
TABLE 44 REST OF ASIA PACIFIC EMI SHIELDING MARKET BY FABRIC MATERIAL (USD MILLIONS) 2020-2029
TABLE 45 REST OF ASIA PACIFIC EMI SHIELDING MARKET BY FILTER MEDIA (USD MILLIONS) 2020-2029
TABLE 46 REST OF ASIA PACIFIC EMI SHIELDING MARKET BY END USER (USD MILLIONS) 2020-2029
TABLE 47 GERMANY EMI SHIELDING MARKET BY FABRIC MATERIAL (USD MILLIONS) 2020-2029
TABLE 48 GERMANY EMI SHIELDING MARKET BY FILTER MEDIA (USD MILLIONS) 2020-2029
TABLE 49 GERMANY EMI SHIELDING MARKET BY END USER (USD MILLIONS) 2020-2029
TABLE 50 UK EMI SHIELDING MARKET BY FABRIC MATERIAL (USD MILLIONS) 2020-2029
TABLE 51 UK EMI SHIELDING MARKET BY FILTER MEDIA (USD MILLIONS) 2020-2029
TABLE 52 UK EMI SHIELDING MARKET BY END USER (USD MILLIONS) 2020-2029
TABLE 53 FRANCE EMI SHIELDING MARKET BY FABRIC MATERIAL (USD MILLIONS) 2020-2029
TABLE 54 FRANCE EMI SHIELDING MARKET BY FILTER MEDIA (USD MILLIONS) 2020-2029
TABLE 55 FRANCE EMI SHIELDING MARKET BY END USER (USD MILLIONS) 2020-2029
TABLE 56 ITALY EMI SHIELDING MARKET BY FABRIC MATERIAL (USD MILLIONS) 2020-2029
TABLE 57 ITALY EMI SHIELDING MARKET BY FILTER MEDIA (USD MILLIONS) 2020-2029
TABLE 58 ITALY EMI SHIELDING MARKET BY END USER (USD MILLIONS) 2020-2029
TABLE 59 SPAIN EMI SHIELDING MARKET BY FABRIC MATERIAL (USD MILLIONS) 2020-2029
TABLE 60 SPAIN EMI SHIELDING MARKET BY FILTER MEDIA (USD MILLIONS) 2020-2029
TABLE 61 SPAIN EMI SHIELDING MARKET BY END USER (USD MILLIONS) 2020-2029
TABLE 62 RUSSIA EMI SHIELDING MARKET BY FABRIC MATERIAL (USD MILLIONS) 2020-2029
TABLE 63 RUSSIA EMI SHIELDING MARKET BY FILTER MEDIA (USD MILLIONS) 2020-2029
TABLE 64 RUSSIA EMI SHIELDING MARKET BY END USER (USD MILLIONS) 2020-2029
TABLE 65 REST OF EUROPE EMI SHIELDING MARKET BY FABRIC MATERIAL (USD MILLIONS) 2020-2029
TABLE 66 REST OF EUROPE EMI SHIELDING MARKET BY FILTER MEDIA (USD MILLIONS) 2020-2029
TABLE 67 REST OF EUROPE EMI SHIELDING MARKET BY END USER (USD MILLIONS) 2020-2029
TABLE 68 UAE EMI SHIELDING MARKET BY FABRIC MATERIAL (USD MILLIONS) 2020-2029
TABLE 69 UAE EMI SHIELDING MARKET BY FILTER MEDIA (USD MILLIONS) 2020-2029
TABLE 70 UAE EMI SHIELDING MARKET BY END USER (USD MILLIONS) 2020-2029
TABLE 71 SAUDI ARABIA EMI SHIELDING MARKET BY FABRIC MATERIAL (USD MILLIONS) 2020-2029
TABLE 72 SAUDI ARABIA EMI SHIELDING MARKET BY FILTER MEDIA (USD MILLIONS) 2020-2029
TABLE 73 SAUDI ARABIA EMI SHIELDING MARKET BY END USER (USD MILLIONS) 2020-2029
TABLE 74 SOUTH AFRICA EMI SHIELDING MARKET BY FABRIC MATERIAL (USD MILLIONS) 2020-2029
TABLE 75 SOUTH AFRICA EMI SHIELDING MARKET BY FILTER MEDIA (USD MILLIONS) 2020-2029
TABLE 76 SOUTH AFRICA EMI SHIELDING MARKET BY END USER (USD MILLIONS) 2020-2029
TABLE 77 REST OF MIDDLE EAST AND AFRICA EMI SHIELDING MARKET BY FABRIC MATERIAL (USD MILLIONS) 2020-2029
TABLE 78 REST OF MIDDLE EAST AND AFRICA EMI SHIELDING MARKET BY FILTER MEDIA (USD MILLIONS) 2020-2029
TABLE 79 REST OF MIDDLE EAST AND AFRICA EMI SHIELDING MARKET BY END USER (USD MILLIONS) 2020-2029
LIST OF FIGURES
FIGURE 1 MARKET DYNAMICS
FIGURE 2 MARKET SEGMENTATION
FIGURE 3 REPORT TIMELINES: YEARS CONSIDERED
FIGURE 4 DATA TRIANGULATION
FIGURE 5 BOTTOM-UP APPROACH
FIGURE 6 TOP-DOWN APPROACH
FIGURE 7 RESEARCH FLOW
FIGURE 8 GLOBAL EMI SHIELDING MARKET BY MATERIAL, USD MILLION, 2020-2029
FIGURE 9 GLOBAL EMI SHIELDING MARKET BY METHOD, USD MILLION, 2020-2029
FIGURE 10 GLOBAL EMI SHIELDING MARKET BY REGION, USD MILLION, 2020-2029
FIGURE 11 PORTER’S FIVE FORCES MODEL
FIGURE 12 EMI SHIELDING MARKET BY REGION 2020
FIGURE 13 MARKET SHARE ANALYSIS
FIGURE 14 PPG INDUSTRIES: COMPANY SNAPSHOT
FIGURE 15 PARKER-HANNIFIN: COMPANY SNAPSHOT
FIGURE 16 3M: COMPANY SNAPSHOT
FIGURE 17 HENKEL: COMPANY SNAPSHOT
FIGURE 18 LAIRD PERFORMANCE MATERIALS: COMPANY SNAPSHOT
FIGURE 19 RTP COMPANY: COMPANY SNAPSHOT
FIGURE 20 SCHAFFNER: COMPANY SNAPSHOT
FIGURE 21 TECH-ETCH: COMPANY SNAPSHOT
FAQ
Rising consumer electronics demand will drive considerable market expansion.
The global EMI shielding market registered a CAGR of 3.23% from 2022 to 2029.
Asia Pacific holds the largest regional market for the EMI shielding market.
The high cost of EMI shielding will hinder market growth.
In-Depth Database
Our Report’s database covers almost all topics of all regions over the Globe.
Recognised Publishing Sources
Tie ups with top publishers around the globe.
Customer Support
Complete pre and post sales
support.
Safe & Secure
Complete secure payment
process.
