SCOPE OF THE REPORT
Injectable Drug Delivery Market Overview
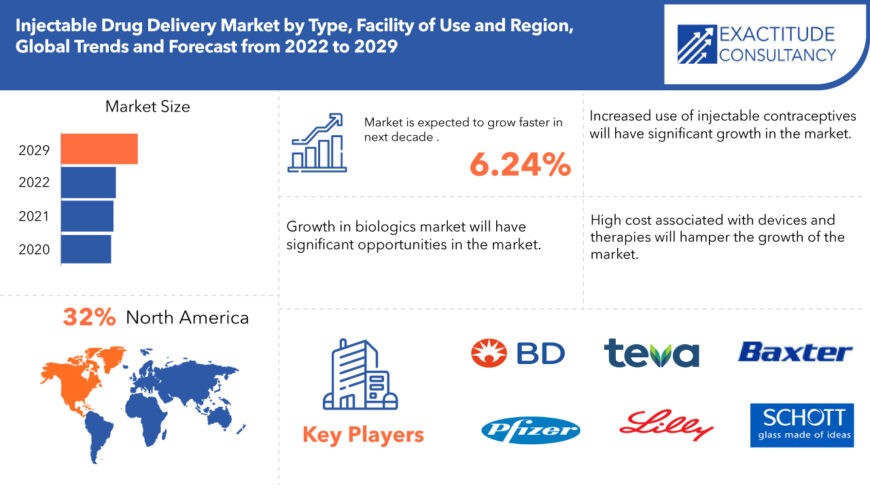
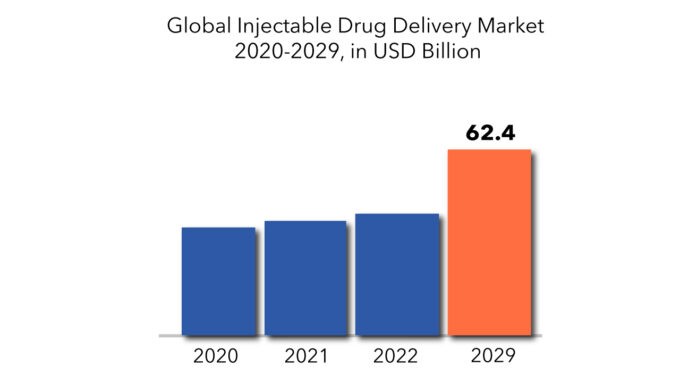
The global injectable drug delivery market is expected to grow at a 6.24% CAGR from 2022 to 2029. It is expected to reach above USD 62.4 billion by 2029 from USD 36.2 billion in 2020.
Originally, tablets, pills, or capsules were the only forms of medication available; however, pharmaceuticals are now distributed via more technologically complicated and intelligent means. These systems try to carry drugs to the intended place, allowing pharmaceuticals that would otherwise be difficult to penetrate the circulatory system to be more localized. Patients who require drugs on a regular basis prefer advanced injection devices over classic injectable devices. Given this, the increasing need for effective and convenient medicine administration systems creates a lucrative opportunity for manufacturers to create complicated, user-friendly, and effective devices. Pre-filled syringes, auto-injectors, pen-injectors, and wearable needle-free injectors are examples of recent needle-free injector advancements. Pre-filled syringes are the fastest growing industry, with the largest market share predicted by 2027. Furthermore, the increased incidence of diseases such as diabetes, cancer, and autoimmune disorders is likely to drive the market for the duration of the forecast period. According to Worldometer, the coronavirus pandemic has a prevalence of over 1 million as of June 2020, leading in a high demand for conventional injections.
| ATTRIBUTE | DETAILS |
| Study period | 2020-2029 |
| Base year | 2021 |
| Estimated year | 2022 |
| Forecasted year | 2022-2029 |
| Historical period | 2018-2020 |
| Unit | USD Millions |
| Segmentation | By Type, Facility of Use |
| By Type |
|
| By Facility of Use |
|
| By Region |
|
Traditional medicine administration techniques, such as vials and syringes, are prone to dosing and handling errors, as well as an elevated risk of infection. Pre-filled syringes and reusable glass syringes, which are a safe and very effective way of pharmaceutical administration to the body, can also help to decrease this. Growing patient awareness and demand in less intrusive injectable pharmaceutical administration is propelling global market growth. Furthermore, the advent of low-cost methods is fueling the global injectable drug delivery market expansion due to its effectiveness, on-target delivery, and simplicity. Furthermore, the rapid development of healthcare infrastructure and growing innovations for producing revolutionary drug delivery systems are predicted to promote product sales, supporting the market’s expansion throughout the forecast period.
The medication delivery sector is greatly influenced by technological advancements. For example, Lexaria Bioscience stated in March 2020 that it will begin testing its Dehydra Tech drug delivery technique against COVID-19. In addition, Mitsubishi announced an upgrade to OXYCAPT, a multilayer plastic vial and syringe with many qualities such as outstanding oxygen barrier, UV barrier, and others, in October 2019.
As a result, increasing R&D expenditure and the development of improved products by manufacturers are likely to drive market expansion. Furthermore, the global use of wearable, pen injectors, and needle-free injectors for the management of infectious and chronic illnesses will boost market potential throughout the projection period.
In 2020, many countries faced strict lockdowns due to the covid-19 pandemic. These lockdowns have resulted in the partial or complete shutdown of manufacturing facilities. The shutdown of manufacturing facilities had a major impact on the consumption of materials. This led to reduced transportation resulting in a slowing down of updating the railway operation. However, with the ease of lockdown manufacturing sector is expected to return to its normal growth. The global injectable drug delivery market is crowded with established players. These players have a commanding say in the market. The operation used in the injectable drug delivery market is proprietary and needs long-term research and development planning implemented efficiently.

Injectable Drug Delivery Market Segment Analysis
On the basis of type, the injectable drug delivery market is segmented into devices, and formulations. The injectable medication delivery industry is further subdivided into formulation and devices. During the projection period, the formulation sector is predicted to develop at the fastest CAGR. This market segment’s rapid rise may be ascribed to the increasing prevalence of chronic illnesses, patient adherence, and the increased acceptance of self-injection, innovative technologies, and biologics.
Based on the facility of use the injectable drug delivery market is divided into hospitals & clinics, home care settings, and other facilities of use. Hospitals and clinics are expected to dominate the industry. The increasing prevalence of chronic diseases, patient compliance, and technological advancements all contribute to the expansion of this category.

Injectable Drug Delivery Market Players
From large companies to small ones, many companies are actively working in the Injectable Drug Delivery market. These key players include Becton, Dickinson and Company, Pfizer Inc., Teva Pharmaceuticals Industries Ltd., Eli Lilly and Company, Baxter International Inc., Schott AG, Hergesheimer, Psalmed, B. Braun Melsungen, and others.
Companies are mainly in injectable drug delivery they are competing closely with each other. Innovation is one of the most important key strategies as it has to be for any market. However, companies in the market have also opted for and successfully driven inorganic growth strategies like mergers & acquisitions, and so on.
- In 2016, Gerresheimer has expanded its partnership with Taisei Medical Co. Ltd. (Japan) to promote its ClearJect syringes and provide technical support to its clients. In addition, the company intends to expand its COP syringe line in collaboration with Taisei Medical by producing a new Gx RTF ClearJect brand by combining ClearJect with its glass RTF (ready-to-fill) concept.
- In 2015, Eli Lilly and Company and the Sanford-Burnham Medical Research Institute (US) have formed a partnership to research immunological therapeutics for lupus, Sjögren’s syndrome, inflammatory bowel disease, and other autoimmune diseases.
- In 2014, Terumo Corporation worked with the Ypsomed Group (a Switzerland-based injection systems manufacturer). Through this agreement, the company integrated its PLAJEX prefillable polymer syringe with YpsoMate (an autoinjector system from Ypsomed).
Who Should Buy? Or Key Stakeholders
- Injectable Drug Delivery suppliers
- Investors
- End user companies
- Research institutes
- Others
Injectable Drug Delivery Market Regional Analysis
The injectable drug delivery market includes North America, Asia-Pacific (APAC), Europe, Middle East & Africa (MEA), and South America.
- North America: includes the US, Canada, Mexico
- Asia Pacific: includes China, Japan, South Korea, India, Australia, ASEAN and Rest of APAC
- Europe: includes UK, Germany, France, Italy, Spain, Russia, and Rest of Europe
- South America: includes Brazil, Argentina and Rest of South America
- Middle East & Africa: includes Turkey, UAE, Saudi Arabia, South Africa, and the Rest of MEA
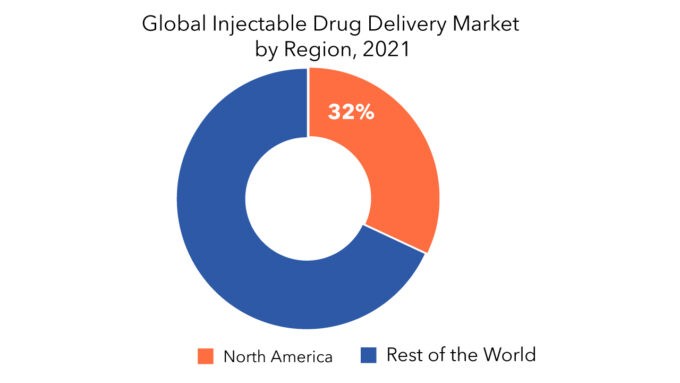
Its major share is occupied by Asia Pacific, North America, Middle East & Africa (MEA), and Europe. North America shares 32% of the total market. The factors contributing to the region’s market growth include the increasing number of injectable drug delivery production plants and the rapid usage of injectable drug delivery. The market in the region is expanding as a result of increased foreign investment due to low labor costs and the availability of raw resources.

Key Market Segments: Injectable Drug Delivery Market
Injectable Drug Delivery Market by Type, 2020-2029, (USD Millions)
- Devices
- Formulations
Injectable Drug Delivery Market by Facility of Use, 2020-2029, (USD Millions)
- Hospitals & Clinics
- Home Care Settings
- Other Facilities Of Use
Injectable Drug Delivery Market by Region, 2020-2029, (USD Millions)
- North America
- Europe
- Asia Pacific
- South America
- Middle East And Africa
Important countries in all regions are covered.
Key Question Answered
- What is the worth of global injectable drug delivery market?
- What are the new trends and advancements in the injectable drug delivery market?
- Which product categories are expected to have the highest growth rate in the injectable drug delivery market?
- Which are the key factors driving the injectable drug delivery market?
- What will the market growth rate, growth momentum, or acceleration the market carries during the forecast period?
Table of Content
- Introduction
- Market Definition
- Market Segmentation
- Research Timelines
- Assumptions and Limitations
- Research Methodology
- Data Mining
- Secondary Research
- Primary Research
- Subject-Matter Experts’ Advice
- Quality Checks
- Final Review
- Data Triangulation
- Bottom-Up Approach
- Top-Down Approach
- Research Flow
- Data Sources
- Data Mining
- Executive Summary
- Market Overview
- Global Injectable Drug Delivery Market Outlook
- Market Drivers
- Market Restraints
- Market Opportunities
- Impact of Covid-19 On Global Injectable Drug Delivery Market
- Global Injectable Drug Delivery Market Outlook
- Global Injectable Drug Delivery Market by Type, (USD Million)
- Devices
- Formulations
- Global Injectable Drug Delivery Market by Facility of Use, (USD Million)
- Hospitals & Clinics
- Home Care Settings
- Other Facilities of Use
- Global Injectable Drug Delivery Market by Region, (USD Million)
- Introduction
- Asia-Pacific
- China
- India
- Japan
- South Korea
- Australia
- South-East Asia
- Rest of Asia-Pacific
- North America
- United States
- Canada
- Mexico
- Europe
- Germany
- United Kingdom
- France
- Italy
- Spain
- Russia
- Rest of Europe
- South America
- Brazil
- Argentina
- Colombia
- Rest of South America
- Middle East and Africa
- UAE
- Saudi Arabia
- South Africa
- Rest of Middle East and Africa
- Company Profiles* (Business Overview, Company Snapshot, Types Offered, Recent Developments)
- Becton
- Dickinson and Company
- Pfizer Inc.
- Teva Pharmaceuticals Industries Ltd.
- Eli Lilly and Company
- Baxter International Inc.
- Schott AG
- Gerresheimer
- Ypsomed
- Braun Melsungen
- *The Company List Is Indicative
LIST OF TABLES
TABLE 1 GLOBAL INJECTABLE DRUG DELIVERY MARKET BY FABRIC MATERIAL (USD MILLIONS) 2020-2029
TABLE 2 GLOBAL INJECTABLE DRUG DELIVERY MARKET BY FILTER MEDIA (USD MILLIONS) 2020-2029
TABLE 3 GLOBAL INJECTABLE DRUG DELIVERY MARKET BY END USER (USD MILLIONS) 2020-2029
TABLE 4 GLOBAL INJECTABLE DRUG DELIVERY MARKET BY REGION (USD MILLIONS) 2020-2029
TABLE 5 US INJECTABLE DRUG DELIVERY MARKET BY FABRIC MATERIAL (USD MILLIONS) 2020-2029
TABLE 6 US INJECTABLE DRUG DELIVERY MARKET BY FILTER MEDIA (USD MILLIONS) 2020-2029
TABLE 7 US INJECTABLE DRUG DELIVERY MARKET BY END USER (USD MILLIONS) 2020-2029
TABLE 8 CANADA INJECTABLE DRUG DELIVERY MARKET BY FABRIC MATERIAL (USD MILLIONS) 2020-2029
TABLE 9 CANADA INJECTABLE DRUG DELIVERY MARKET BY FILTER MEDIA (USD MILLIONS) 2020-2029
TABLE 10 CANADA INJECTABLE DRUG DELIVERY MARKET BY END USER (USD MILLIONS) 2020-2029
TABLE 11 MEXICO INJECTABLE DRUG DELIVERY MARKET BY FABRIC MATERIAL (USD MILLIONS) 2020-2029
TABLE 12 MEXICO INJECTABLE DRUG DELIVERY MARKET BY FILTER MEDIA (USD MILLIONS) 2020-2029
TABLE 13 MEXICO INJECTABLE DRUG DELIVERY MARKET BY END USER (USD MILLIONS) 2020-2029
TABLE 14 BRAZIL INJECTABLE DRUG DELIVERY MARKET BY FABRIC MATERIAL (USD MILLIONS) 2020-2029
TABLE 15 BRAZIL INJECTABLE DRUG DELIVERY MARKET BY FILTER MEDIA (USD MILLIONS) 2020-2029
TABLE 16 BRAZIL INJECTABLE DRUG DELIVERY MARKET BY END USER (USD MILLIONS) 2020-2029
TABLE 17 ARGENTINA INJECTABLE DRUG DELIVERY MARKET BY FABRIC MATERIAL (USD MILLIONS) 2020-2029
TABLE 18 ARGENTINA INJECTABLE DRUG DELIVERY MARKET BY FILTER MEDIA (USD MILLIONS) 2020-2029
TABLE 19 ARGENTINA INJECTABLE DRUG DELIVERY MARKET BY END USER (USD MILLIONS) 2020-2029
TABLE 20 COLOMBIA INJECTABLE DRUG DELIVERY MARKET BY FABRIC MATERIAL (USD MILLIONS) 2020-2029
TABLE 21 COLOMBIA INJECTABLE DRUG DELIVERY MARKET BY FILTER MEDIA (USD MILLIONS) 2020-2029
TABLE 22 COLOMBIA INJECTABLE DRUG DELIVERY MARKET BY END USER (USD MILLIONS) 2020-2029
TABLE 23 REST OF SOUTH AMERICA INJECTABLE DRUG DELIVERY MARKET BY FABRIC MATERIAL (USD MILLIONS) 2020-2029
TABLE 24 REST OF SOUTH AMERICA INJECTABLE DRUG DELIVERY MARKET BY FILTER MEDIA (USD MILLIONS) 2020-2029
TABLE 25 REST OF SOUTH AMERICA INJECTABLE DRUG DELIVERY MARKET BY END USER (USD MILLIONS) 2020-2029
TABLE 26 INDIA INJECTABLE DRUG DELIVERY MARKET BY FABRIC MATERIAL (USD MILLIONS) 2020-2029
TABLE 27 INDIA INJECTABLE DRUG DELIVERY MARKET BY FILTER MEDIA (USD MILLIONS) 2020-2029
TABLE 28 INDIA INJECTABLE DRUG DELIVERY MARKET BY END USER (USD MILLIONS) 2020-2029
TABLE 29 CHINA INJECTABLE DRUG DELIVERY MARKET BY FABRIC MATERIAL (USD MILLIONS) 2020-2029
TABLE 30 CHINA INJECTABLE DRUG DELIVERY MARKET BY FILTER MEDIA (USD MILLIONS) 2020-2029
TABLE 31 CHINA INJECTABLE DRUG DELIVERY MARKET BY END USER (USD MILLIONS) 2020-2029
TABLE 32 JAPAN INJECTABLE DRUG DELIVERY MARKET BY FABRIC MATERIAL (USD MILLIONS) 2020-2029
TABLE 33 JAPAN INJECTABLE DRUG DELIVERY MARKET BY FILTER MEDIA (USD MILLIONS) 2020-2029
TABLE 34 JAPAN INJECTABLE DRUG DELIVERY MARKET BY END USER (USD MILLIONS) 2020-2029
TABLE 35 SOUTH KOREA INJECTABLE DRUG DELIVERY MARKET BY FABRIC MATERIAL (USD MILLIONS) 2020-2029
TABLE 36 SOUTH KOREA INJECTABLE DRUG DELIVERY MARKET BY FILTER MEDIA (USD MILLIONS) 2020-2029
TABLE 37 SOUTH KOREA INJECTABLE DRUG DELIVERY MARKET BY END USER (USD MILLIONS) 2020-2029
TABLE 38 AUSTRALIA INJECTABLE DRUG DELIVERY MARKET BY FABRIC MATERIAL (USD MILLIONS) 2020-2029
TABLE 39 AUSTRALIA INJECTABLE DRUG DELIVERY MARKET BY FILTER MEDIA (USD MILLIONS) 2020-2029
TABLE 40 AUSTRALIA INJECTABLE DRUG DELIVERY MARKET BY END USER (USD MILLIONS) 2020-2029
TABLE 41 SOUTH-EAST ASIA INJECTABLE DRUG DELIVERY MARKET BY FABRIC MATERIAL (USD MILLIONS) 2020-2029
TABLE 42 SOUTH-EAST ASIA INJECTABLE DRUG DELIVERY MARKET BY FILTER MEDIA (USD MILLIONS) 2020-2029
TABLE 43 SOUTH-EAST ASIA INJECTABLE DRUG DELIVERY MARKET BY END USER (USD MILLIONS) 2020-2029
TABLE 44 REST OF ASIA PACIFIC INJECTABLE DRUG DELIVERY MARKET BY FABRIC MATERIAL (USD MILLIONS) 2020-2029
TABLE 45 REST OF ASIA PACIFIC INJECTABLE DRUG DELIVERY MARKET BY FILTER MEDIA (USD MILLIONS) 2020-2029
TABLE 46 REST OF ASIA PACIFIC INJECTABLE DRUG DELIVERY MARKET BY END USER (USD MILLIONS) 2020-2029
TABLE 47 GERMANY INJECTABLE DRUG DELIVERY MARKET BY FABRIC MATERIAL (USD MILLIONS) 2020-2029
TABLE 48 GERMANY INJECTABLE DRUG DELIVERY MARKET BY FILTER MEDIA (USD MILLIONS) 2020-2029
TABLE 49 GERMANY INJECTABLE DRUG DELIVERY MARKET BY END USER (USD MILLIONS) 2020-2029
TABLE 50 UK INJECTABLE DRUG DELIVERY MARKET BY FABRIC MATERIAL (USD MILLIONS) 2020-2029
TABLE 51 UK INJECTABLE DRUG DELIVERY MARKET BY FILTER MEDIA (USD MILLIONS) 2020-2029
TABLE 52 UK INJECTABLE DRUG DELIVERY MARKET BY END USER (USD MILLIONS) 2020-2029
TABLE 53 FRANCE INJECTABLE DRUG DELIVERY MARKET BY FABRIC MATERIAL (USD MILLIONS) 2020-2029
TABLE 54 FRANCE INJECTABLE DRUG DELIVERY MARKET BY FILTER MEDIA (USD MILLIONS) 2020-2029
TABLE 55 FRANCE INJECTABLE DRUG DELIVERY MARKET BY END USER (USD MILLIONS) 2020-2029
TABLE 56 ITALY INJECTABLE DRUG DELIVERY MARKET BY FABRIC MATERIAL (USD MILLIONS) 2020-2029
TABLE 57 ITALY INJECTABLE DRUG DELIVERY MARKET BY FILTER MEDIA (USD MILLIONS) 2020-2029
TABLE 58 ITALY INJECTABLE DRUG DELIVERY MARKET BY END USER (USD MILLIONS) 2020-2029
TABLE 59 SPAIN INJECTABLE DRUG DELIVERY MARKET BY FABRIC MATERIAL (USD MILLIONS) 2020-2029
TABLE 60 SPAIN INJECTABLE DRUG DELIVERY MARKET BY FILTER MEDIA (USD MILLIONS) 2020-2029
TABLE 61 SPAIN INJECTABLE DRUG DELIVERY MARKET BY END USER (USD MILLIONS) 2020-2029
TABLE 62 RUSSIA INJECTABLE DRUG DELIVERY MARKET BY FABRIC MATERIAL (USD MILLIONS) 2020-2029
TABLE 63 RUSSIA INJECTABLE DRUG DELIVERY MARKET BY FILTER MEDIA (USD MILLIONS) 2020-2029
TABLE 64 RUSSIA INJECTABLE DRUG DELIVERY MARKET BY END USER (USD MILLIONS) 2020-2029
TABLE 65 REST OF EUROPE INJECTABLE DRUG DELIVERY MARKET BY FABRIC MATERIAL (USD MILLIONS) 2020-2029
TABLE 66 REST OF EUROPE INJECTABLE DRUG DELIVERY MARKET BY FILTER MEDIA (USD MILLIONS) 2020-2029
TABLE 67 REST OF EUROPE INJECTABLE DRUG DELIVERY MARKET BY END USER (USD MILLIONS) 2020-2029
TABLE 68 UAE INJECTABLE DRUG DELIVERY MARKET BY FABRIC MATERIAL (USD MILLIONS) 2020-2029
TABLE 69 UAE INJECTABLE DRUG DELIVERY MARKET BY FILTER MEDIA (USD MILLIONS) 2020-2029
TABLE 70 UAE INJECTABLE DRUG DELIVERY MARKET BY END USER (USD MILLIONS) 2020-2029
TABLE 71 SAUDI ARABIA INJECTABLE DRUG DELIVERY MARKET BY FABRIC MATERIAL (USD MILLIONS) 2020-2029
TABLE 72 SAUDI ARABIA INJECTABLE DRUG DELIVERY MARKET BY FILTER MEDIA (USD MILLIONS) 2020-2029
TABLE 73 SAUDI ARABIA INJECTABLE DRUG DELIVERY MARKET BY END USER (USD MILLIONS) 2020-2029
TABLE 74 SOUTH AFRICA INJECTABLE DRUG DELIVERY MARKET BY FABRIC MATERIAL (USD MILLIONS) 2020-2029
TABLE 75 SOUTH AFRICA INJECTABLE DRUG DELIVERY MARKET BY FILTER MEDIA (USD MILLIONS) 2020-2029
TABLE 76 SOUTH AFRICA INJECTABLE DRUG DELIVERY MARKET BY END USER (USD MILLIONS) 2020-2029
TABLE 77 REST OF MIDDLE EAST AND AFRICA INJECTABLE DRUG DELIVERY MARKET BY FABRIC MATERIAL (USD MILLIONS) 2020-2029
TABLE 78 REST OF MIDDLE EAST AND AFRICA INJECTABLE DRUG DELIVERY MARKET BY FILTER MEDIA (USD MILLIONS) 2020-2029
TABLE 79 REST OF MIDDLE EAST AND AFRICA INJECTABLE DRUG DELIVERY MARKET BY END USER (USD MILLIONS) 2020-2029
LIST OF FIGURES
FIGURE 1 MARKET DYNAMICS
FIGURE 2 MARKET SEGMENTATION
FIGURE 3 REPORT TIMELINES: YEARS CONSIDERED
FIGURE 4 DATA TRIANGULATION
FIGURE 5 BOTTOM-UP APPROACH
FIGURE 6 TOP-DOWN APPROACH
FIGURE 7 RESEARCH FLOW
FIGURE 8 GLOBAL INJECTABLE DRUG DELIVERY MARKET BY TYPE, USD MILLION, 2020-2029
FIGURE 9 GLOBAL INJECTABLE DRUG DELIVERY MARKET BY FACILITY OF USE, USD MILLION, 2020-2029
FIGURE 10 GLOBAL INJECTABLE DRUG DELIVERY MARKET BY REGION, USD MILLION, 2020-2029
FIGURE 11 PORTER’S FIVE FORCES MODEL
FIGURE 12 INJECTABLE DRUG DELIVERY MARKET BY REGION 2020
FIGURE 13 MARKET SHARE ANALYSIS
FIGURE 14 BECTON: COMPANY SNAPSHOT
FIGURE 15 DICKINSON AND COMPANY: COMPANY SNAPSHOT
FIGURE 16 PFIZER INC.: COMPANY SNAPSHOT
FIGURE 17 TEVA PHARMACEUTICALS INDUSTRIES LTD.: COMPANY SNAPSHOT
FIGURE 18 ELI LILLY AND COMPANY: COMPANY SNAPSHOT
FIGURE 19 BAXTER INTERNATIONAL INC.: COMPANY SNAPSHOT
FIGURE 20 SCHOTT AG: COMPANY SNAPSHOT
FIGURE 21 GERRESHEIMER: COMPANY SNAPSHOT
FIGURE 22 YPSOMED: COMPANY SNAPSHOT
FIGURE 23 B. BRAUN MELSUNGEN: COMPANY SNAPSHOT
FAQ
Growth in the biologics market will offer several opportunities.
The global injectable drug delivery market registered a CAGR of 6.24% from 2022 to 2029.
North America holds the largest regional market for the injectable drug delivery market.
The high costs associated with gadgets and therapies will hinder market growth.
In-Depth Database
Our Report’s database covers almost all topics of all regions over the Globe.
Recognised Publishing Sources
Tie ups with top publishers around the globe.
Customer Support
Complete pre and post sales
support.
Safe & Secure
Complete secure payment
process.
