REPORT OUTLOOK
| Market Size | CAGR | Dominating Region |
|---|---|---|
| USD 16.63 Billion by 2030 | 16.7% | North America |
| By Product | By Method | By Technique |
|---|---|---|
|
|
|
SCOPE OF THE REPORT
Epigenetics Market Overview
The epigenetics market is expected to grow at 16.7% CAGR from 2023 to 2030. It is expected to reach above USD 16.63 Billion by 2030 from USD 5.64 Billion in 2023.
The study of epigenetics, a subfield of genetics, focuses on cellular and physiological alterations brought on by environmental or environmental variables that switch genes on and off and affect cells’ ability to read genes independently of genotype. Although the underlying DNA or RNA sequence is unaltered, epigenetics alters the phenotype rather than the genotype of an organism. Since epigenetic modifications are dynamic and alter in response to environmental factors, they are crucial for development. Technological developments related to epigenetics are a primary driver of the epigenetics market’s expansion. Due to benefits like the requirement for low input sample concentration and the absence of experimental bias in microarrays, epigenetics-based assays are much more beneficial and advantageous than conventional microarrays.
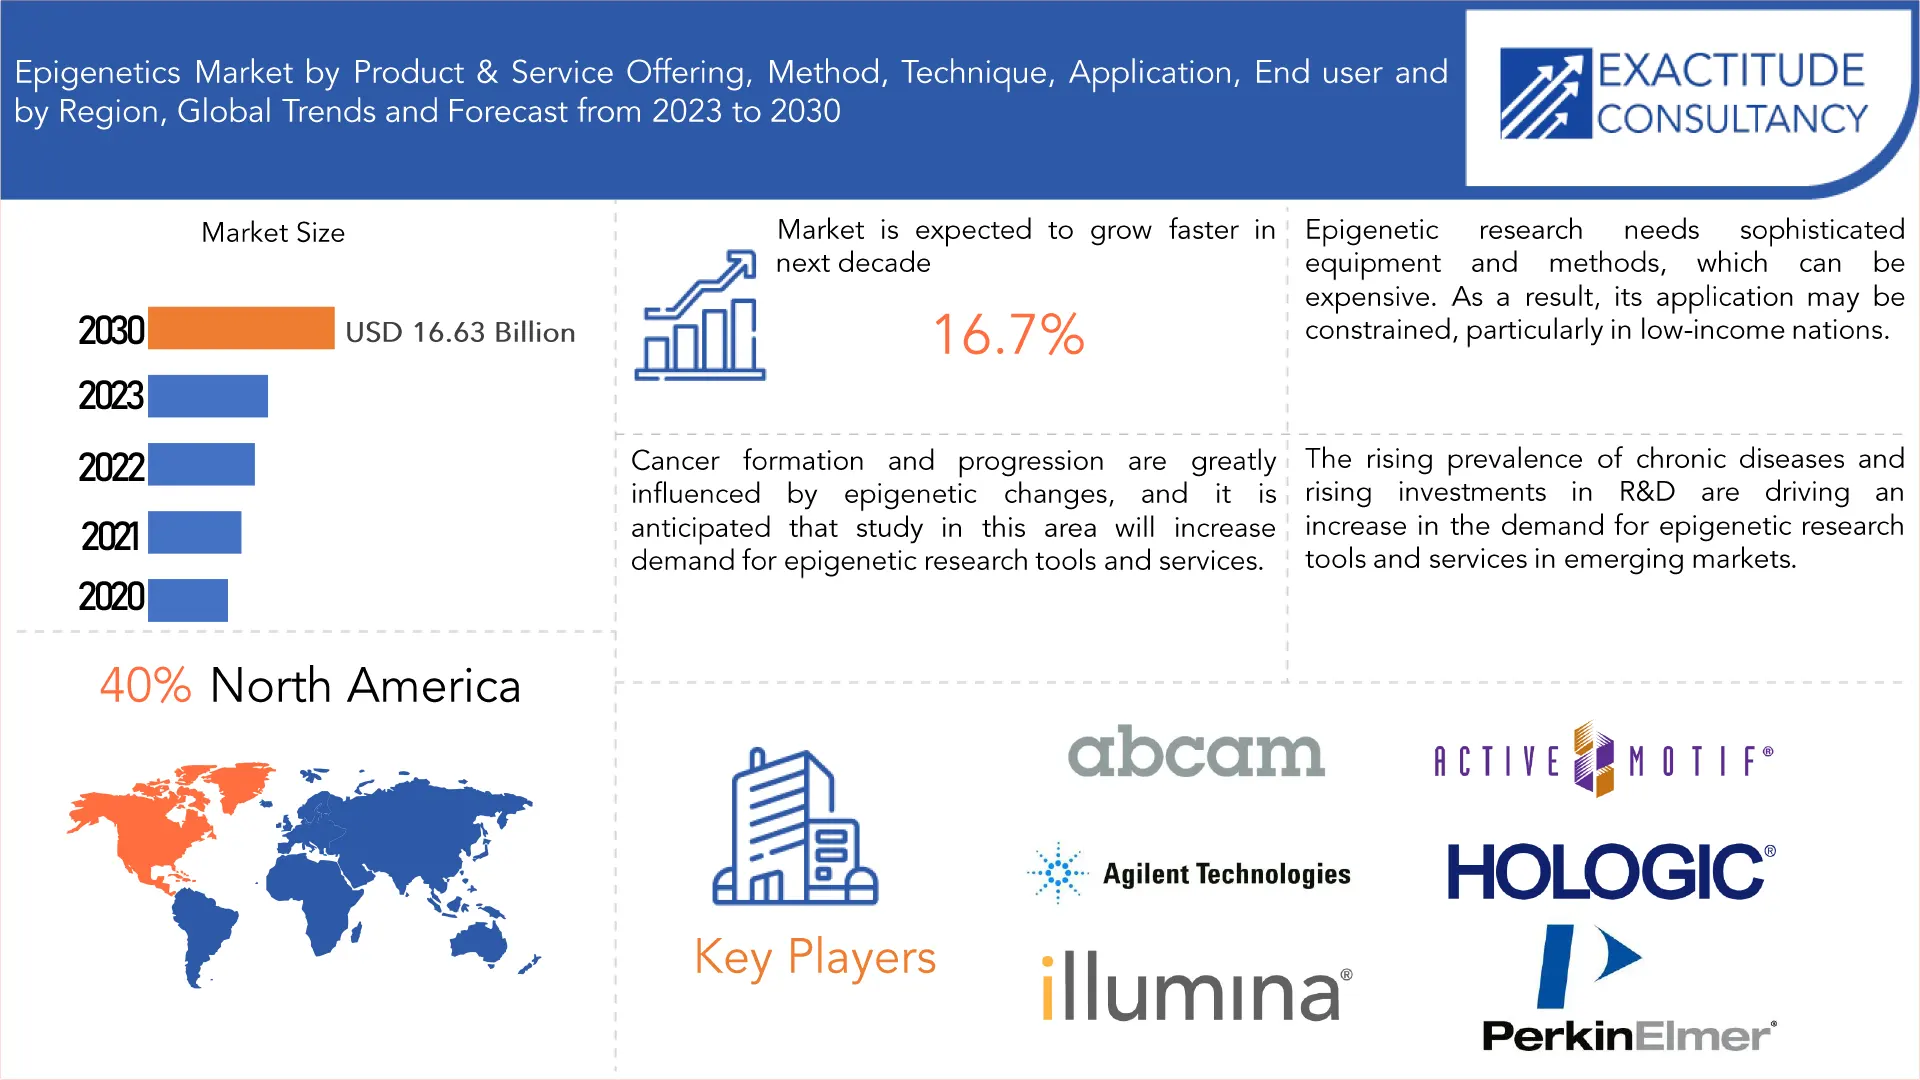
Advanced epigenetic sequencing platforms and devices have been the focus of research. The market is also driven by the rise of cancer, infectious disorders, and hereditary abnormalities. Drugs discovered through exhaustive epigenetic research effectively treat a particular form of cancer, enabling them to lower treatment costs and provide care at affordable prices in developing and underdeveloped nations. In contrast to conventional cancer therapies, epigenetics offers targeted therapeutic actions that exclusively focus on afflicted and malignant host cells. Therefore, it is anticipated that an increase in cancer incidences worldwide will considerably fuel the growth of the epigenetics sector.
Due to significant expenditures in DNA sequencing technologies and intensive work on genome projects around the world, R&D activities associated with DNA sequencing have also gained traction. Healthcare research is expanding as a result of an increase in patients around the world. Additionally, the need for higher quality healthcare creates a demand for healthcare research. Governments from various countries therefore intend to concentrate their spending in healthcare research in order to address patient demands for newer and better technology while maintaining quality standards. Therefore, the expansion of the epigenetics market is greatly supported by the increase in research projects.
Additionally, it is believed that the COVID-19 epidemic will benefit the epigenetics industry. To expand hospital capacity for patients with COVID-19 diagnoses, a sizable number of clinics and hospitals around the world underwent restructuring. The fast increase of COVID-19 cases resulted in a potential backlog for non-essential procedures. In order to create vaccines and treatments that directly target viral replication pathways, researchers have started to grasp how epigenetics may inhibit viral multiplication.
| ATTRIBUTE | DETAILS |
| Study period | 2020-2030 |
| Base year | 2022 |
| Estimated year | 2023 |
| Forecasted year | 2023-2030 |
| Historical period | 2019-2021 |
| Unit | Value (USD Billion) |
| Segmentation | By Product & Service Offering, By Method, By Technique, By Application, By End User, By Region |
| By Product & service offering |
|
| By Method |
|
| By Technique |
|
| By Application |
|
| By End User |
|
| By Region |
|
Epigenetics Market Segment Analysis
The epigenetics market is segmented based on product & service offering, method, technique, application, end user, and region.
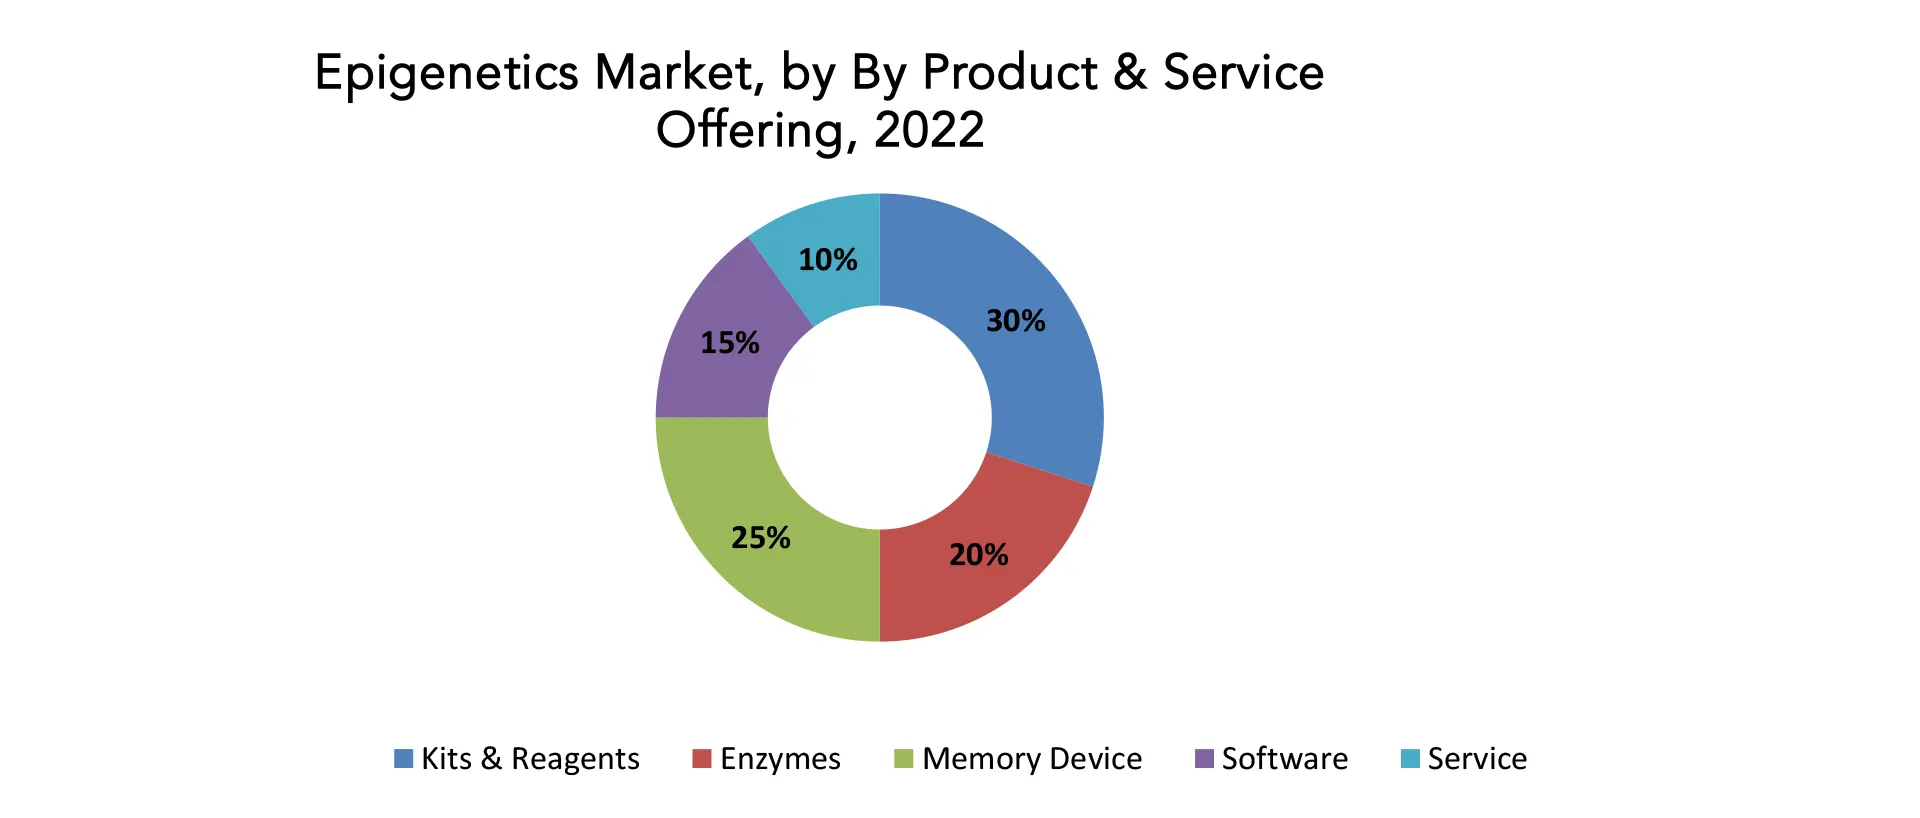
The market is divided into kits and reagents, enzymes, instruments and accessories, software, and service based on product and service. The market’s biggest revenue share was created by the kits and reagents segment, which can be due to the rapid development of cutting-edge, cost-effective, and simple-to-use epigenetics kits and reagents. The exponential growth in the quantity of epigenetics research studies throughout time is another factor driving this. During the projection period, the software segment is anticipated to increase at the greatest CAGR. The market for epigenetic sequencing has seen a considerable rise in the need for software products. These products help with the study of complicated epigenetic changes.
Based on method, the market is segmented into DNA methylation, histone modifications, histone acetylation, RNA interference. Studies on epigenetics are currently using a variety of histone modifications, including as ubiquitination, acetylation, citrullination, methylation, and phosphorylation. Through the forecast period, research efforts aimed at elucidating the significance of histone alterations in both cancer and non-oncology applications are anticipated to augment segment growth.
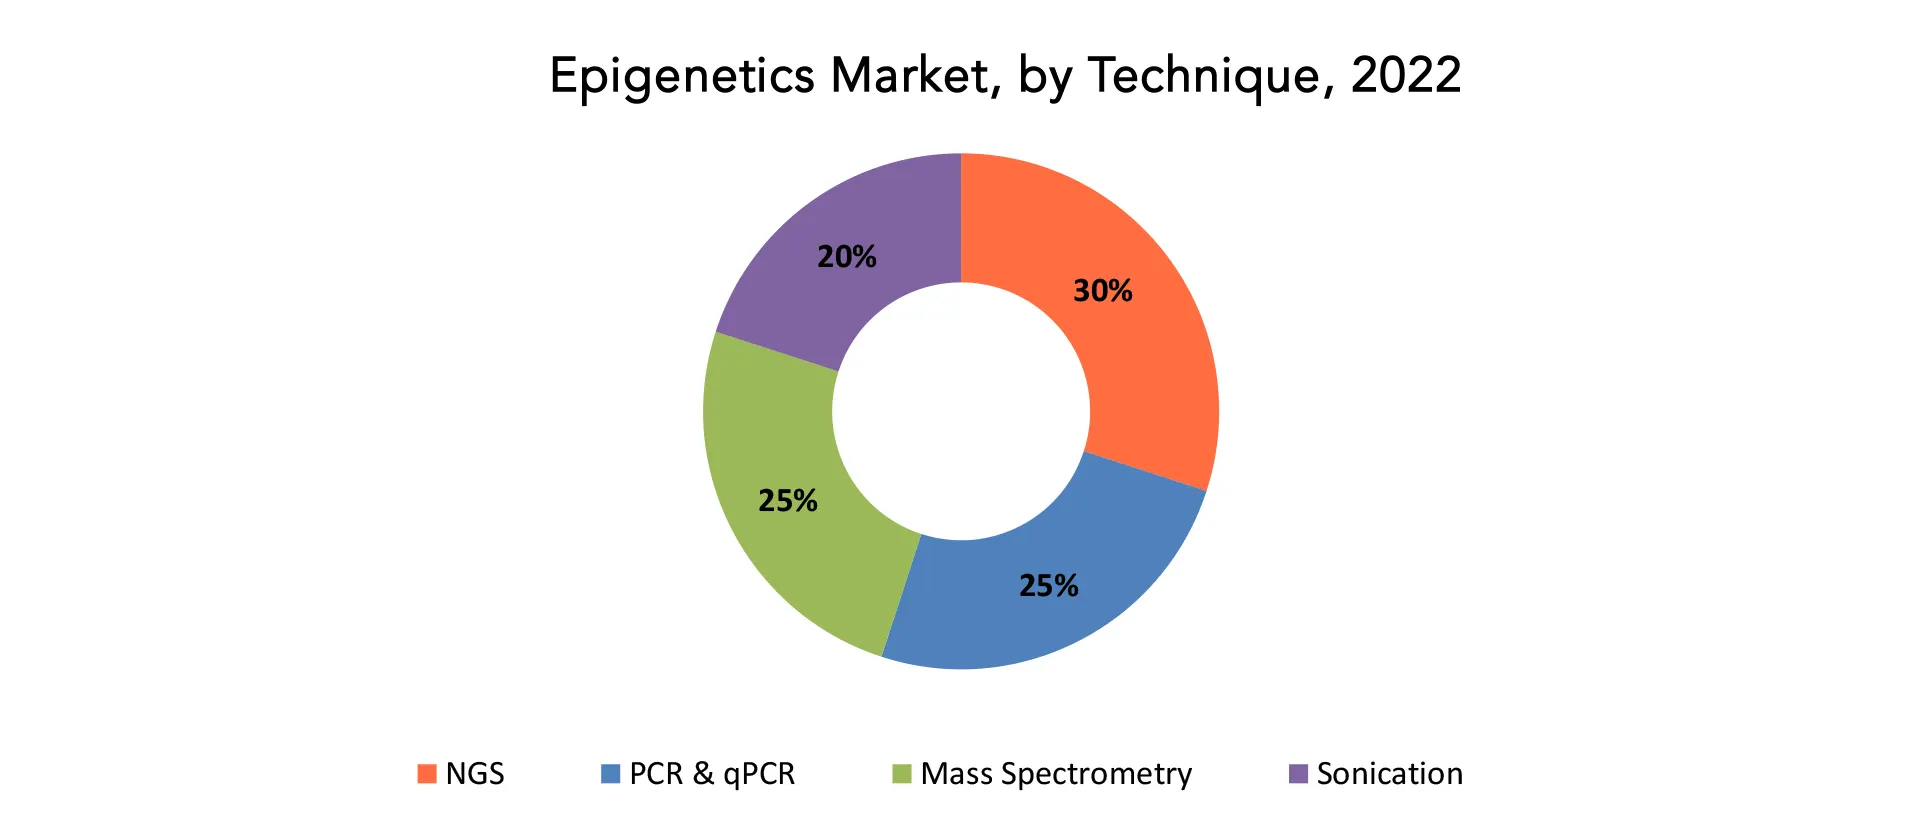
Based on technique, the market is segmented into NGS, PCR & qPCR, mass spectrometry, sonication. The largest revenue generated by the NGS segment in the market for the year 2022 has been attributed to an increase in demand for NGS platforms among research experts seeking to acquire clinically informative and comprehensive datasets. Additionally, due to their capacity to quickly sequence epigenomes, NGS technologies are gaining popularity in mutational and epigenetic research activities. The market for PCR and qPCR is anticipated to expand quickly and have the highest CAGR throughout the forecast period.
The market is divided into oncology, metabolic illnesses, immunology, developmental biology, cardiovascular diseases, based on the use of the products. Research on therapeutic options for these disorders is anticipated to drive the adoption of epigenetics products as their importance in understanding the aetiology of CVDS grows. Due to the opportunity provided by epigenetic processes including histone modification and DNA methylation to create new cancer therapy techniques, oncology applications dominated the market in 2022.
Based on end user, the market is segmented into academic & research institutes, pharmaceutical & biotechnology companies, hospitals & clinics. The main source of income for the academic & research institutes sector is the expansion of the use of epigenetics products in government research facilities and academic labs. During the projection period, the pharmaceutical & biotechnology businesses segment is predicted to develop at the fastest rate.
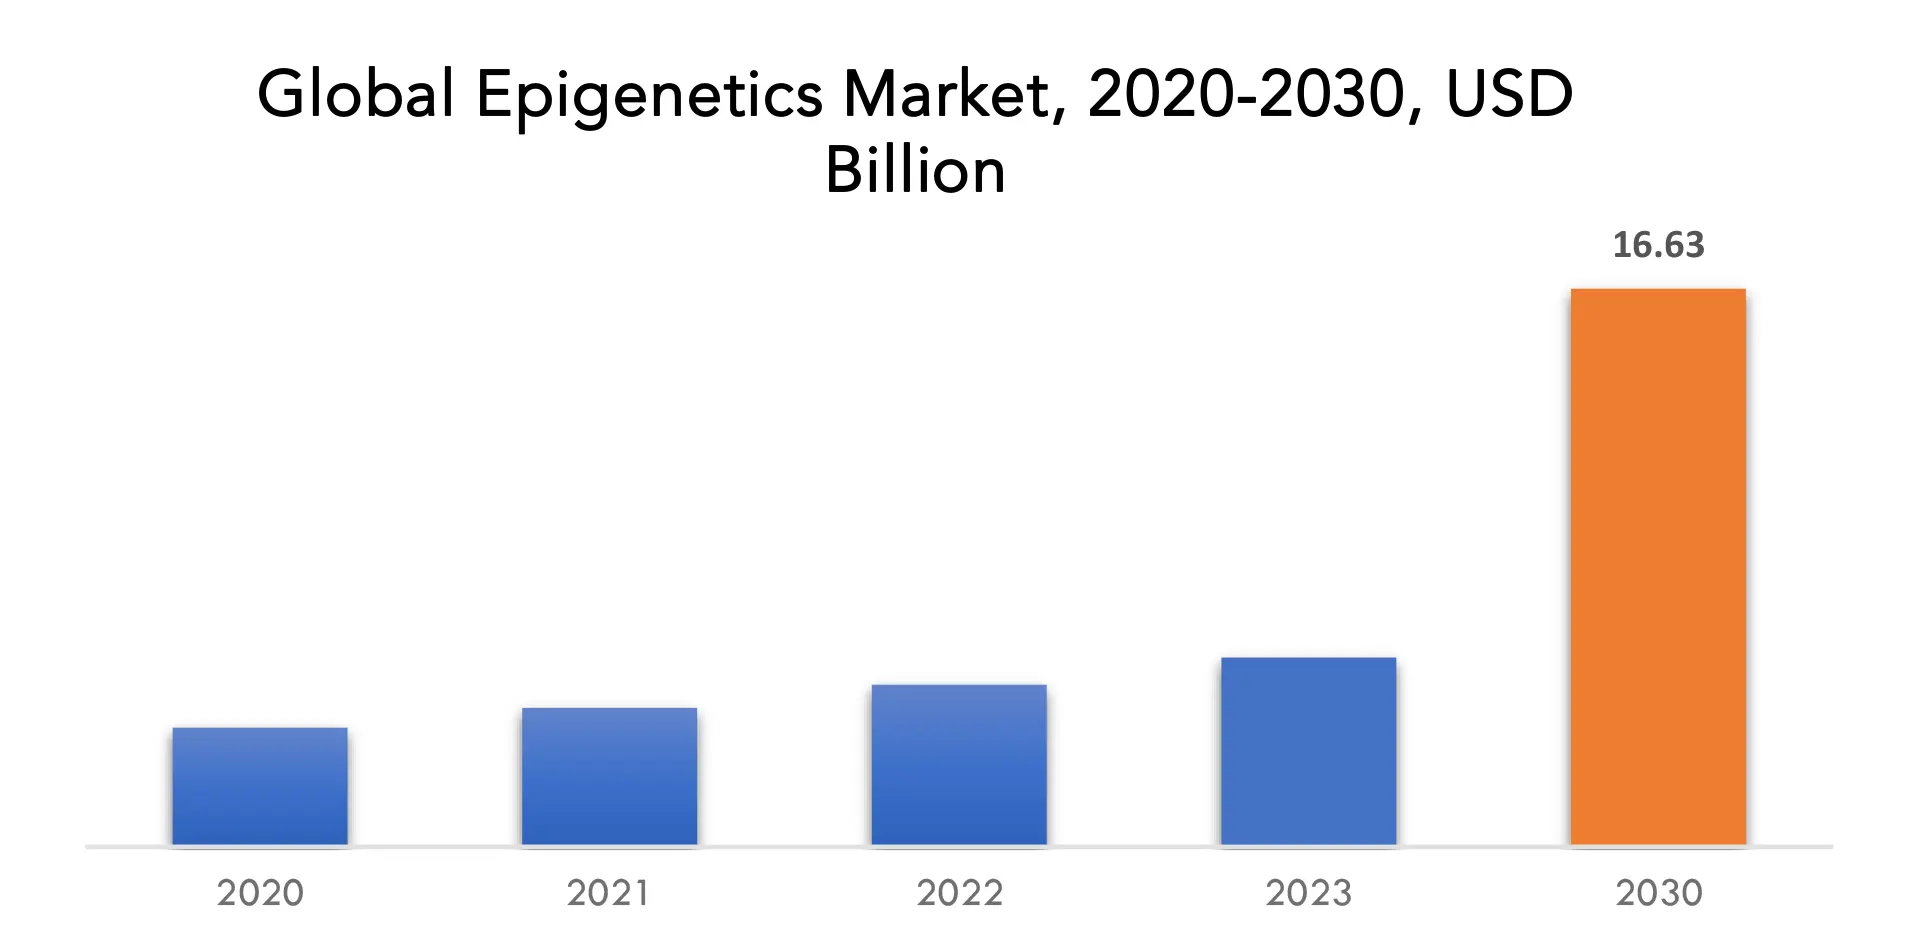
Epigenetics Market Players
The epigenetics market key players include Abcam Plc., Active Motif, Inc., Agilent Technologies, Inc., Hologic Inc., Illumina Inc., Merck Millipore, PerkinElmer, Inc., QIAGEN N.V., Thermo Fisher Scientific Inc., Zymo Research, PacBio, Bio-Rad Laboratories, Promega Corporation, Diagenode, England Biolabs.
03 January, 2023: Thermo Fisher Scientific Inc., the world leader in serving science, announced acquisition of The Binding Site Group, a global leader in specialty diagnostics.
23 February, 2023: Thermo Fisher Scientific Inc., the world leader in serving science, announced a 15-year strategic collaboration agreement with Moderna, Inc., a biotechnology company pioneering messenger RNA (mRNA). The agreement will enable dedicated large-scale manufacturing in US.
Who Should Buy? Or Key stakeholders
- Pharmaceutical and Biotechnological Companies
- Diagnostics and Clinical Laboratories
- Healthcare Providers
- Epigenetics Research Tools and Technologies Suppliers
- Contract Research Organizations (CROs)
- Government Bodies
- Research Organizations
- Investors
- Regulatory Authorities
Epigenetics Market Regional Analysis
The epigenetics market by region includes North America, Asia-Pacific (APAC), Europe, South America, and Middle East & Africa (MEA).
- North America: includes the US, Canada, Mexico
- Asia Pacific: includes China, Japan, South Korea, India, Australia, ASEAN and Rest of APAC
- Europe: includes UK, Germany, France, Italy, Spain, Russia, and Rest of Europe
- South America: includes Brazil, Argentina and Rest of South America
- Middle East & Africa: includes Turkey, UAE, Saudi Arabia, South Africa, and Rest of MEA
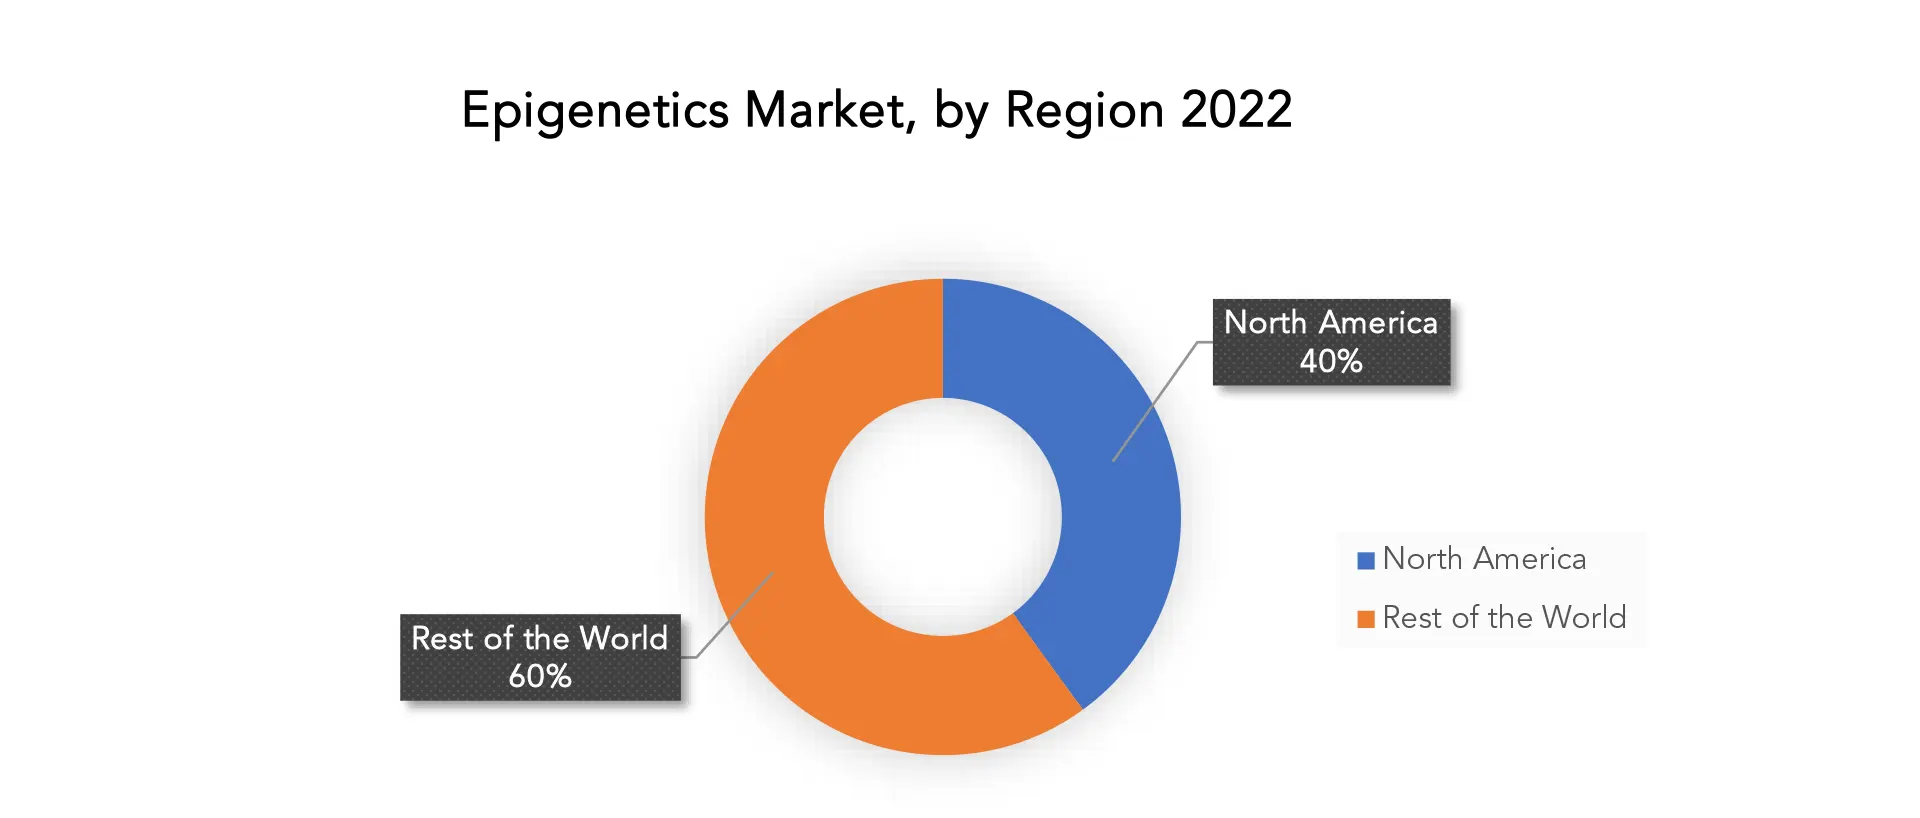
Global demand from every region is present in the epigenetics industry. But in 2022, the Epigenetics Market was dominated by North America, largely since there were numerous significant market participants and a strong research infrastructure in place. As a result of the presence of top research institutes and businesses, the US is North America’s largest market for epigenetic research. The region’s epigenetics market is expanding as a result of rising chronic illness incidence rates as well as rising R&D expenditures. In terms of growth rate, the Asia Pacific region is predicted to lead the epigenetics market in 2022.
The region’s epigenetics market is expanding as a result of the rising demand for tools and services related to epigenetic research in developing economies like China and India. The demand for epigenetic research in the area is also being fueled by the expanding use of personalised medicine and the developing trend of precision medicine. Additionally, governments in the Asia Pacific region are promoting research and development in the area of epigenetics, which is anticipated to further fuel the market’s expansion. A number of major market players are present in Europe, which is also a sizable market for the epigenetics industry, and there is a developed infrastructure for doing research there.
Key Market Segments: Epigenetics Market
Epigenetics Market By Product & Service Offering, 2020-2030, (USD Billion)
Kits & Reagents
Enzymes
Memory Device
Software
Service
Epigenetics Market By Method, 2020-2030, (USD Billion)
- DNA Methylation
- Histone Modifications
- Histone Acetylation
- RNA Interference
Epigenetics Market By Technique, 2020-2030, (USD Billion)
- NGS
- PCR & qPCR
- Mass Spectrometry
- Sonication
Epigenetics Market By Application, 2020-2030, (USD Billion)
- Oncology
- Metabolic Diseases
- Immunology
- Developmental Biology
- Cardiovascular Diseases
Epigenetics Market By End User, 2020-2030, (USD Billion)
- Academic & Research Institutes
- Pharmaceutical & Biotechnology Companies
- Hospitals & Clinics
Epigenetics Market By Region, 2020-2030, (USD Billion)
- North America
- Asia Pacific
- Europe
- South America
- Middle East And Africa
Important Countries In All Regions Are Covered.
Exactitude Consultancy Service Key Objectives:
- Increasing sales and market share
- Developing new technique
- Improving profitability
- Entering new markets
- Enhancing brand reputation
Key Question Answered
- What is the expected growth rate of the epigenetics market over the next 7 years?
- Who are the major players in the epigenetics market and what is their market share?
- What are the end-user industries driving demand for market and what is their outlook?
- What are the opportunities for growth in emerging markets such as Asia-Pacific, Middle East, and Africa?
- How is the economic environment affecting the epigenetics market, including factors such as interest rates, inflation, and exchange rates?
- What is the expected impact of government policies and regulations on the epigenetics market?
- What is the current and forecasted size and growth rate of the global epigenetics market?
- What are the key drivers of growth in the epigenetics market?
- Who are the major players in the market and what is their market share?
- What are the hospitals & clinics channels and supply chain dynamics in the epigenetics market?
- What are the technological advancements and innovations in the epigenetics market and their impact on product development and growth?
- What are the regulatory considerations and their impact on the market?
- What are the challenges faced by players in the epigenetics market and how are they addressing these challenges?
- What are the opportunities for growth and expansion in the epigenetics market?
- What are the product offerings and specifications of leading players in the market?
Table of Content
- INTRODUCTION
- MARKET DEFINITION
- MARKET SEGMENTATION
- RESEARCH TIMELINES
- ASSUMPTIONS AND LIMITATIONS
- RESEARCH METHODOLOGY
- DATA MINING
- SECONDARY RESEARCH
- PRIMARY RESEARCH
- SUBJECT-MATTER EXPERTS’ ADVICE
- QUALITY CHECKS
- FINAL REVIEW
- DATA TRIANGULATION
- BOTTOM-UP APPROACH
- TOP-DOWN APPROACH
- RESEARCH FLOW
- DATA SOURCES
- DATA MINING
- EXECUTIVE SUMMARY
- MARKET OVERVIEW
- GLOBAL EPIGENETICS MARKET OUTLOOK
- MARKET DRIVERS
- MARKET RESTRAINTS
- MARKET OPPORTUNITIES
- IMPACT OF COVID-19 ON EPIGENETICS MARKET
- PORTER’S FIVE FORCES MODEL
- THREAT FROM NEW ENTRANTS
- THREAT FROM SUBSTITUTES
- BARGAINING POWER OF SUPPLIERS
- BARGAINING POWER OF CUSTOMERS
- DEGREE OF COMPETITION
- INDUSTRY VALUE CHAIN ANALYSIS
- GLOBAL EPIGENETICS MARKET OUTLOOK
- GLOBAL EPIGENETICS MARKET BY PRODUCT & SERVICE OFFERING (USD BILLION), 2020-2030
- KITS & REAGENTS
- ENZYMES
- INSTRUMENTS & ACCESSORIES
- SOFTWARE
- SERVICE
- GLOBAL EPIGENETICS MARKET BY METHOD (USD BILLION), 2020-2030
- DNA METHYLATION
- HISTONE MODIFICATINS
- HISTONE ACETYLATION
- RNA INTERFERENCE
- GLOBAL EPIGENETICS MARKET BY TECHNIQUE (USD BILLION), 2020-2030
- NGS
- PCR & QPCR
- MASS SPECTROMETRY
- SONICATION
- GLOBAL EPIGENETICS MARKET BY APPLICATION (USD BILLION), 2020-2030
- ONCOLOGY
- METABOLIC DISEASES
- IMMUNOLOGY
- DEVELOPMENTAL BIOLOGY
- CARDIOVASCULAR DISEASES
- GLOBAL EPIGENETICS MARKET BY END USER (USD BILLION), 2020-2030
- ACADEMIC & RESEARCH INSTITUTES
- PHARMACEUTICAL & BIOTECHNOLOGY COMPANIES
- HOSPITALS & CLINICS
- GLOBAL EPIGENETICS MARKET BY REGION (USD BILLION), 2020-2030
- NORTH AMERICA
- US
- CANADA
- MEXICO
- SOUTH AMERICA
- BRAZIL
- ARGENTINA
- COLOMBIA
- REST OF SOUTH AMERICA
- EUROPE
- GERMANY
- UK
- FRANCE
- ITALY
- SPAIN
- RUSSIA
- REST OF EUROPE
- ASIA PACIFIC
- INDIA
- CHINA
- JAPAN
- SOUTH KOREA
- AUSTRALIA
- SOUTH-EAST ASIA
- REST OF ASIA PACIFIC
- MIDDLE EAST AND AFRICA
- UAE
- SAUDI ARABIA
- SOUTH AFRICA
- REST OF MIDDLE EAST AND AFRICA
- NORTH AMERICA
- COMPANY PROFILES*
(BUSINESS OVERVIEW, COMPANY SNAPSHOT, PRODUCTS OFFERED, RECENT DEVELOPMENTS)
- ABCAM PLC.
- ACTIVE MOTIF, INC.
- AGILENT TECHNOLOGIES, INC.
- HOLOGIC INC.
- ILLUMINA INC.
- MERCK MILLIPORE
- PERKINELMER, INC.
- QIAGEN N.V.
- THERMO FISHER SCIENTIFIC INC.
- ZYMO RESEARCH
- PACBIO
- BIO-RAD LABORATORIES
- PROMEGA CORPORATION
- DIAGENODE
- ENGLAND BIOLABS
*THE COMPANY LIST IS INDICATIVE
LIST OF TABLES
TABLE 1 GLOBAL EPIGENETICS MARKET BY PRODUCT & SERVICE OFFERING (USD BILLION) 2020-2030
TABLE 2 GLOBAL EPIGENETICS MARKET BY METHOD (USD BILLION) 2020-2030
TABLE 3 GLOBAL EPIGENETICS MARKET BY TECHNIQUE (USD BILLION) 2020-2030
TABLE 4 GLOBAL EPIGENETICS MARKET BY APPLICATION (USD BILLION) 2020-2030
TABLE 5 GLOBAL EPIGENETICS MARKET BY END USER (USD BILLION) 2020-2030
TABLE 6 GLOBAL EPIGENETICS MARKET BY REGION (USD BILLION) 2020-2030
TABLE 7 NORTH AMERICA EPIGENETICS MARKET BY COUNTRY (USD BILLION) 2020-2030
TABLE 8 NORTH AMERICA EPIGENETICS MARKET BY PRODUCT & SERVICE OFFERING (USD BILLION) 2020-2030
TABLE 9 NORTH AMERICA EPIGENETICS MARKET BY METHOD (USD BILLION) 2020-2030
TABLE 10 NORTH AMERICA EPIGENETICS MARKET BY TECHNIQUE (USD BILLION) 2020-2030
TABLE 11 NORTH AMERICA EPIGENETICS MARKET BY APPLICATION (USD BILLION) 2020-2030
TABLE 12 NORTH AMERICA EPIGENETICS MARKET BY END USER (USD BILLION) 2020-2030
TABLE 13 US EPIGENETICS MARKET BY PRODUCT & SERVICE OFFERING (USD BILLION) 2020-2030
TABLE 14 US EPIGENETICS MARKET BY METHOD (USD BILLION) 2020-2030
TABLE 15 US EPIGENETICS MARKET BY TECHNIQUE (USD BILLION) 2020-2030
TABLE 16 US EPIGENETICS MARKET BY APPLICATION (USD BILLION) 2020-2030
TABLE 17 US EPIGENETICS MARKET BY END USER (USD BILLION) 2020-2030
TABLE 18 CANADA EPIGENETICS MARKET BY PRODUCT & SERVICE OFFERING (USD BILLION) 2020-2030
TABLE 19 CANADA EPIGENETICS MARKET BY METHOD (USD BILLION) 2020-2030
TABLE 20 CANADA EPIGENETICS MARKET BY TECHNIQUE (USD BILLION) 2020-2030
TABLE 21 CANADA EPIGENETICS MARKET BY APPLICATION (USD BILLION) 2020-2030
TABLE 22 CANADA EPIGENETICS MARKET BY END USER (USD BILLION) 2020-2030
TABLE 23 MEXICO EPIGENETICS MARKET BY PRODUCT & SERVICE OFFERING (USD BILLION) 2020-2030
TABLE 24 MEXICO EPIGENETICS MARKET BY METHOD (USD BILLION) 2020-2030
TABLE 25 MEXICO EPIGENETICS MARKET BY TECHNIQUE (USD BILLION) 2020-2030
TABLE 26 MEXICO EPIGENETICS MARKET BY APPLICATION (USD BILLION) 2020-2030
TABLE 27 MEXICO EPIGENETICS MARKET BY END USER (USD BILLION) 2020-2030
TABLE 28 SOUTH AMERICA EPIGENETICS MARKET BY COUNTRY (USD BILLION) 2020-2030
TABLE 29 SOUTH AMERICA EPIGENETICS MARKET BY PRODUCT & SERVICE OFFERING (USD BILLION) 2020-2030
TABLE 30 SOUTH AMERICA EPIGENETICS MARKET BY METHOD (USD BILLION) 2020-2030
TABLE 31 SOUTH AMERICA EPIGENETICS MARKET BY TECHNIQUE (USD BILLION) 2020-2030
TABLE 32 SOUTH AMERICA EPIGENETICS MARKET BY APPLICATION (USD BILLION) 2020-2030
TABLE 33 SOUTH AMERICA EPIGENETICS MARKET BY END USER (USD BILLION) 2020-2030
TABLE 34 BRAZIL EPIGENETICS MARKET BY PRODUCT & SERVICE OFFERING (USD BILLION) 2020-2030
TABLE 35 BRAZIL EPIGENETICS MARKET BY METHOD (USD BILLION) 2020-2030
TABLE 36 BRAZIL EPIGENETICS MARKET BY TECHNIQUE (USD BILLION) 2020-2030
TABLE 37 BRAZIL EPIGENETICS MARKET BY APPLICATION (USD BILLION) 2020-2030
TABLE 38 BRAZIL EPIGENETICS MARKET BY END USER (USD BILLION) 2020-2030
TABLE 39 ARGENTINA EPIGENETICS MARKET BY PRODUCT & SERVICE OFFERING (USD BILLION) 2020-2030
TABLE 40 ARGENTINA EPIGENETICS MARKET BY METHOD (USD BILLION) 2020-2030
TABLE 41 ARGENTINA EPIGENETICS MARKET BY TECHNIQUE (USD BILLION) 2020-2030
TABLE 42 ARGENTINA EPIGENETICS MARKET BY APPLICATION (USD BILLION) 2020-2030
TABLE 43 ARGENTINA EPIGENETICS MARKET BY END USER (USD BILLION) 2020-2030
TABLE 44 COLOMBIA EPIGENETICS MARKET BY PRODUCT & SERVICE OFFERING (USD BILLION) 2020-2030
TABLE 45 COLOMBIA EPIGENETICS MARKET BY METHOD (USD BILLION) 2020-2030
TABLE 46 COLOMBIA EPIGENETICS MARKET BY TECHNIQUE (USD BILLION) 2020-2030
TABLE 47 COLOMBIA EPIGENETICS MARKET BY APPLICATION (USD BILLION) 2020-2030
TABLE 48 COLOMBIA EPIGENETICS MARKET BY END USER (USD BILLION) 2020-2030
TABLE 49 REST OF SOUTH AMERICA EPIGENETICS MARKET BY PRODUCT & SERVICE OFFERING (USD BILLION) 2020-2030
TABLE 50 REST OF SOUTH AMERICA EPIGENETICS MARKET BY METHOD (USD BILLION) 2020-2030
TABLE 51 REST OF SOUTH AMERICA EPIGENETICS MARKET BY TECHNIQUE (USD BILLION) 2020-2030
TABLE 52 REST OF SOUTH AMERICA EPIGENETICS MARKET BY APPLICATION (USD BILLION) 2020-2030
TABLE 53 REST OF SOUTH AMERICA EPIGENETICS MARKET BY END USER (USD BILLION) 2020-2030
TABLE 54 ASIA-PACIFIC EPIGENETICS MARKET BY COUNTRY (USD BILLION) 2020-2030
TABLE 55 ASIA-PACIFIC EPIGENETICS MARKET BY PRODUCT & SERVICE OFFERING (USD BILLION) 2020-2030
TABLE 56 ASIA-PACIFIC EPIGENETICS MARKET BY METHOD (USD BILLION) 2020-2030
TABLE 57 ASIA-PACIFIC EPIGENETICS MARKET BY TECHNIQUE (USD BILLION) 2020-2030
TABLE 58 ASIA-PACIFIC EPIGENETICS MARKET BY APPLICATION (USD BILLION) 2020-2030
TABLE 59 ASIA-PACIFIC EPIGENETICS MARKET BY END USER (USD BILLION) 2020-2030
TABLE 60 INDIA EPIGENETICS MARKET BY PRODUCT & SERVICE OFFERING (USD BILLION) 2020-2030
TABLE 61 INDIA EPIGENETICS MARKET BY METHOD (USD BILLION) 2020-2030
TABLE 62 INDIA EPIGENETICS MARKET BY TECHNIQUE (USD BILLION) 2020-2030
TABLE 63 INDIA EPIGENETICS MARKET BY APPLICATION (USD BILLION) 2020-2030
TABLE 64 INDIA EPIGENETICS MARKET BY END USER (USD BILLION) 2020-2030
TABLE 65 CHINA EPIGENETICS MARKET BY PRODUCT & SERVICE OFFERING (USD BILLION) 2020-2030
TABLE 66 CHINA EPIGENETICS MARKET BY METHOD (USD BILLION) 2020-2030
TABLE 67 CHINA EPIGENETICS MARKET BY TECHNIQUE (USD BILLION) 2020-2030
TABLE 68 CHINA EPIGENETICS MARKET BY APPLICATION (USD BILLION) 2020-2030
TABLE 69 CHINA EPIGENETICS MARKET BY END USER (USD BILLION) 2020-2030
TABLE 70 JAPAN EPIGENETICS MARKET BY PRODUCT & SERVICE OFFERING (USD BILLION) 2020-2030
TABLE 71 JAPAN EPIGENETICS MARKET BY METHOD (USD BILLION) 2020-2030
TABLE 72 JAPAN EPIGENETICS MARKET BY TECHNIQUE (USD BILLION) 2020-2030
TABLE 73 JAPAN EPIGENETICS MARKET BY APPLICATION (USD BILLION) 2020-2030
TABLE 74 JAPAN EPIGENETICS MARKET BY END USER (USD BILLION) 2020-2030
TABLE 75 SOUTH KOREA EPIGENETICS MARKET BY PRODUCT & SERVICE OFFERING (USD BILLION) 2020-2030
TABLE 76 SOUTH KOREA EPIGENETICS MARKET BY METHOD (USD BILLION) 2020-2030
TABLE 77 SOUTH KOREA EPIGENETICS MARKET BY TECHNIQUE (USD BILLION) 2020-2030
TABLE 78 SOUTH KOREA EPIGENETICS MARKET BY APPLICATION (USD BILLION) 2020-2030
TABLE 79 SOUTH KOREA EPIGENETICS MARKET BY END USER (USD BILLION) 2020-2030
TABLE 80 AUSTRALIA EPIGENETICS MARKET BY PRODUCT & SERVICE OFFERING (USD BILLION) 2020-2030
TABLE 81 AUSTRALIA EPIGENETICS MARKET BY METHOD (USD BILLION) 2020-2030
TABLE 82 AUSTRALIA EPIGENETICS MARKET BY TECHNIQUE (USD BILLION) 2020-2030
TABLE 83 AUSTRALIA EPIGENETICS MARKET BY APPLICATION (USD BILLION) 2020-2030
TABLE 84 AUSTRALIA EPIGENETICS MARKET BY END USER (USD BILLION) 2020-2030
TABLE 85 SOUTH-EAST ASIA EPIGENETICS MARKET BY PRODUCT & SERVICE OFFERING (USD BILLION) 2020-2030
TABLE 86 SOUTH-EAST ASIA EPIGENETICS MARKET BY METHOD (USD BILLION) 2020-2030
TABLE 87 SOUTH-EAST ASIA EPIGENETICS MARKET BY TECHNIQUE (USD BILLION) 2020-2030
TABLE 88 SOUTH-EAST ASIA EPIGENETICS MARKET BY APPLICATION (USD BILLION) 2020-2030
TABLE 89 SOUTH-EAST ASIA EPIGENETICS MARKET BY END USER (USD BILLION) 2020-2030
TABLE 90 REST OF ASIA PACIFIC EPIGENETICS MARKET BY PRODUCT & SERVICE OFFERING (USD BILLION) 2020-2030
TABLE 91 REST OF ASIA PACIFIC EPIGENETICS MARKET BY METHOD (USD BILLION) 2020-2030
TABLE 92 REST OF ASIA PACIFIC EPIGENETICS MARKET BY TECHNIQUE (USD BILLION) 2020-2030
TABLE 93 REST OF ASIA PACIFIC EPIGENETICS MARKET BY APPLICATION (USD BILLION) 2020-2030
TABLE 94 REST OF ASIA PACIFIC EPIGENETICS MARKET BY END USER (USD BILLION) 2020-2030
TABLE 95 EUROPE EPIGENETICS MARKET BY COUNTRY (USD BILLION) 2020-2030
TABLE 96 EUROPE EPIGENETICS MARKET BY PRODUCT & SERVICE OFFERING (USD BILLION) 2020-2030
TABLE 97 EUROPE EPIGENETICS MARKET BY METHOD (USD BILLION) 2020-2030
TABLE 98 EUROPE EPIGENETICS MARKET BY TECHNIQUE (USD BILLION) 2020-2030
TABLE 99 EUROPE EPIGENETICS MARKET BY APPLICATION (USD BILLION) 2020-2030
TABLE 100 EUROPE EPIGENETICS MARKET BY END USER (USD BILLION) 2020-2030
TABLE 101 GERMANY EPIGENETICS MARKET BY PRODUCT & SERVICE OFFERING (USD BILLION) 2020-2030
TABLE 102 GERMANY EPIGENETICS MARKET BY METHOD (USD BILLION) 2020-2030
TABLE 103 GERMANY EPIGENETICS MARKET BY TECHNIQUE (USD BILLION) 2020-2030
TABLE 104 GERMANY EPIGENETICS MARKET BY APPLICATION (USD BILLION) 2020-2030
TABLE 105 GERMANY EPIGENETICS MARKET BY END USER (USD BILLION) 2020-2030
TABLE 106 UK EPIGENETICS MARKET BY PRODUCT & SERVICE OFFERING (USD BILLION) 2020-2030
TABLE 107 UK EPIGENETICS MARKET BY METHOD (USD BILLION) 2020-2030
TABLE 108 UK EPIGENETICS MARKET BY TECHNIQUE (USD BILLION) 2020-2030
TABLE 109 UK EPIGENETICS MARKET BY APPLICATION (USD BILLION) 2020-2030
TABLE 110 UK EPIGENETICS MARKET BY END USER (USD BILLION) 2020-2030
TABLE 111 FRANCE EPIGENETICS MARKET BY PRODUCT & SERVICE OFFERING (USD BILLION) 2020-2030
TABLE 112 FRANCE EPIGENETICS MARKET BY METHOD (USD BILLION) 2020-2030
TABLE 113 FRANCE EPIGENETICS MARKET BY TECHNIQUE (USD BILLION) 2020-2030
TABLE 114 FRANCE EPIGENETICS MARKET BY APPLICATION (USD BILLION) 2020-2030
TABLE 115 FRANCE EPIGENETICS MARKET BY END USER (USD BILLION) 2020-2030
TABLE 116 ITALY EPIGENETICS MARKET BY PRODUCT & SERVICE OFFERING (USD BILLION) 2020-2030
TABLE 117 ITALY EPIGENETICS MARKET BY METHOD (USD BILLION) 2020-2030
TABLE 118 ITALY EPIGENETICS MARKET BY TECHNIQUE (USD BILLION) 2020-2030
TABLE 119 ITALY EPIGENETICS MARKET BY APPLICATION (USD BILLION) 2020-2030
TABLE 120 ITALY EPIGENETICS MARKET BY END USER (USD BILLION) 2020-2030
TABLE 121 SPAIN EPIGENETICS MARKET BY PRODUCT & SERVICE OFFERING (USD BILLION) 2020-2030
TABLE 122 SPAIN EPIGENETICS MARKET BY METHOD (USD BILLION) 2020-2030
TABLE 123 SPAIN EPIGENETICS MARKET BY TECHNIQUE (USD BILLION) 2020-2030
TABLE 124 SPAIN EPIGENETICS MARKET BY APPLICATION (USD BILLION) 2020-2030
TABLE 125 SPAIN EPIGENETICS MARKET BY END USER (USD BILLION) 2020-2030
TABLE 126 RUSSIA EPIGENETICS MARKET BY PRODUCT & SERVICE OFFERING (USD BILLION) 2020-2030
TABLE 127 RUSSIA EPIGENETICS MARKET BY METHOD (USD BILLION) 2020-2030
TABLE 128 RUSSIA EPIGENETICS MARKET BY TECHNIQUE (USD BILLION) 2020-2030
TABLE 129 RUSSIA EPIGENETICS MARKET BY APPLICATION (USD BILLION) 2020-2030
TABLE 130 RUSSIA EPIGENETICS MARKET BY END USER (USD BILLION) 2020-2030
TABLE 131 REST OF EUROPE EPIGENETICS MARKET BY PRODUCT & SERVICE OFFERING (USD BILLION) 2020-2030
TABLE 132 REST OF EUROPE EPIGENETICS MARKET BY METHOD (USD BILLION) 2020-2030
TABLE 133 REST OF EUROPE EPIGENETICS MARKET BY TECHNIQUE (USD BILLION) 2020-2030
TABLE 134 REST OF EUROPE EPIGENETICS MARKET BY APPLICATION (USD BILLION) 2020-2030
TABLE 135 REST OF EUROPE EPIGENETICS MARKET BY END USER (USD BILLION) 2020-2030
TABLE 136 MIDDLE EAST AND AFRICA EPIGENETICS MARKET BY COUNTRY (USD BILLION) 2020-2030
TABLE 137 MIDDLE EAST AND AFRICA EPIGENETICS MARKET BY PRODUCT & SERVICE OFFERING (USD BILLION) 2020-2030
TABLE 138 MIDDLE EAST AND AFRICA EPIGENETICS MARKET BY METHOD (USD BILLION) 2020-2030
TABLE 139 MIDDLE EAST AND AFRICA EPIGENETICS MARKET BY TECHNIQUE (USD BILLION) 2020-2030
TABLE 140 MIDDLE EAST AND AFRICA EPIGENETICS MARKET BY APPLICATION (USD BILLION) 2020-2030
TABLE 141 MIDDLE EAST AND AFRICA EPIGENETICS MARKET BY END USER (USD BILLION) 2020-2030
TABLE 142 UAE EPIGENETICS MARKET BY PRODUCT & SERVICE OFFERING (USD BILLION) 2020-2030
TABLE 143 UAE EPIGENETICS MARKET BY METHOD (USD BILLION) 2020-2030
TABLE 144 UAE EPIGENETICS MARKET BY TECHNIQUE (USD BILLION) 2020-2030
TABLE 145 UAE EPIGENETICS MARKET BY APPLICATION (USD BILLION) 2020-2030
TABLE 146 UAE EPIGENETICS MARKET BY END USER (USD BILLION) 2020-2030
TABLE 147 SAUDI ARABIA EPIGENETICS MARKET BY PRODUCT & SERVICE OFFERING (USD BILLION) 2020-2030
TABLE 148 SAUDI ARABIA EPIGENETICS MARKET BY METHOD (USD BILLION) 2020-2030
TABLE 149 SAUDI ARABIA EPIGENETICS MARKET BY TECHNIQUE (USD BILLION) 2020-2030
TABLE 150 SAUDI ARABIA EPIGENETICS MARKET BY APPLICATION (USD BILLION) 2020-2030
TABLE 151 SAUDI ARABIA EPIGENETICS MARKET BY END USER (USD BILLION) 2020-2030
TABLE 152 SOUTH AFRICA EPIGENETICS MARKET BY PRODUCT & SERVICE OFFERING (USD BILLION) 2020-2030
TABLE 153 SOUTH AFRICA EPIGENETICS MARKET BY METHOD (USD BILLION) 2020-2030
TABLE 154 SOUTH AFRICA EPIGENETICS MARKET BY TECHNIQUE (USD BILLION) 2020-2030
TABLE 155 SOUTH AFRICA EPIGENETICS MARKET BY APPLICATION (USD BILLION) 2020-2030
TABLE 156 SOUTH AFRICA EPIGENETICS MARKET BY END USER (USD BILLION) 2020-2030
TABLE 157 REST OF MIDDLE EAST AND AFRICA EPIGENETICS MARKET BY PRODUCT & SERVICE OFFERING (USD BILLION) 2020-2030
TABLE 158 REST OF MIDDLE EAST AND AFRICA EPIGENETICS MARKET BY METHOD (USD BILLION) 2020-2030
TABLE 159 REST OF MIDDLE EAST AND AFRICA EPIGENETICS MARKET BY TECHNIQUE (USD BILLION) 2020-2030
TABLE 160 REST OF MIDDLE EAST AND AFRICA EPIGENETICS MARKET BY APPLICATION (USD BILLION) 2020-2030
TABLE 161 REST OF MIDDLE EAST AND AFRICA EPIGENETICS MARKET BY END USER (USD BILLION) 2020-2030
LIST OF FIGURES
FIGURE 1 MARKET DYNAMICS
FIGURE 2 REPORT TIMELINES: YEARS CONSIDERED
FIGURE 3 BOTTOM-UP APPROACH
FIGURE 4 RESEARCH FLOW
FIGURE 5 GLOBAL EPIGENETICS MARKET BY PRODUCT & SERVICE OFFERING, USD BILLION, 2020-2030
FIGURE 6 GLOBAL EPIGENETICS MARKET BY METHOD, USD BILLION, 2020-2030
FIGURE 7 GLOBAL EPIGENETICS MARKET BY TECHNIQUE, USD BILLION, 2020-2030
FIGURE 8 GLOBAL EPIGENETICS MARKET BY APPLICATION, USD BILLION, 2020-2030
FIGURE 9 GLOBAL EPIGENETICS MARKET BY END USER, USD BILLION, 2020-2030
FIGURE 19 GLOBAL EPIGENETICS MARKET BY REGION, USD BILLION, 2020-2030
FIGURE 11 PORTER’S FIVE FORCES MODEL
FIGURE 12 GLOBAL EPIGENETICS MARKET BY PRODUCT & SERVICE OFFERING, USD BILLION, 2022
FIGURE 13 GLOBAL EPIGENETICS MARKET BY METHOD, USD BILLION, 2022
FIGURE 14 GLOBAL EPIGENETICS MARKET BY TECHNIQUE, USD BILLION, 2022
FIGURE 15 GLOBAL EPIGENETICS MARKET BY APPLICATION, USD BILLION, 2022
FIGURE 16 GLOBAL EPIGENETICS MARKET BY END USER, USD BILLION, 2022
FIGURE 17 GLOBAL EPIGENETICS MARKET BY REGION, USD BILLION, 2022
FIGURE 18 MARKET SHARE ANALYSIS
FIGURE 19 ABCAM PLC.: COMPANY SNAPSHOT
FIGURE 20 ACTIVE MOTIF, INC.: COMPANY SNAPSHOT
FIGURE 21 AGILENT TECHNOLOGIES, INC.: COMPANY SNAPSHOT
FIGURE 22 HOLOGIC INC.: COMPANY SNAPSHOT
FIGURE 23 ILLUMINA INC.: COMPANY SNAPSHOT
FIGURE 24 MERCK MILLIPORE: COMPANY SNAPSHOT
FIGURE 25 PERKINELMER, INC.: COMPANY SNAPSHOT
FIGURE 26 QIAGEN N.V.: COMPANY SNAPSHOT
FIGURE 27 THERMO FISHER SCIENTIFIC INC.: COMPANY SNAPSHOT
FIGURE 28 ZYMO RESEARCH: COMPANY SNAPSHOT
FIGURE 29 PACBIO: COMPANY SNAPSHOT
FIGURE 30 BIO-RAD LABORATORIES: COMPANY SNAPSHOT
FIGURE 31 PROMEGA CORPORATION: COMPANY SNAPSHOT
FIGURE 32 DIAGENODE: COMPANY SNAPSHOT
FIGURE 33 ENGLAND BIOLABS: COMPANY SNAPSHOT
FAQ
The epigenetics market size had crossed USD 5.64 billion in 2023 and will observe a CAGR of more than 16.7% up to 2030.
The driving factors of the epigenetics market are the rising prevalence of cancer, rise in the aging population is expected to boost the market growth.
The region’s largest share is in North America. Products manufactured in nations like US and Canada that perform similarly and are inexpensively accessible to the general public have led to the increasing appeal.
In-Depth Database
Our Report’s database covers almost all topics of all regions over the Globe.
Recognised Publishing Sources
Tie ups with top publishers around the globe.
Customer Support
Complete pre and post sales
support.
Safe & Secure
Complete secure payment
process.
