REPORT OUTLOOK
| Market Size | CAGR | Dominating Region |
|---|---|---|
| USD 13.2 billion by 2030 | 20.02 % | North America |
| by Product | by Technique | by Design |
|---|---|---|
|
|
|
SCOPE OF THE REPORT
Gene Panel Market Overview
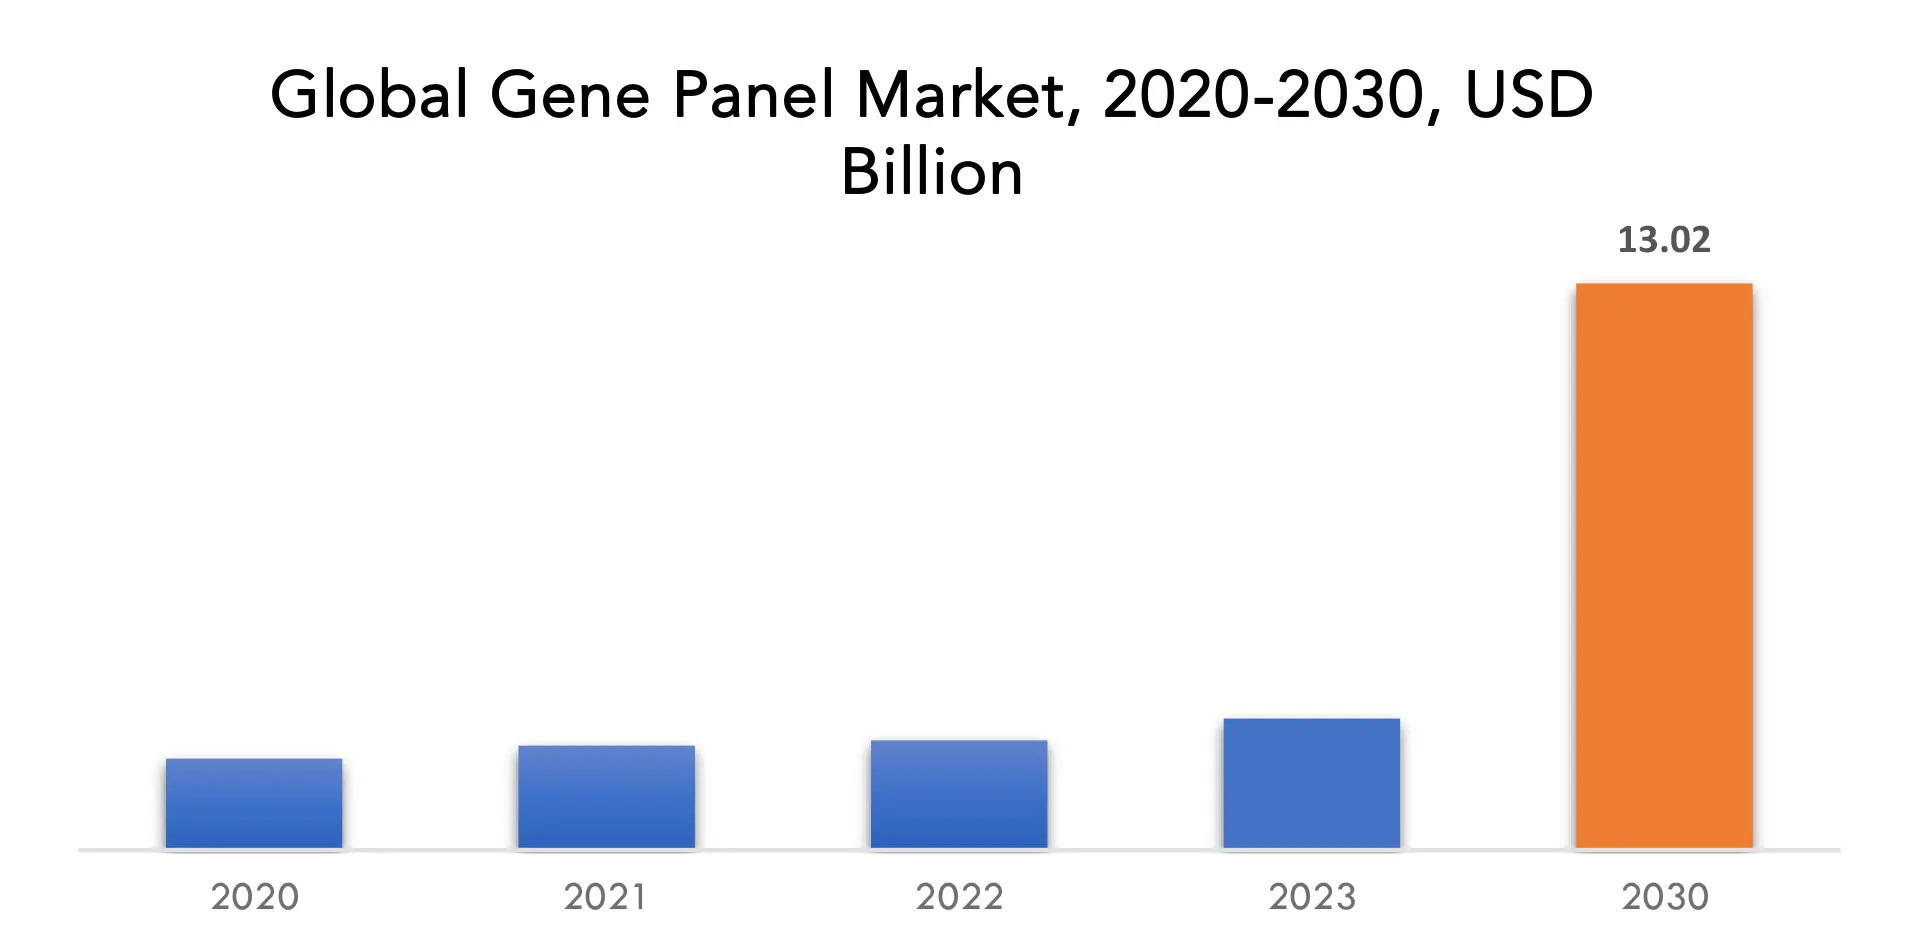
The gene panel market is expected to grow at 20.02 % CAGR from 2023 to 2030. It is expected to reach above USD 13.2 billion by 2030 from USD 3.02 billion in 2023.
A test called a gene panel looks for mutations linked to cancer by simultaneously testing several genes. A gene panel offers a compromise between sequencing every gene in the genome and just one specific gene, such as the BRCA1 gene, which we are positive is linked in illness risk. We should be able to gather the most pertinent data thanks to this method’s emphasis. In addition to increasing the risk of developing colon, endometrial, stomach, ovarian, and various other cancers, Lynch Syndrome is caused by a similar substantial but less well-known group of gene abnormalities. These and other, less prevalent syndromes can be decided upon simultaneously by preeminent panel testing.
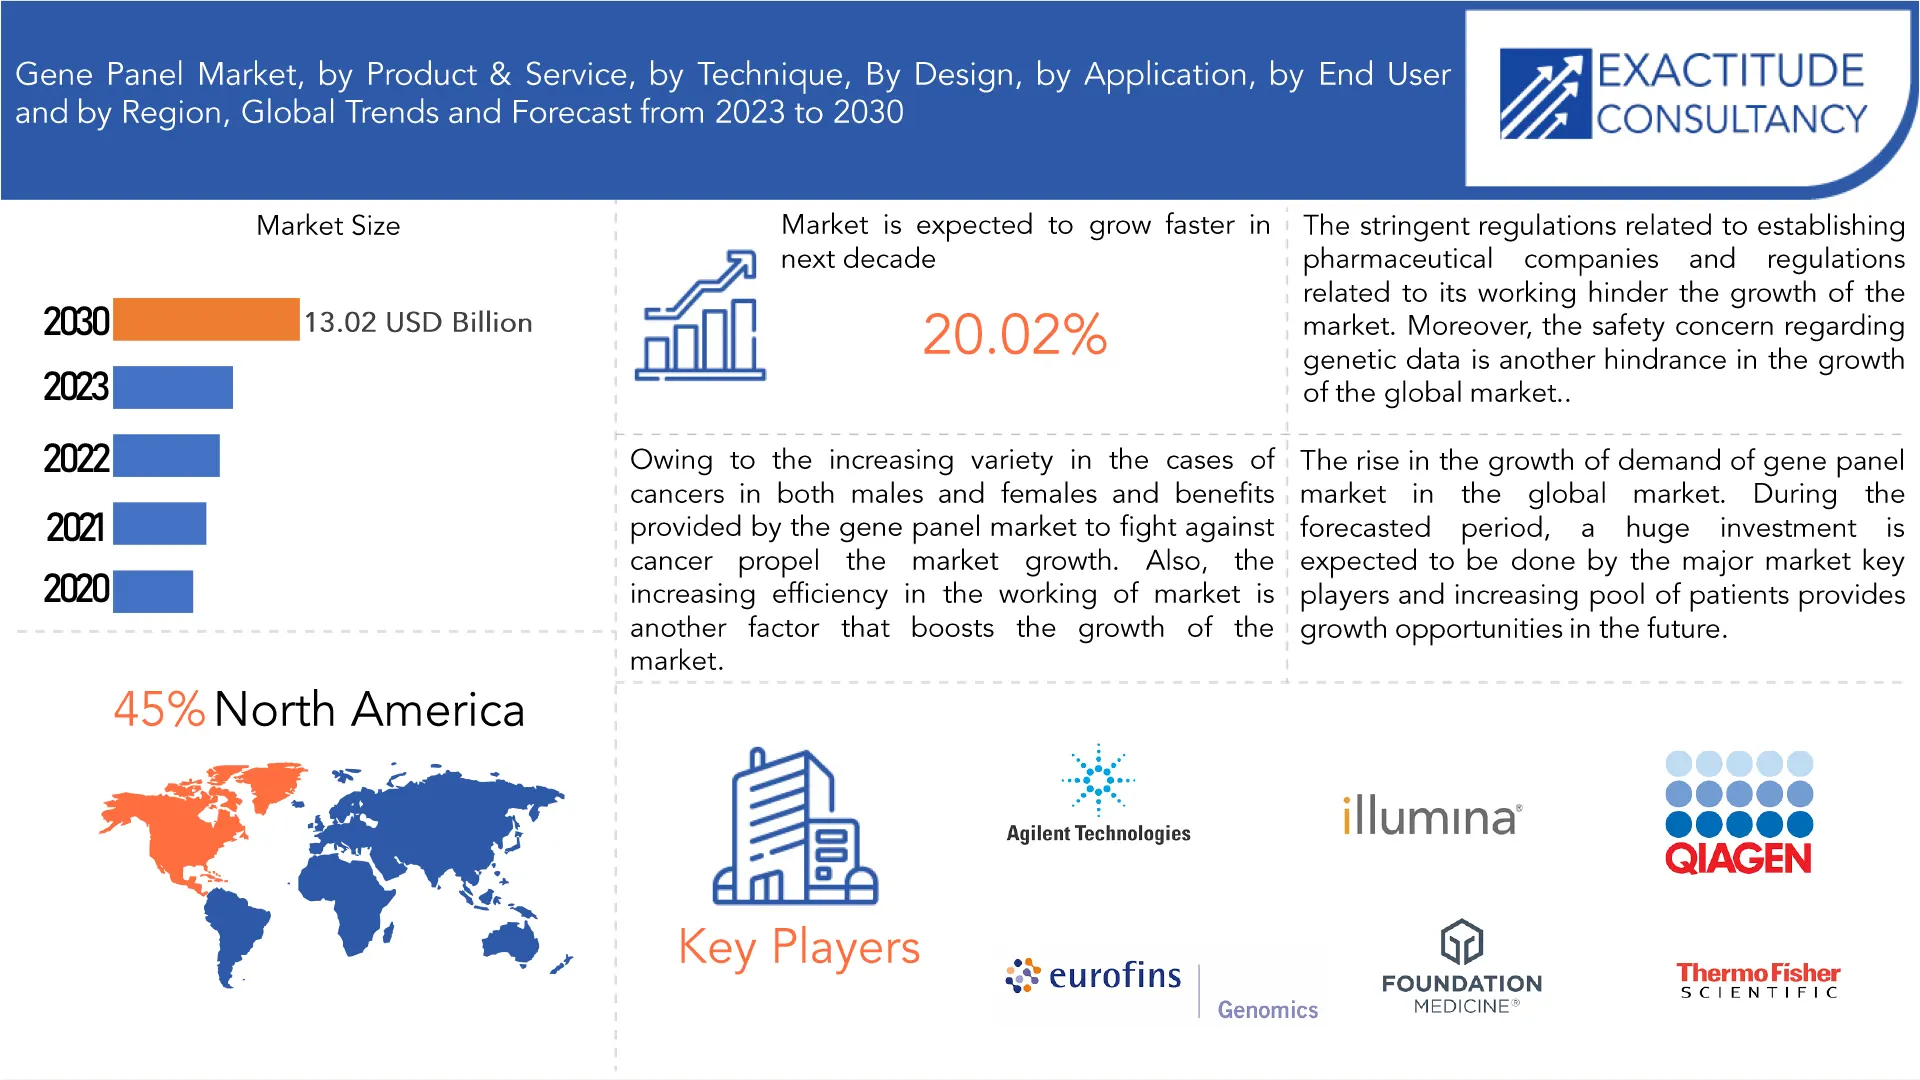
The benefits of gene panels in addition to an increase in corporate initiatives around the world are the main drivers of the gene panel industry. The market is also being driven by factors like rising genetic testing adoption, technology developments like the Next Generation Sequencing System, and the demand for effective prenatal diagnosis.
The market is expected to expand due to the rising range of malignancies that affect both men and women as well as the advantages offered by the market for gene panels to treat cancer. Another factor that fosters the market’s expansion is the growing efficiency with which it operates. Another factor speeding up the market’s expansion is the development of technology and the growing demand for prenatal diagnosis.
The global gene panel market is expanding steadily, but certain limitations will likely limit its expansion throughout the anticipated time. The strict restrictions governing the establishment of pharmaceutical enterprises and those governing their operations limit the market’s expansion. Another barrier to the expansion of the worldwide business is the safety concern surrounding genetic data.
The expansion of the gene panel market’s demand on the world market. The top market players are anticipated to make significant investments during the anticipated time period, and an expanding patient base will present growth prospects going forward. The government’s market investments provide a growth opportunity for the global market.
Owing of the ongoing COVID 19 global pandemic emergency, people’s regular working life have been negatively impacted. The economy has been plunged into a recession by this circumstance. Financial troubles and health issues were brought on by the global COVID 19 pandemic outbreak. The supply chain activities of the gene panel market were abruptly impacted by the lockdown situation during the peak COVID 19 event, which caused a sharp decline in market sales revenue.
| ATTRIBUTE | DETAILS |
| Study period | 2020-2030 |
| Base year | 2022 |
| Estimated year | 2023 |
| Forecasted year | 2023-2030 |
| Historical period | 2019-2021 |
| Unit | Value (USD Billion). |
| Segmentation | By Product & service, By Technique, By Design, By Application, By End User, By Region. |
| By Product & service |
|
| By Technique |
|
| By Design |
|
| By Application
|
|
| By End User
|
|
| By Region
|
|
Gene Panel Market Segment Analysis
The gene panel market is segmented based on product & service, technique, design, application and end user.
Over 85% of the total revenue in 2021 came from the test kits market, and it is anticipated that this market would continue to lead during the projected period. Self-utilitarianism is becoming more and more prevalent among people worldwide. For any laboratory personnel or laboratory setting using direct-to-consumer testing kits, there is a basic minimum requirement. Customers can purchase a kit online, send samples, and ship the results back to the service provider.
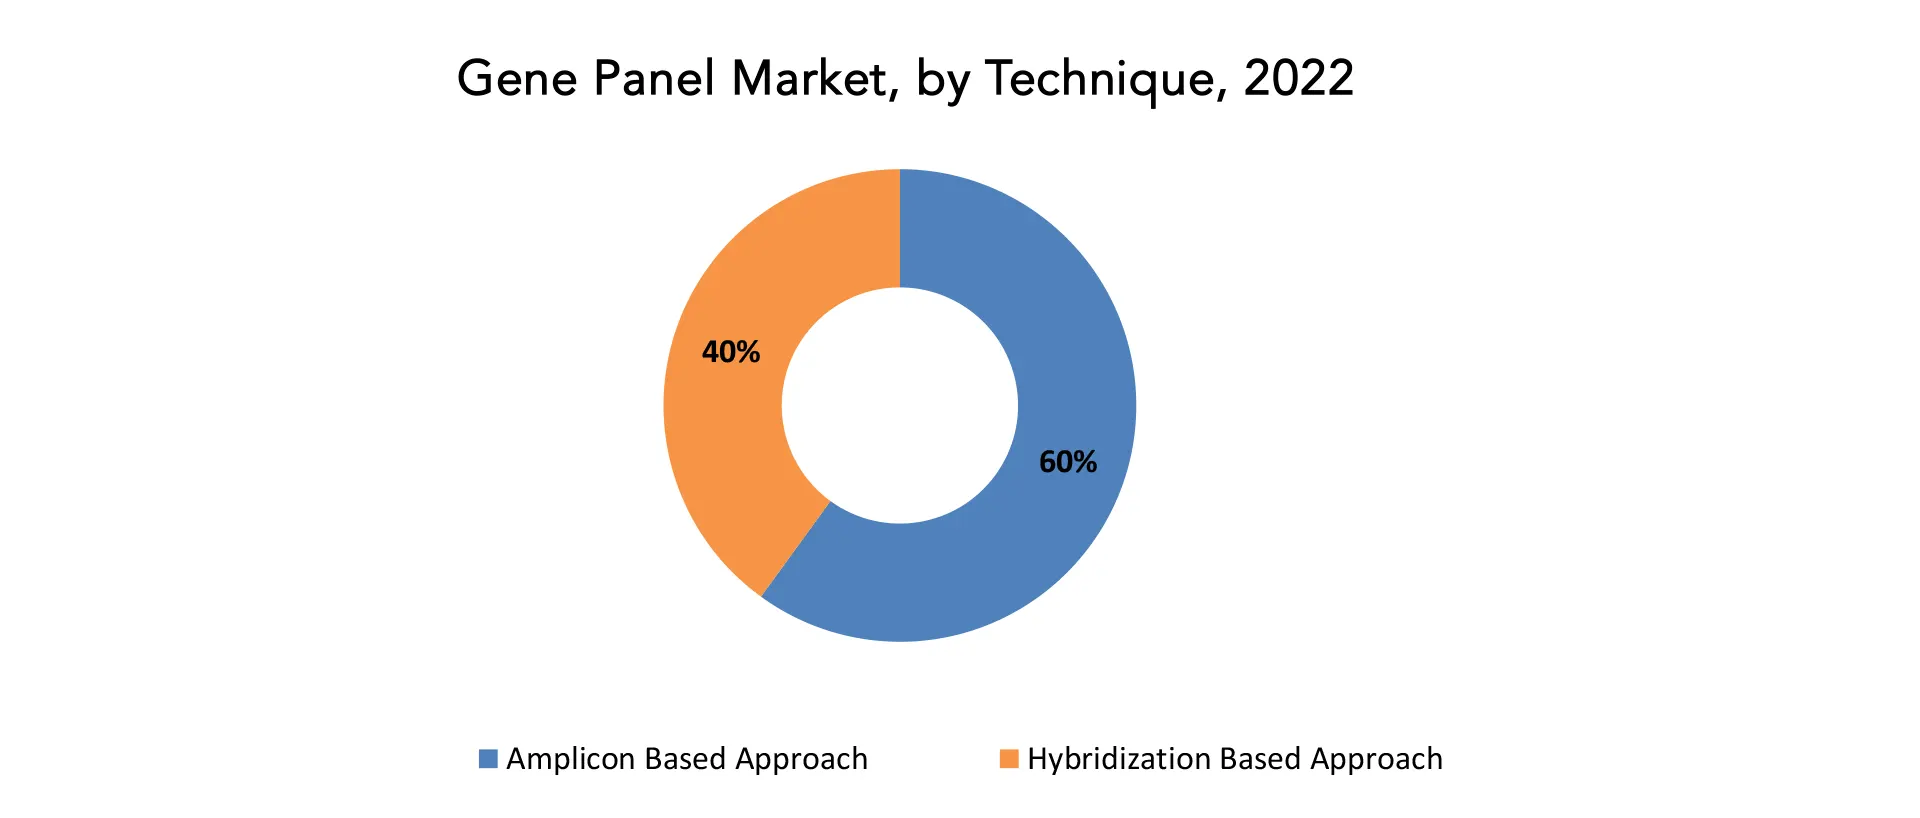
Amplicon-based strategy dominated the market in 2021 with a share of more than 65.0%. The common target-based next-generation sequencing method known as the amplicon-based approach examines genetic difference in a particular genomic area. The genotyping by sequencing, CRISP validation, finding an inherited SNP, and indels identification are specific applications of the amplicon-based technique.
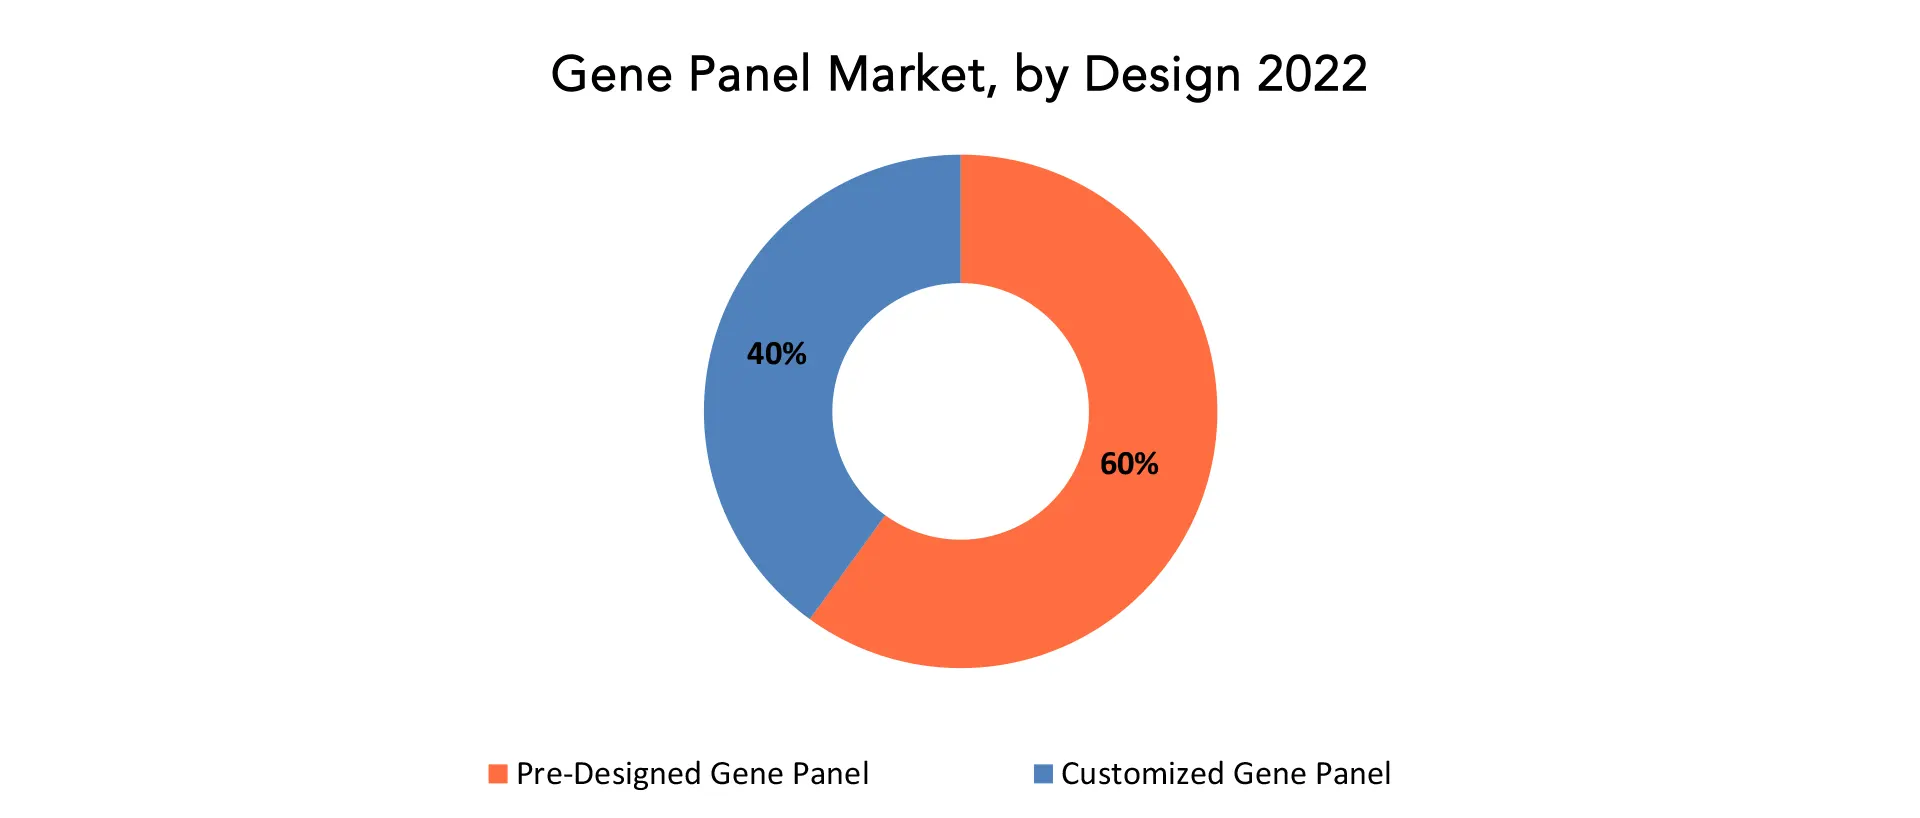
With a market share of over 60.0% in 2021, the pre-designed gene panel segment was the market leader. During the forecast period, it is anticipated to have significant growth. Due to genetic susceptibility to any condition is still poorly understood in humans, it is usually advisable to use predesigned gene panels for consumer genetic testing in order to get a thorough examination.
Due to the minimally invasive nature of gene panels and the extraordinary increase in the rate of cancer occurrence worldwide, the cancer risk assessment segment held the greatest share of the market in 2021, accounting for approximately 45.0%. In populations with hereditary risk factors, cancer screening is strongly advised, therefore gene panels can effectively replace several screening procedures to identify genetic risk factors for many types of malignancies.
In 2021, the research and academic institutions market segment held the highest share with over 45.0%. Research and development efforts are projected to increase as a result of factors like the increased frequency of genetic disorders and cancer around the world, which will present the industry with favorable growth prospects.
Gene Panel Market Player
The gene panel market key players includes Agilent Technologies, Illumina Inc., Qiagen Inc., Eurofins Genomics, Thermo Fisher Scientific, Foundation Medicine Inc., Guardant Health Inc., Myriad Genetic Laboratories Inc., Cepheid, Bio-Rad Laboratories Inc.
26 April 2023: Agilent Technologies Inc. (NYSE: A) announced the recent signing of a Memorandum of Understanding (MOU) with Theragen Bio in South Korea to boost precision oncology through advancing bioinformatic (BI) solutions.
14 December 2022: Fluid Management Systems (FMS), a leader in automated sample preparation systems, announced a co-marketing agreement with Agilent Technologies to create and market workflows for the testing and analysis of persistent organic pollutants (POPs).
Who Should Buy? Or Key Stakeholders
- NGS equipment manufacturers, vendors, and distributors
- NGS sequencing services companies
- NGS bioinformatics/data analysis companies
- Research institutes and government organizations
- Venture capitalists and government funding organizations
- Research and consulting firms
- Healthcare institutions
- Pharmaceutical and biotechnology companies
- Others
Gene Panel Market Regional Analysis
The gene panel market by region includes North America, Asia-Pacific (APAC), Europe, South America, and Middle East & Africa (MEA).
- North America: includes the US, Canada, Mexico
- Asia Pacific: includes China, Japan, South Korea, India, Australia, ASEAN and Rest of APAC
- Europe: includes UK, Germany, France, Italy, Spain, Russia, and Rest of Europe
- South America: includes Brazil, Argentina and Rest of South America
- Middle East & Africa: includes Turkey, UAE, Saudi Arabia, South Africa, and Rest of MEA
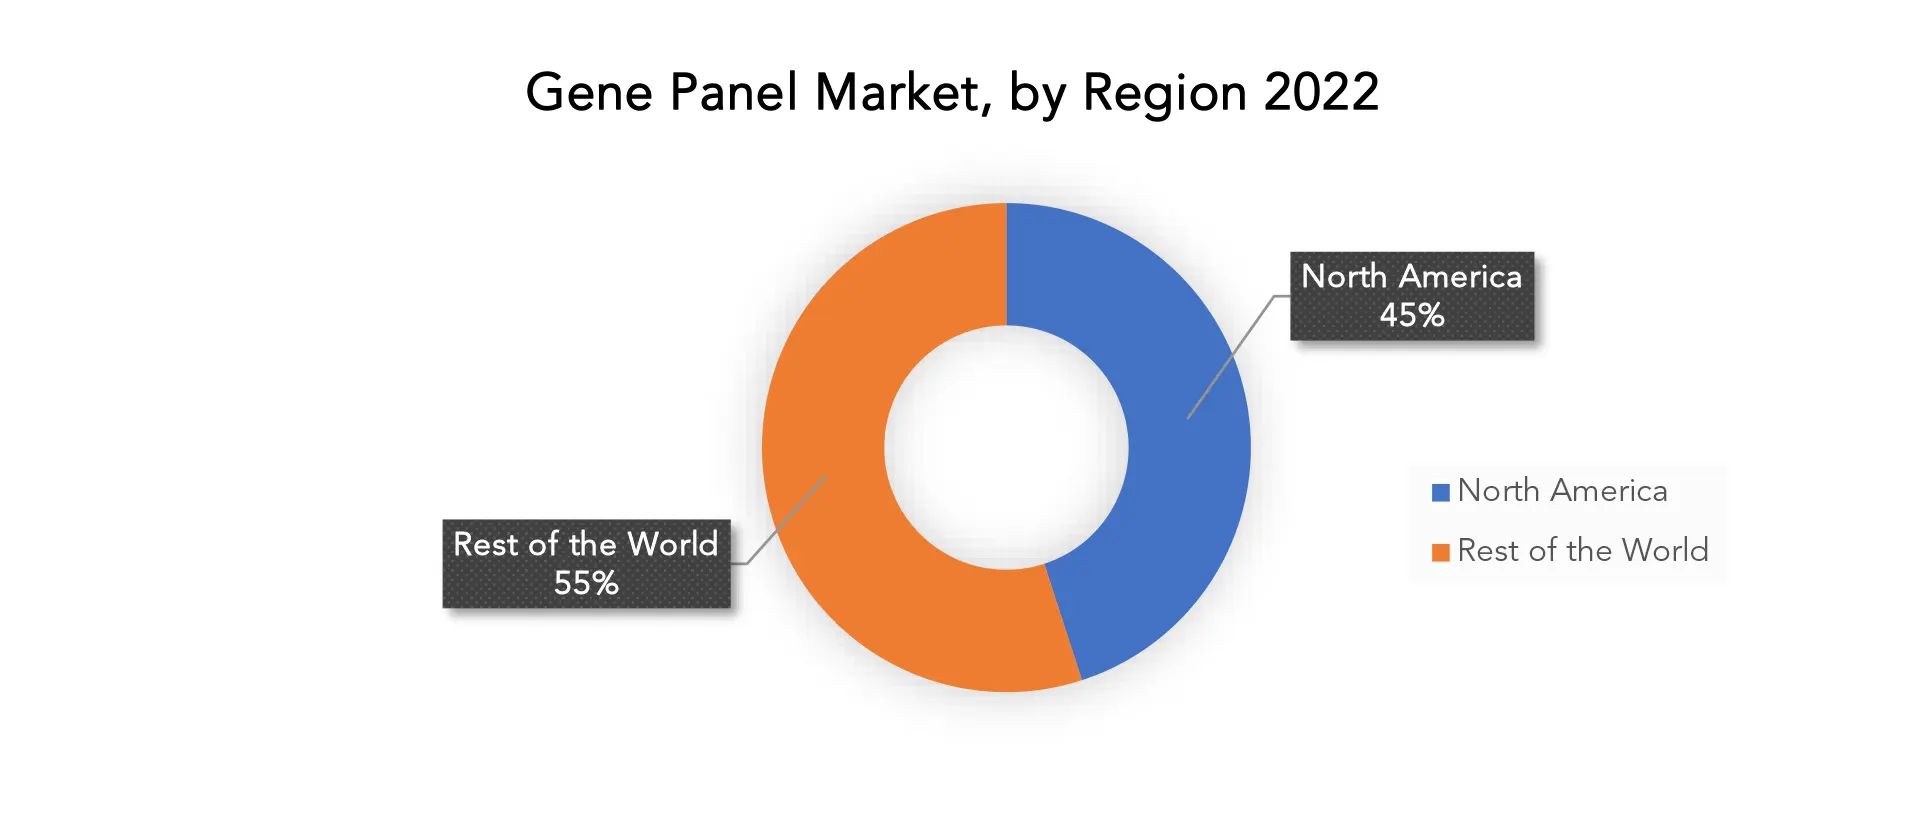
With a market share of over 45.0% in 2021, North America was in the lead and is expected to continue to experience profitable growth during the projected period. In the United States, gene panels are intended to enhance recommended genetic screening with the help of machine learning by detecting various genetic abnormalities, preferably utilising liquid biopsy or blood samples. The National Cancer Institute (NCI), pharmaceutical tycoons, and academic research institutions around the country have all worked together to support substantial research in a number of research institutes, which has contributed to the market expansion.
The European market is being driven by an improvement in genetic level understanding of a disease and an increasing demand for presumptive screening. The increased demand for gene panels for numerous applications has sparked industrial growth.
Key Market Segments: Gene Panel Market
Gene Panel Market by Product & service, 2020-2030, (USD Billion).
- Test Kits
- Testing Services
Gene Panel Market by Technique, 2020-2030, (USD Billion).
- Amplicon Based Approach
- Hybridization Based Approach
Gene Panel Market by Design, 2020-2030, (USD Billion).
- Pre-Designed Gene Panel
- Customized Gene Panel
Gene Panel Market by Application, 2020-2030, (USD Billion).
- Cancer Risk Assessment
- Diagnosis Of Congenital Diseases
- Pharmacogenetics
- Others
Gene Panel Market by End User, 2020-2030, (USD Billion).
- Academic & Research Institutes
- Hospital & Diagnostic Laboratories
- Pharmaceutical & Biotechnology Companies
Gene Panel Market by Region, 2020-2030, (USD Billion).
- North America
- Asia Pacific
- Europe
- South America
- Middle East and Africa
Important Countries in All Regions Are Covered.
Exactitude Consultancy Services Key Objectives:
- Increasing sales and market share
- Developing new technology
- Improving profitability
- Entering new markets
- Enhancing brand reputation
Key Question Answered
- What is the expected growth rate of the gene panel market over the next 7 years?
- Who are the major players in the gene panel market and what is their market share?
- What are the end-user industries driving demand for market and what is their outlook?
- What are the opportunities for growth in emerging markets such As Asia-Pacific, Middle East, and Africa?
- How is the economic environment affecting the gene panel market, including factors such as interest rates, inflation, and exchange rates?
- What is the expected impact of government policies and regulations on the gene panel market?
- What is the current and forecasted size and growth rate of the global gene panel market?
- What are the key drivers of growth in the gene panel market?
- What are the distribution channels and supply chain dynamics in the gene panel market?
- What are the technological advancements and innovations in the gene panel market and their impact on material development and growth?
- What are the regulatory considerations and their impact on the market?
- What are the challenges faced by players in the gene panel market and how are they addressing these challenges?
- What are the opportunities for growth and expansion in the gene panel market?
- What are the services offerings and specifications of leading players in the market?
Table of Content
- INTRODUCTION
- MARKET DEFINITION
- MARKET SEGMENTATION
- RESEARCH TIMELINES
- ASSUMPTIONS AND LIMITATIONS
- RESEARCH METHODOLOGY
- DATA MINING
- SECONDARY RESEARCH
- PRIMARY RESEARCH
- SUBJECT-MATTER EXPERTS’ ADVICE
- QUALITY CHECKS
- FINAL REVIEW
- DATA TRIANGULATION
- BOTTOM-UP APPROACH
- TOP-DOWN APPROACH
- RESEARCH FLOW
- DATA SOURCES
- EXECUTIVE SUMMARY
- MARKET OVERVIEW
- GLOBAL GENE PANEL MARKET OUTLOOK
- MARKET DRIVERS
- MARKET RESTRAINTS
- MARKET OPPORTUNITIES
- IMPACT OF COVID-19 ON GENE PANEL MARKET
- PORTER’S FIVE FORCES MODEL
- THREAT FROM NEW ENTRANTS
- THREAT FROM SUBSTITUTES
- BARGAINING POWER OF SUPPLIERS
- BARGAINING POWER OF CUSTOMERS
- DEGREE OF COMPETITION
- INDUSTRY VALUE CHAIN ANALYSIS
- GLOBAL GENE PANEL MARKET OUTLOOK
- GLOBAL GENE PANEL MARKET BY PRODUCT AND SERVICE (USD BILLION), 2020-2030
- TEST KITS
- TESTING SERVICES
- GLOBAL GENE PANEL MARKET BY TECHNIQUE (USD BILLION), 2020-2030
- AMPLICON BASED APPROACH
- HYBRIDIZATION BASED APPROACH
- GLOBAL GENE PANEL MARKET BY DESIGN (USD BILLION), 2020-2030
- PRE DESIGNED GENE PANEL
- CUSTOMIZED GENE PANEL
- GLOBAL GENE PANEL MARKET BY APPLICATION (USD BILLION), 2020-2030
- CANCER RISK ASSESSMENT
- DIAGNOSIS OF CONGENITAL DISEASES
- PHARMACOGENETICS
- OTHERS
- GLOBAL GENE PANEL MARKET BY END USER (USD BILLION), 2020-2030
- ACADEMIC & RESEARCH INSTITUTES
- HOSPITAL & DIAGNOSTIC LABORATORIES
- PHARMACEUTICAL & BIOTECHNOLOGY COMPANIES
- GLOBAL GENE PANEL MARKET BY REGION (USD BILLION), 2020-2030
- NORTH AMERICA
- US
- CANADA
- MEXICO
- SOUTH AMERICA
- BRAZIL
- ARGENTINA
- COLOMBIA
- REST OF SOUTH AMERICA
- EUROPE
- GERMANY
- UK
- FRANCE
- ITALY
- SPAIN
- RUSSIA
- REST OF EUROPE
- ASIA PACIFIC
- INDIA
- CHINA
- JAPAN
- SOUTH KOREA
- AUSTRALIA
- SOUTH-EAST ASIA
- REST OF ASIA PACIFIC
- MIDDLE EAST AND AFRICA
- UAE
- SAUDI ARABIA
- SOUTH AFRICA
- REST OF MIDDLE EAST AND AFRICA
- NORTH AMERICA
- COMPANY PROFILES*
(BUSINESS OVERVIEW, COMPANY SNAPSHOT, PRODUCTS OFFERED, RECENT DEVELOPMENTS)
- AGILENT TECHNOLOGIES
- ILLUMINA INC.
- QIAGEN INC.
- EUROFINS GENOMICS
- THERMO FISHER SCIENTIFIC
- FOUNDATION MEDICINE INC.
- GUARDANT HEALTH, INC.
- MYRIAD GENETIC LABORATORIES INC.
- CEPHEID
- BIO-RAD LABORATORIES, INC.
*THE COMPANY LIST IS INDICATIVE
LIST OF TABLES
TABLE 1 GLOBAL GENE PANEL MARKET BY PRODUCT AND SERVICE (USD BILLION) 2020-2030
TABLE 2 GLOBAL GENE PANEL MARKET BY TECHNIQUE (USD BILLION) 2020-2030
TABLE 3 GLOBAL GENE PANEL MARKET BY DESIGN (USD BILLION) 2020-2030
TABLE 4 GLOBAL GENE PANEL MARKET BY APPLICATION (USD BILLION) 2020-2030
TABLE 5 GLOBAL GENE PANEL MARKET BY END USER (USD BILLION) 2020-2030
TABLE 6 GLOBAL GENE PANEL MARKET BY REGION (USD BILLION) 2020-2030
TABLE 7 NORTH AMERICA GENE PANEL MARKET BY COUNTRY (USD BILLION) 2020-2030
TABLE 8 NORTH AMERICA GENE PANEL MARKET BY PRODUCT AND SERVICE (USD BILLION) 2020-2030
TABLE 9 NORTH AMERICA GENE PANEL MARKET BY TECHNIQUE (USD BILLION) 2020-2030
TABLE 10 NORTH AMERICA GENE PANEL MARKET BY DESIGN (USD BILLION) 2020-2030
TABLE 11 NORTH AMERICA GENE PANEL MARKET BY APPLICATION (USD BILLION) 2020-2030
TABLE 12 NORTH AMERICA GENE PANEL MARKET BY END USER (USD BILLION) 2020-2030
TABLE 13 US GENE PANEL MARKET BY PRODUCT AND SERVICE (USD BILLION) 2020-2030
TABLE 14 US GENE PANEL MARKET BY TECHNIQUE (USD BILLION) 2020-2030
TABLE 15 US GENE PANEL MARKET BY DESIGN (USD BILLION) 2020-2030
TABLE 16 US GENE PANEL MARKET BY APPLICATION (USD BILLION) 2020-2030
TABLE 17 US GENE PANEL MARKET BY END USER (USD BILLION) 2020-2030
TABLE 18 CANADA GENE PANEL MARKET BY PRODUCT AND SERVICE (USD BILLION) 2020-2030
TABLE 19 CANADA GENE PANEL MARKET BY TECHNIQUE (USD BILLION) 2020-2030
TABLE 20 CANADA GENE PANEL MARKET BY DESIGN (USD BILLION) 2020-2030
TABLE 21 CANADA GENE PANEL MARKET BY APPLICATION (USD BILLION) 2020-2030
TABLE 22 CANADA GENE PANEL MARKET BY END USER (USD BILLION) 2020-2030
TABLE 23 MEXICO GENE PANEL MARKET BY PRODUCT AND SERVICE (USD BILLION) 2020-2030
TABLE 24 MEXICO GENE PANEL MARKET BY TECHNIQUE (USD BILLION) 2020-2030
TABLE 25 MEXICO GENE PANEL MARKET BY DESIGN (USD BILLION) 2020-2030
TABLE 26 MEXICO GENE PANEL MARKET BY APPLICATION (USD BILLION) 2020-2030
TABLE 27 MEXICO GENE PANEL MARKET BY END USER (USD BILLION) 2020-2030
TABLE 28 SOUTH AMERICA GENE PANEL MARKET BY COUNTRY (USD BILLION) 2020-2030
TABLE 29 SOUTH AMERICA GENE PANEL MARKET BY PRODUCT AND SERVICE (USD BILLION) 2020-2030
TABLE 30 SOUTH AMERICA GENE PANEL MARKET BY TECHNIQUE (USD BILLION) 2020-2030
TABLE 31 SOUTH AMERICA GENE PANEL MARKET BY DESIGN (USD BILLION) 2020-2030
TABLE 32 SOUTH AMERICA GENE PANEL MARKET BY APPLICATION (USD BILLION) 2020-2030
TABLE 33 SOUTH AMERICA GENE PANEL MARKET BY END USER (USD BILLION) 2020-2030
TABLE 34 BRAZIL GENE PANEL MARKET BY PRODUCT AND SERVICE (USD BILLION) 2020-2030
TABLE 35 BRAZIL GENE PANEL MARKET BY TECHNIQUE (USD BILLION) 2020-2030
TABLE 36 BRAZIL GENE PANEL MARKET BY DESIGN (USD BILLION) 2020-2030
TABLE 37 BRAZIL GENE PANEL MARKET BY APPLICATION (USD BILLION) 2020-2030
TABLE 38 BRAZIL GENE PANEL MARKET BY END USER (USD BILLION) 2020-2030
TABLE 39 ARGENTINA GENE PANEL MARKET BY PRODUCT AND SERVICE (USD BILLION) 2020-2030
TABLE 40 ARGENTINA GENE PANEL MARKET BY TECHNIQUE (USD BILLION) 2020-2030
TABLE 41 ARGENTINA GENE PANEL MARKET BY DESIGN (USD BILLION) 2020-2030
TABLE 42 ARGENTINA GENE PANEL MARKET BY APPLICATION (USD BILLION) 2020-2030
TABLE 43 ARGENTINA GENE PANEL MARKET BY END USER (USD BILLION) 2020-2030
TABLE 44 COLOMBIA GENE PANEL MARKET BY PRODUCT AND SERVICE (USD BILLION) 2020-2030
TABLE 45 COLOMBIA GENE PANEL MARKET BY TECHNIQUE (USD BILLION) 2020-2030
TABLE 46 COLOMBIA GENE PANEL MARKET BY DESIGN (USD BILLION) 2020-2030
TABLE 47 COLOMBIA GENE PANEL MARKET BY APPLICATION (USD BILLION) 2020-2030
TABLE 48 COLOMBIA GENE PANEL MARKET BY END USER (USD BILLION) 2020-2030
TABLE 49 REST OF SOUTH AMERICA GENE PANEL MARKET BY PRODUCT AND SERVICE (USD BILLION) 2020-2030
TABLE 50 REST OF SOUTH AMERICA GENE PANEL MARKET BY TECHNIQUE (USD BILLION) 2020-2030
TABLE 51 REST OF SOUTH AMERICA GENE PANEL MARKET BY DESIGN (USD BILLION) 2020-2030
TABLE 52 REST OF SOUTH AMERICA GENE PANEL MARKET BY APPLICATION (USD BILLION) 2020-2030
TABLE 53 REST OF SOUTH AMERICA GENE PANEL MARKET BY END USER (USD BILLION) 2020-2030
TABLE 54 ASIA-PACIFIC GENE PANEL MARKET BY COUNTRY (USD BILLION) 2020-2030
TABLE 55 ASIA-PACIFIC GENE PANEL MARKET BY PRODUCT AND SERVICE (USD BILLION) 2020-2030
TABLE 56 ASIA-PACIFIC GENE PANEL MARKET BY TECHNIQUE (USD BILLION) 2020-2030
TABLE 57 ASIA-PACIFIC GENE PANEL MARKET BY DESIGN (USD BILLION) 2020-2030
TABLE 58 ASIA-PACIFIC GENE PANEL MARKET BY APPLICATION (USD BILLION) 2020-2030
TABLE 59 ASIA-PACIFIC GENE PANEL MARKET BY END USER (USD BILLION) 2020-2030
TABLE 60 INDIA GENE PANEL MARKET BY PRODUCT AND SERVICE (USD BILLION) 2020-2030
TABLE 61 INDIA GENE PANEL MARKET BY TECHNIQUE (USD BILLION) 2020-2030
TABLE 62 INDIA GENE PANEL MARKET BY DESIGN (USD BILLION) 2020-2030
TABLE 63 INDIA GENE PANEL MARKET BY APPLICATION (USD BILLION) 2020-2030
TABLE 64 INDIA GENE PANEL MARKET BY END USER (USD BILLION) 2020-2030
TABLE 65 CHINA GENE PANEL MARKET BY PRODUCT AND SERVICE (USD BILLION) 2020-2030
TABLE 66 CHINA GENE PANEL MARKET BY TECHNIQUE (USD BILLION) 2020-2030
TABLE 67 CHINA GENE PANEL MARKET BY DESIGN (USD BILLION) 2020-2030
TABLE 68 CHINA GENE PANEL MARKET BY APPLICATION (USD BILLION) 2020-2030
TABLE 69 CHINA GENE PANEL MARKET BY END USER (USD BILLION) 2020-2030
TABLE 70 JAPAN GENE PANEL MARKET BY PRODUCT AND SERVICE (USD BILLION) 2020-2030
TABLE 71 JAPAN GENE PANEL MARKET BY TECHNIQUE (USD BILLION) 2020-2030
TABLE 72 JAPAN GENE PANEL MARKET BY DESIGN (USD BILLION) 2020-2030
TABLE 73 JAPAN GENE PANEL MARKET BY APPLICATION (USD BILLION) 2020-2030
TABLE 74 JAPAN GENE PANEL MARKET BY END USER (USD BILLION) 2020-2030
TABLE 75 SOUTH KOREA GENE PANEL MARKET BY PRODUCT AND SERVICE (USD BILLION) 2020-2030
TABLE 76 SOUTH KOREA GENE PANEL MARKET BY TECHNIQUE (USD BILLION) 2020-2030
TABLE 77 SOUTH KOREA GENE PANEL MARKET BY DESIGN (USD BILLION) 2020-2030
TABLE 78 SOUTH KOREA GENE PANEL MARKET BY APPLICATION (USD BILLION) 2020-2030
TABLE 79 SOUTH KOREA GENE PANEL MARKET BY END USER (USD BILLION) 2020-2030
TABLE 80 AUSTRALIA GENE PANEL MARKET BY PRODUCT AND SERVICE (USD BILLION) 2020-2030
TABLE 81 AUSTRALIA GENE PANEL MARKET BY TECHNIQUE (USD BILLION) 2020-2030
TABLE 82 AUSTRALIA GENE PANEL MARKET BY DESIGN (USD BILLION) 2020-2030
TABLE 83 AUSTRALIA GENE PANEL MARKET BY APPLICATION (USD BILLION) 2020-2030
TABLE 84 AUSTRALIA GENE PANEL MARKET BY END USER (USD BILLION) 2020-2030
TABLE 85 SOUTH-EAST ASIA GENE PANEL MARKET BY PRODUCT AND SERVICE (USD BILLION) 2020-2030
TABLE 86 SOUTH-EAST ASIA GENE PANEL MARKET BY TECHNIQUE (USD BILLION) 2020-2030
TABLE 87 SOUTH-EAST ASIA GENE PANEL MARKET BY DESIGN (USD BILLION) 2020-2030
TABLE 88 SOUTH-EAST ASIA GENE PANEL MARKET BY APPLICATION (USD BILLION) 2020-2030
TABLE 89 SOUTH-EAST ASIA GENE PANEL MARKET BY END USER (USD BILLION) 2020-2030
TABLE 90 REST OF ASIA PACIFIC GENE PANEL MARKET BY PRODUCT AND SERVICE (USD BILLION) 2020-2030
TABLE 91 REST OF ASIA PACIFIC GENE PANEL MARKET BY TECHNIQUE (USD BILLION) 2020-2030
TABLE 92 REST OF ASIA PACIFIC GENE PANEL MARKET BY DESIGN (USD BILLION) 2020-2030
TABLE 93 REST OF ASIA PACIFIC GENE PANEL MARKET BY APPLICATION (USD BILLION) 2020-2030
TABLE 94 REST OF ASIA PACIFIC GENE PANEL MARKET BY END USER (USD BILLION) 2020-2030
TABLE 95 EUROPE GENE PANEL MARKET BY COUNTRY (USD BILLION) 2020-2030
TABLE 96 EUROPE GENE PANEL MARKET BY PRODUCT AND SERVICE (USD BILLION) 2020-2030
TABLE 97 EUROPE GENE PANEL MARKET BY TECHNIQUE (USD BILLION) 2020-2030
TABLE 98 EUROPE GENE PANEL MARKET BY DESIGN (USD BILLION) 2020-2030
TABLE 99 EUROPE GENE PANEL MARKET BY APPLICATION (USD BILLION) 2020-2030
TABLE 100 EUROPE GENE PANEL MARKET BY END USER (USD BILLION) 2020-2030
TABLE 101 GERMANY GENE PANEL MARKET BY PRODUCT AND SERVICE (USD BILLION) 2020-2030
TABLE 102 GERMANY GENE PANEL MARKET BY TECHNIQUE (USD BILLION) 2020-2030
TABLE 103 GERMANY GENE PANEL MARKET BY DESIGN (USD BILLION) 2020-2030
TABLE 104 GERMANY GENE PANEL MARKET BY APPLICATION (USD BILLION) 2020-2030
TABLE 105 GERMANY GENE PANEL MARKET BY END USER (USD BILLION) 2020-2030
TABLE 106 UK GENE PANEL MARKET BY PRODUCT AND SERVICE (USD BILLION) 2020-2030
TABLE 107 UK GENE PANEL MARKET BY TECHNIQUE (USD BILLION) 2020-2030
TABLE 108 UK GENE PANEL MARKET BY DESIGN (USD BILLION) 2020-2030
TABLE 109 UK GENE PANEL MARKET BY APPLICATION (USD BILLION) 2020-2030
TABLE 110 UK GENE PANEL MARKET BY END USER (USD BILLION) 2020-2030
TABLE 111 FRANCE GENE PANEL MARKET BY PRODUCT AND SERVICE (USD BILLION) 2020-2030
TABLE 112 FRANCE GENE PANEL MARKET BY TECHNIQUE (USD BILLION) 2020-2030
TABLE 113 FRANCE GENE PANEL MARKET BY DESIGN (USD BILLION) 2020-2030
TABLE 114 FRANCE GENE PANEL MARKET BY APPLICATION (USD BILLION) 2020-2030
TABLE 115 FRANCE GENE PANEL MARKET BY END USER (USD BILLION) 2020-2030
TABLE 116 ITALY GENE PANEL MARKET BY PRODUCT AND SERVICE (USD BILLION) 2020-2030
TABLE 117 ITALY GENE PANEL MARKET BY TECHNIQUE (USD BILLION) 2020-2030
TABLE 118 ITALY GENE PANEL MARKET BY DESIGN (USD BILLION) 2020-2030
TABLE 119 ITALY GENE PANEL MARKET BY APPLICATION (USD BILLION) 2020-2030
TABLE 120 ITALY GENE PANEL MARKET BY END USER (USD BILLION) 2020-2030
TABLE 121 SPAIN GENE PANEL MARKET BY PRODUCT AND SERVICE (USD BILLION) 2020-2030
TABLE 122 SPAIN GENE PANEL MARKET BY TECHNIQUE (USD BILLION) 2020-2030
TABLE 123 SPAIN GENE PANEL MARKET BY DESIGN (USD BILLION) 2020-2030
TABLE 124 SPAIN GENE PANEL MARKET BY APPLICATION (USD BILLION) 2020-2030
TABLE 125 SPAIN GENE PANEL MARKET BY END USER (USD BILLION) 2020-2030
TABLE 126 RUSSIA GENE PANEL MARKET BY PRODUCT AND SERVICE (USD BILLION) 2020-2030
TABLE 127 RUSSIA GENE PANEL MARKET BY TECHNIQUE (USD BILLION) 2020-2030
TABLE 128 RUSSIA GENE PANEL MARKET BY DESIGN (USD BILLION) 2020-2030
TABLE 129 RUSSIA GENE PANEL MARKET BY APPLICATION (USD BILLION) 2020-2030
TABLE 130 RUSSIA GENE PANEL MARKET BY END USER (USD BILLION) 2020-2030
TABLE 131 REST OF EUROPE GENE PANEL MARKET BY PRODUCT AND SERVICE (USD BILLION) 2020-2030
TABLE 132 REST OF EUROPE GENE PANEL MARKET BY TECHNIQUE (USD BILLION) 2020-2030
TABLE 133 REST OF EUROPE GENE PANEL MARKET BY DESIGN (USD BILLION) 2020-2030
TABLE 134 REST OF EUROPE GENE PANEL MARKET BY APPLICATION (USD BILLION) 2020-2030
TABLE 135 REST OF EUROPE GENE PANEL MARKET BY END USER (USD BILLION) 2020-2030
TABLE 136 MIDDLE EAST AND AFRICA GENE PANEL MARKET BY COUNTRY (USD BILLION) 2020-2030
TABLE 137 MIDDLE EAST AND AFRICA GENE PANEL MARKET BY PRODUCT AND SERVICE (USD BILLION) 2020-2030
TABLE 138 MIDDLE EAST AND AFRICA GENE PANEL MARKET BY TECHNIQUE (USD BILLION) 2020-2030
TABLE 139 MIDDLE EAST AND AFRICA GENE PANEL MARKET BY DESIGN (USD BILLION) 2020-2030
TABLE 140 MIDDLE EAST AND AFRICA GENE PANEL MARKET BY APPLICATION (USD BILLION) 2020-2030
TABLE 141 MIDDLE EAST AND AFRICA GENE PANEL MARKET BY END USER (USD BILLION) 2020-2030
TABLE 142 UAE GENE PANEL MARKET BY PRODUCT AND SERVICE (USD BILLION) 2020-2030
TABLE 143 UAE GENE PANEL MARKET BY TECHNIQUE (USD BILLION) 2020-2030
TABLE 144 UAE GENE PANEL MARKET BY DESIGN (USD BILLION) 2020-2030
TABLE 145 UAE GENE PANEL MARKET BY APPLICATION (USD BILLION) 2020-2030
TABLE 146 UAE GENE PANEL MARKET BY END USER (USD BILLION) 2020-2030
TABLE 147 SAUDI ARABIA GENE PANEL MARKET BY PRODUCT AND SERVICE (USD BILLION) 2020-2030
TABLE 148 SAUDI ARABIA GENE PANEL MARKET BY TECHNIQUE (USD BILLION) 2020-2030
TABLE 149 SAUDI ARABIA GENE PANEL MARKET BY DESIGN (USD BILLION) 2020-2030
TABLE 150 SAUDI ARABIA GENE PANEL MARKET BY APPLICATION (USD BILLION) 2020-2030
TABLE 151 SAUDI ARABIA GENE PANEL MARKET BY END USER (USD BILLION) 2020-2030
TABLE 152 SOUTH AFRICA GENE PANEL MARKET BY PRODUCT AND SERVICE (USD BILLION) 2020-2030
TABLE 153 SOUTH AFRICA GENE PANEL MARKET BY TECHNIQUE (USD BILLION) 2020-2030
TABLE 154 SOUTH AFRICA GENE PANEL MARKET BY DESIGN (USD BILLION) 2020-2030
TABLE 155 SOUTH AFRICA GENE PANEL MARKET BY APPLICATION (USD BILLION) 2020-2030
TABLE 156 SOUTH AFRICA GENE PANEL MARKET BY END USER (USD BILLION) 2020-2030
TABLE 157 REST OF MIDDLE EAST AND AFRICA GENE PANEL MARKET BY PRODUCT AND SERVICE (USD BILLION) 2020-2030
TABLE 158 REST OF MIDDLE EAST AND AFRICA GENE PANEL MARKET BY TECHNIQUE (USD BILLION) 2020-2030
TABLE 159 REST OF MIDDLE EAST AND AFRICA GENE PANEL MARKET BY DESIGN (USD BILLION) 2020-2030
TABLE 160 REST OF MIDDLE EAST AND AFRICA GENE PANEL MARKET BY APPLICATION (USD BILLION) 2020-2030
TABLE 161 REST OF MIDDLE EAST AND AFRICA GENE PANEL MARKET BY END USER (USD BILLION) 2020-2030
LIST OF FIGURES
FIGURE 1 MARKET DYNAMICS
FIGURE 2 REPORT TIMELINES: YEARS CONSIDERED
FIGURE 3 BOTTOM-UP APPROACH
FIGURE 4 RESEARCH FLOW
FIGURE 5 GLOBAL GENE PANEL MARKET BY PRODUCT AND SERVICE, USD BILLION, 2020-2030
FIGURE 6 GLOBAL GENE PANEL MARKET BY TECHNIQUE, USD BILLION, 2020-2030
FIGURE 7 GLOBAL GENE PANEL MARKET BY DESIGN, USD BILLION, 2020-2030
FIGURE 8 GLOBAL GENE PANEL MARKET BY APPLICATION, USD BILLION, 2020-2030
FIGURE 9 GLOBAL GENE PANEL MARKET BY END USER, USD BILLION, 2020-2030
FIGURE 19 GLOBAL GENE PANEL MARKET BY REGION, USD BILLION, 2020-2030
FIGURE 11 PORTER’S FIVE FORCES MODEL
FIGURE 12 GLOBAL GENE PANEL MARKET BY PRODUCT AND SERVICE, USD BILLION, 2022
FIGURE 13 GLOBAL GENE PANEL MARKET BY TECHNIQUE, USD BILLION, 2022
FIGURE 14 GLOBAL GENE PANEL MARKET BY DESIGN, USD BILLION, 2022
FIGURE 15 GLOBAL GENE PANEL MARKET BY APPLICATION, USD BILLION, 2022
FIGURE 16 GLOBAL GENE PANEL MARKET BY END USER, USD BILLION, 2022
FIGURE 17 GLOBAL GENE PANEL MARKET BY REGION, USD BILLION, 2022
FIGURE 18 MARKET SHARE ANALYSIS
FIGURE 19 AGILENT TECHNOLOGIES: COMPANY SNAPSHOT
FIGURE 20 ILLUMINA INC.: COMPANY SNAPSHOT
FIGURE 21 QIAGEN INC.: COMPANY SNAPSHOT
FIGURE 22 EUROFINS GENOMICS: COMPANY SNAPSHOT
FIGURE 23 THERMO FISHER SCIENTIFIC: COMPANY SNAPSHOT
FIGURE 24 FOUNDATION MEDICINE INC.: COMPANY SNAPSHOT
FIGURE 25 GUARDANT HEALTH, INC.: COMPANY SNAPSHOT
FIGURE 26 MYRIAD GENETIC LABORATORIES INC.: COMPANY SNAPSHOT
FIGURE 27 CEPHEID: COMPANY SNAPSHOT
FIGURE 28 BIO-RAD LABORATORIES, INC.: COMPANY SNAPSHOT
FAQ
The gene panel market is expected to grow at 20.02 % CAGR from 2023 to 2030. It is expected to reach above USD 13.2 billion by 2030 from USD 3.02 billion in 2023.
North America held more than 45 % of the gene panel market revenue share in 2022 and will witness expansion in the forecast period.
The benefits of gene panels in addition to an increase in corporate initiatives around the world are the main drivers of the gene panel industry. The market is also being driven by factors like rising genetic testing adoption, technology developments like the Next Generation Sequencing System, and the demand for effective prenatal diagnosis.
Due to the minimally invasive nature of gene panels and the extraordinary increase in the rate of cancer occurrence worldwide, the cancer risk assessment segment held the greatest share of the market in 2022, accounting for approximately 45.0%.
With a market share of over 45.0% in 2022, North America was in the lead and is expected to continue to experience profitable growth during the projected period. In the United States, gene panels are intended to enhance recommended genetic screening with the help of machine learning by detecting various genetic abnormalities, preferably utilising liquid biopsy or blood samples.
In-Depth Database
Our Report’s database covers almost all topics of all regions over the Globe.
Recognised Publishing Sources
Tie ups with top publishers around the globe.
Customer Support
Complete pre and post sales
support.
Safe & Secure
Complete secure payment
process.
