REPORT OUTLOOK
| Market Size | CAGR | Dominating Region |
|---|---|---|
| USD 17.95 Billion by 2030 | 30 % | North America |
| by Deployment Type | by Application |
|---|---|
|
|
SCOPE OF THE REPORT
3D Rendering and Virtualization Software Market Overview
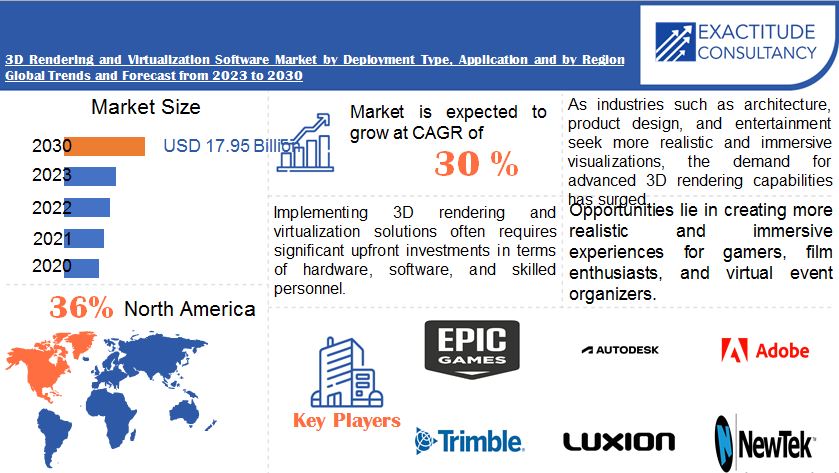
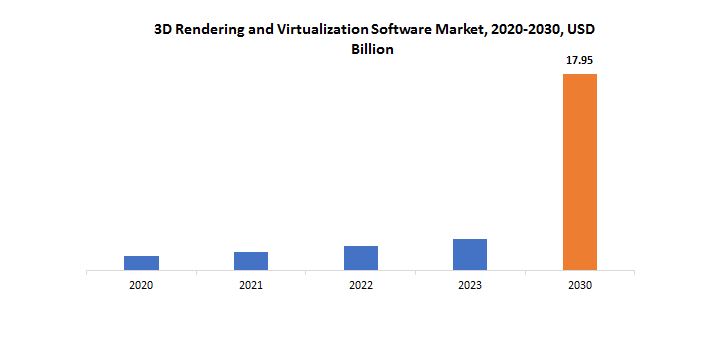
The global 3D Rendering and Virtualization Software Market is anticipated to grow from USD 2.86 Billion in 2023 to USD 17.95 Billion by 2030, at a CAGR of 30 % during the forecast period.
The term “market” refers to the dynamic and quickly changing field of 3D rendering and virtualization software, which includes a variety of tools and solutions for producing lifelike three-dimensional visual representations of objects, scenes, or environments. Several industries, such as virtual reality, architecture, gaming, film production, and product design, depend heavily on this market. Software programs make it possible to convert digital models into visually stunning pictures or animations for 3D rendering, mimicking textures, lighting, and other visual components to produce a realistic portrayal. In fields like architecture and product design, where experts depend on precise visualizations for concept development, presentations, and client communication, this procedure is essential.
In this market, virtualization software is used to create simulations or virtual environments that users can interact with in real time. This goes beyond simple 3D rendering and lets users interact with and experience virtual environments, objects, and situations. Applications for virtualization include gaming, training simulations, and virtual reality encounters, which let users submerge themselves for fun, knowledge, or instruction in computer-generated worlds. Since technological advancements spur innovation and industries increasingly recognize the value of realistic digital visualizations and immersive virtual experiences, the market for 3D rendering and virtualization software is expected to continue growing. This market is anticipated to continue evolving and developing cutting-edge solutions as the demand for interactive, visually rich content grows across various sectors.
| ATTRIBUTE | DETAILS |
| Study period | 2020-2030 |
| Base year | 2022 |
| Estimated year | 2023 |
| Forecasted year | 2023-2030 |
| Historical period | 2019-2021 |
| Unit | Value (USD Billion) |
| Segmentation | By Deployment Type, Application and Region |
|
By Deployment Type |
|
|
By Application |
|
|
By Region
|
|
3D Rendering and Virtualization Software Market Segmentation Analysis
The global 3D Rendering and Virtualization Software Market is divided into three segments Deployment type, Application and region. By Deployment Type is divided as On-Premises, Cloud. On-Premises holds the largest market share. The conventional method of installing and running software on a client’s hardware infrastructure on their actual property is known as “on-premises deployment.” This model is appropriate for those who place a high priority on security, compliance, and customization because it gives organizations more control over their infrastructure, data, and software. On the other hand, cloud deployment entails delivering the virtualization and 3D rendering software via the internet and hosting it on distant servers.
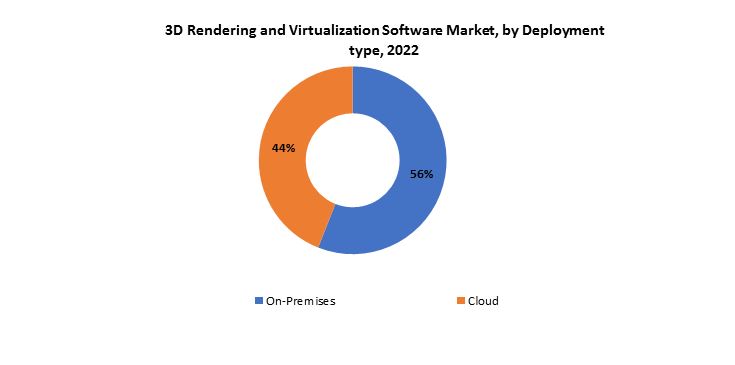
With this model, users can access the software and carry out rendering or virtualization tasks from any location with internet connectivity thanks to its scalability, flexibility, and accessibility. Cloud-based solutions are frequently subscription-based, which lowers the initial infrastructure costs and offers the advantage of automatic updates and maintenance. These features can be helpful for businesses looking for dynamic, affordable solutions. The decision between cloud and on-premises deployment is influenced by a number of variables, including financial constraints, scalability demands, security specifications, and organizational preferences. While some companies may use cloud-based solutions to take advantage of the advantages of remote access, scalability, and cost-efficiency, others may choose to deploy their systems on-premises in order to retain complete control and ownership over their infrastructure.
By Application it is divided as Product Design and Modeling, Animation, Visualization & Simulation, Others. Product Design and Modeling hold the largest market share. In this category, digital models of goods, prototypes, or architectural designs are created via the use of 3D rendering and virtualization software. These applications are used by the manufacturing, automotive, and architectural industries to visualize and improve designs prior to actual production. Professionals can use it to refine design concepts, evaluate functionality, and make well-informed choices regarding the usability and aesthetics of products. Software for 3D rendering and virtualization finds extensive use in the animation industry. Creating dynamic and moving visual content for a range of media, including movies, video games, and multimedia presentations, is included in this. These are the tools animators use to create realistic and visually appealing animation of characters, scenes, and storytelling elements.
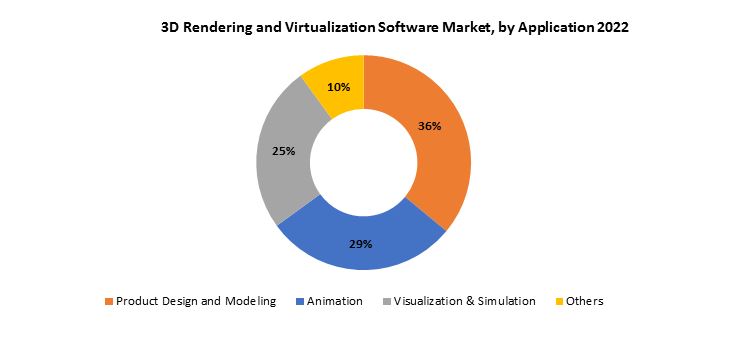
Applications for visualization and simulation entail building lifelike virtual worlds for objectives other than amusement. Virtual reality experiences, training scenarios, medical simulations, and architectural walkthroughs are examples of this. Professionals in domains like architecture, medicine, and education use virtualization and 3D rendering software to mimic real-world scenarios, enhancing comprehension and decision-making. Additional specialized or niche applications that might not fit neatly into the categories of product design, animation, visualization, or simulation are included in the “others” category. This could include uses for 3D rendering and virtualization that improve data representation and analysis in domains like augmented reality, scientific research, and geographic mapping.
3D Rendering and Virtualization Software Market Dynamics
Driver
The gaming and entertainment sectors are major consumers of 3D rendering technology.
Immersion and visual realism are highly desired in entertainment and gaming. The creation of incredibly realistic and detailed graphics is made possible by 3D rendering technology, which improves both the gaming and watching experiences. This is essential for producing visually stunning and captivating virtual worlds for video games and immersive film experiences. In order to satisfy players’ expectations, modern video games must have sophisticated graphics. Game developers can create realistic characters, complex environments, and dynamic visual effects with 3D rendering. Advanced rendering techniques improve the overall quality of gaming graphics by enabling more realistic animations, textures, and lighting. 3D rendering is essential for producing special effects and striking scenes in the entertainment sector, which includes film and animation.
Virtual production, the fusion of gaming technology and filmmaking, is becoming more and more popular. Filmmakers can visualize scenes and make creative decisions on the spot with the help of techniques like real-time rendering, which improves production efficiency and flexibility. Virtual reality and augmented reality technologies are being adopted by the gaming and entertainment industries at a rapid pace. The creation of realistic and interactive virtual environments in these immersive experiences is largely dependent on 3D rendering. Realistic rendering is necessary for an engaging VR or AR experience, whether it is in gaming or immersive storytelling. In the gaming industry, where instantaneous rendering is essential for a responsive and fluid gaming experience, real-time rendering is in high demand. Character movements that are responsive and dynamic can be made possible by real-time rendering technologies.
Restraint
Integrating 3D rendering and virtualization software with existing workflows and systems can be challenging.
Certain operating systems, hardware setups, and other software dependencies may have particular compatibility requirements for 3D rendering and virtualization software. To prevent interruptions, compatibility with current systems must be guaranteed. Different data formats and standards may be used by various 3D rendering and virtualization tools. The smooth transfer of data between systems can be hampered by incompatibilities in data formats. It might be required to use conversion tools or establish standard protocols. Establishing new software can cause workflows to become unbalanced. Workers’ productivity may temporarily decline as they adjust to new procedures. To reduce interruptions, the integration must be meticulously planned. It is important for training programs to make sure that users can easily incorporate new technology into their workflows and close the knowledge gap.
Every organization has different requirements and workflows. Customization may be necessary to set up 3D rendering and virtualization software to meet particular business requirements. This may entail working with the software provider or doing more development work. It can be difficult to transfer current data to the new 3D rendering and virtualization system. Project and design integrity depends on a precise and seamless data migration that is free from loss or corruption. Scalability becomes an issue when business needs change. When workloads increase or project scope changes, the integrated system should be able to adapt and grow with it.
Opportunities
3D rendering is widely used in architectural visualization to create lifelike representations of buildings and spaces.
Using 3D rendering, designers and architects can visually impress clients and stakeholders with their designs. Through realistic depictions of structures, interiors, and exteriors, renderings help clients better comprehend the suggested designs. Creating incredibly realistic and detailed images is made possible by 3D rendering. In architectural visualization, this degree of detail is essential for accurately showcasing materials, lighting, and complex design elements. 3D rendering is a common tool used by architects to produce virtual walkthroughs of their designs. This makes it possible for customers to interact with the space as though they were in person, giving them a more interactive and immersive comprehension of the architectural ideas. 3D rendering is a useful tool for interior designers to communicate and visualize their design concepts. This covers furniture arrangements, color palettes, and lighting conditions.
3D rendering is used in urban planning and city development projects to show how proposed structures will affect the surrounding environment. It assists zoning, infrastructure, and general cityscape aesthetic decision-making for city planners and authorities. Architects and clients can effectively communicate with each other through 3D renderings. They lessen misunderstandings and guarantee client satisfaction by facilitating more transparent conversations regarding design decisions, adjustments, and the project’s overarching goal. 3D rendering is used by marketing departments and real estate developers to produce advertising for architectural projects. Superior images aid in the marketing of properties prior to construction, drawing in prospective purchasers and financiers.
3D Rendering and Virtualization Software Market Trends
-
The ability to render content in real time has grown in significance. The need for immediate feedback in a variety of industries, including gaming, design, and architecture, is what’s driving this trend. GPU acceleration and ray tracing are two examples of technologies that help create high-quality, real-time rendering for engaging user experiences.
-
Cloud-based rendering solutions were becoming more and more popular. By shifting demanding computational workloads to distant servers, cloud rendering enables users to expedite processing times and minimize the requirement for robust local hardware. Scalability, flexibility, and cost-effectiveness are all aided by this trend.
-
One of the most common trends in 3D rendering and virtualization software is the incorporation of VR and AR technologies. VR and AR are being used by a variety of industries, including gaming, architecture, and training simulations, to produce more engaging and dynamic experiences.
-
Rendering software is becoming more and more integrated with AI and machine learning to improve automation, streamline workflows, and produce higher-quality rendered images. Features like automated scene optimization, noise reduction, and predictive rendering can benefit from the use of these technologies.
-
Software for virtualization and 3D rendering has become more widely used in a variety of industries. Although it has historically been important in the gaming and entertainment industries, industries like healthcare, education, automotive design, and manufacturing are adopting it more frequently for simulation, training, and prototyping purposes.
Competitive Landscape
The competitive landscape of the 3D Rendering and Virtualization Software Market was dynamic, with several prominent companies competing to provide innovative and advanced 3D Rendering and Virtualization Software solutions.
- Autodesk
- NVIDIA Corporation
- Adobe Inc.
- Dassault Systèmes
- Trimble Inc.
- Chaos Group
- Unity Technologies
- Epic Games
- Blender Foundation
- MAXON Computer
- Luxion
- KeyShot
- Next Limit Technologies
- Enscape
- OTOY Inc.
- V-Ray (Chaos Group)
- Redshift Rendering Technologies
- Foundry
- Reallusion Inc.
- Act-3D B.V.
- Newtek
Recent Developments:
October 6, 2021: Rethinking how businesses plan, design, and manufacture products is no small task. So, while many companies understand the importance of Digital Transformation, the process of transitioning an entire manufacturing process, and securing the necessary buy-in, is a colossal effort. A significant impediment is that many digital tools are too complex and too siloed, making change unnecessarily difficult. We at Autodesk aim to change that with Fusion 360, our cloud-based 3D modeling, CAD, CAM, CAE, and PCB software platform
October 6, 2022: Demand for streaming content and games is exploding due to the global pandemic, which spurred massive changes across the media and entertainment (M&E) industry. Studios were scrambling as film shoots stalled and teams were confined to their homes. The industry was already showing signs of moving to cloud long term, but out of necessity, years of planning turned into weeks of execution. Teams connected in the cloud, and production continued from home. This shift to the cloud presents an excellent opportunity to do things differently, and to build a more resilient future. Autodesk’s vision is to help accelerate that transition by unlocking new levels of collaboration, creativity, efficiency, and insights. Today, at Autodesk University (AU) 2021, we’re announcing the ways we’re driving the industry forward through our data-fluent cloud-based workflows and industry partnerships.
Regional Analysis
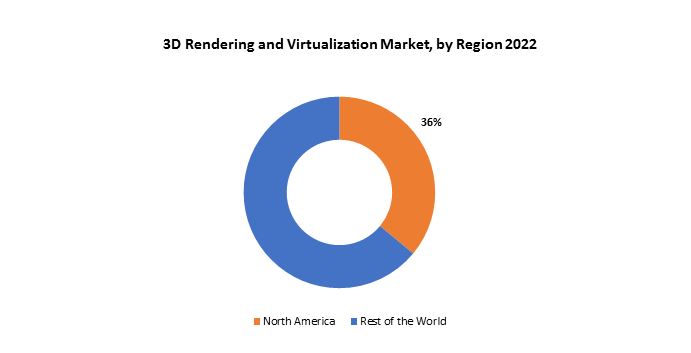
North America accounted for the largest market in the 3D Rendering and Virtualization Software market. It accounted for 36% of the worldwide market value. Because of its advanced technology adoption across a wide range of industries and its strong technological infrastructure, North America has been a major player in the global 3D rendering and virtualization software market. Demand for 3D rendering and virtualization solutions has increased in the region in a number of industries, including media and entertainment, manufacturing, gaming, architecture, and healthcare. North America has been a major market for 3D rendering software in the gaming industry because of the growing demand for immersive gaming experiences and high-quality graphics. The region’s game developers use cutting-edge rendering techniques to produce visually stunning and realistic environments that improve players’ overall gaming experiences.
In order to produce intricate and realistic project visualizations, North American architecture and design firms have also embraced 3D rendering and virtualization software. With the use of this technology, designers and architects can communicate with clients and stakeholders more effectively by showcasing their ideas in a more captivating way. Virtualization software is used in the healthcare industry for medical imaging and simulation. It gives medical professionals access to realistic 3D models for research, training, and surgical planning. Patient care and medical visualization have advanced as a result of the use of these technologies in North American hospitals and research facilities.
Target Audience for 3D Rendering and Virtualization Software Market
- Architects
- Interior Designers
- Real Estate Developers
- Urban Planners
- Product Designers
- Graphic Designers
- Gaming Developers
- Film and Animation Studios
- Automotive Designers
- Medical Researchers
- Educational Institutions
- Food Testing Laboratories
- Government Health Departments
- Food Inspection Agencies
Import & Export Data for 3D Rendering and Virtualization Software Market
Exactitude consultancy provides import and export data for the recent years. It also offers insights on production and consumption volume of the product. Understanding the import and export data is pivotal for any player in the 3D Rendering and Virtualization Software market. This knowledge equips businesses with strategic advantages, such as:
- Identifying emerging markets with untapped potential.
- Adapting supply chain strategies to optimize cost-efficiency and market responsiveness.
- Navigating competition by assessing major players’ trade dynamics.
Key insights
-
Trade volume trends: our report dissects import and export data spanning the last five years to reveal crucial trends and growth patterns within the global 3D Rendering and Virtualization Software market. This data-driven exploration empowers readers with a deep understanding of the market’s trajectory.
-
Market players: gain insights into the leading players driving the 3D Rendering and Virtualization Software trade. From established giants to emerging contenders, our analysis highlights the key contributors to the import and export landscape.
-
Geographical dynamics: delve into the geographical distribution of trade activities. Uncover which regions dominate exports and which ones hold the reins on imports, painting a comprehensive picture of the industry’s global footprint.
-
Product breakdown: by segmenting data based on 3D Rendering and Virtualization Software types –– we provide a granular view of trade preferences and shifts, enabling businesses to align strategies with the evolving technological landscape.
Import and export data is crucial in reports as it offers insights into global market trends, identifies emerging opportunities, and informs supply chain management. By analyzing trade flows, businesses can make informed decisions, manage risks, and tailor strategies to changing demand. This data aids government in policy formulation and trade negotiations, while investors use it to assess market potential. Moreover, import and export data contributes to economic indicators, influences product innovation, and promotes transparency in international trade, making it an essential component for comprehensive and informed analyses.
Segments Covered in the 3D Rendering and Virtualization Software Market Report
3D Rendering and Virtualization Software Market by Deployment Type Value (USD Billion)
- On-Premises
- Cloud
3D Rendering and Virtualization Software Market by Application (USD Billion)
- Product Design and Modeling
- Animation
- Visualization & Simulation
- Others
3D Rendering and Virtualization Software Market by Region Value (USD Billion)
- North America
- Europe
- Asia Pacific
- South America
- Middle East and Africa
Key Question Answered
- What is the expected growth rate of the 3D Rendering and Virtualization Software Market over the next 7 years?
- Who are the major players in the 3D Rendering and Virtualization Software Market and what is their market share?
- What are the end-user industries driving market demand and what is their outlook?
- What are the opportunities for growth in emerging markets such as Asia-Pacific, the middle east, and Africa?
- How is the economic environment affecting the 3D Rendering and Virtualization Software market, including factors such as interest rates, inflation, and exchange rates?
- What is the expected impact of government policies and regulations on the 3D Rendering and Virtualization Software market?
- What is the current and forecasted size and growth rate of the global 3D Rendering and Virtualization Software market?
- What are the key drivers of growth in the 3D Rendering and Virtualization Software market?
- Who are the major players in the market and what is their market share?
- What are the distribution channels and supply chain dynamics in the 3D Rendering and Virtualization Software market?
- What are the technological advancements and innovations in the 3D Rendering and Virtualization Software Market and their impact on product development and growth?
- What are the regulatory considerations and their impact on the market?
- What are the challenges faced by players in the 3D Rendering and Virtualization Software Market and how are they addressing these challenges?
- What are the opportunities for growth and expansion in the 3D Rendering and Virtualization Software market?
- What are the product offerings and specifications of leading players in the market?
Table of Content
- INTRODUCTION
- MARKET DEFINITION
- MARKET SEGMENTATION
- RESEARCH TIMELINES
- ASSUMPTIONS AND LIMITATIONS
- RESEARCH METHODOLOGY
- DATA MINING
- SECONDARY RESEARCH
- PRIMARY RESEARCH
- SUBJECT-MATTER EXPERTS’ ADVICE
- QUALITY CHECKS
- FINAL REVIEW
- DATA TRIANGULATION
- BOTTOM-UP APPROACH
- TOP-DOWN APPROACH
- RESEARCH FLOW
- DATA SOURCES
- DATA MINING
- EXECUTIVE SUMMARY
- MARKET OVERVIEW
- GLOBAL 3D RENDERING AND VIRTUALIZATION SOFTWARE MARKET OUTLOOK
- MARKET DRIVERS
- MARKET RESTRAINTS
- MARKET OPPORTUNITIES
- IMPACT OF COVID-19 ON 3D RENDERING AND VIRTUALIZATION SOFTWARE MARKET
- PORTER’S FIVE FORCES MODEL
- THREAT FROM NEW ENTRANTS
- THREAT FROM SUBSTITUTES
- BARGAINING POWER OF SUPPLIERS
- BARGAINING POWER OF CUSTOMERS
- DEGREE OF COMPETITION
- INDUSTRY VALUE CHAIN ANALYSIS
- GLOBAL 3D RENDERING AND VIRTUALIZATION SOFTWARE MARKET OUTLOOK
- GLOBAL 3D RENDERING AND VIRTUALIZATION SOFTWARE MARKET BY DEPLOYMENT TYPE, 2020-2030, (USD BILLION)
- ON-PREMISES
- CLOUD
- GLOBAL 3D RENDERING AND VIRTUALIZATION SOFTWARE MARKET BY PRODUCT, 2020-2030, (USD BILLION)
- PRODUCT DESIGN AND MODELING
- ANIMATION
- VISUALIZATION & SIMULATION
- OTHERS
- GLOBAL 3D RENDERING AND VIRTUALIZATION SOFTWARE MARKET BY REGION, 2020-2030, (USD BILLION)
- NORTH AMERICA
- US
- CANADA
- MEXICO
- SOUTH AMERICA
- BRAZIL
- ARGENTINA
- COLOMBIA
- REST OF SOUTH AMERICA
- EUROPE
- GERMANY
- UK
- FRANCE
- ITALY
- SPAIN
- RUSSIA
- REST OF EUROPE
- ASIA PACIFIC
- INDIA
- CHINA
- JAPAN
- SOUTH KOREA
- AUSTRALIA
- SOUTH-EAST ASIA
- REST OF ASIA PACIFIC
- MIDDLE EAST AND AFRICA
- UAE
- SAUDI ARABIA
- SOUTH AFRICA
- REST OF MIDDLE EAST AND AFRICA
- NORTH AMERICA
- COMPANY PROFILES*
(BUSINESS OVERVIEW, COMPANY SNAPSHOT, PRODUCT OFFERED, RECENT DEVELOPMENTS)
- AUTODESK
- NVIDIA CORPORATION
- ADOBE INC.
- DASSAULT SYSTÈMES
- TRIMBLE INC.
- CHAOS GROUP
- UNITY TECHNOLOGIES
- EPIC GAMES
- BLENDER FOUNDATION
- MAXON COMPUTER
- LUXION
- KEYSHOT
- NEXT LIMIT TECHNOLOGIES
- ENSCAPE
- OTOY INC.
- V-RAY (CHAOS GROUP)
- REDSHIFT RENDERING TECHNOLOGIES
- FOUNDRY
- REALLUSION INC.
- ACT-3D B.V. *THE COMPANY LIST IS INDICATIVE
LIST OF TABLES
TABLE 1 GLOBAL 3D RENDERING AND VIRTUALIZATION SOFTWARE MARKET BY DEPLOYMENT TYPE (USD BILLION) 2020-2030
TABLE 2 GLOBAL 3D RENDERING AND VIRTUALIZATION SOFTWARE MARKET BY PRODUCT (USD BILLION) 2020-2030
TABLE 3 GLOBAL 3D RENDERING AND VIRTUALIZATION SOFTWARE MARKET BY REGION (USD BILLION) 2020-2030
TABLE 4 NORTH AMERICA 3D RENDERING AND VIRTUALIZATION SOFTWARE MARKET BY COUNTRY (USD BILLION) 2020-2030
TABLE 5 NORTH AMERICA 3D RENDERING AND VIRTUALIZATION SOFTWARE MARKET BY DEPLOYMENT TYPE (USD BILLION) 2020-2030
TABLE 6 NORTH AMERICA 3D RENDERING AND VIRTUALIZATION SOFTWARE MARKET BY PRODUCT (USD BILLION) 2020-2030
TABLE 7 US 3D RENDERING AND VIRTUALIZATION SOFTWARE MARKET BY DEPLOYMENT TYPE (USD BILLION) 2020-2030
TABLE 8 US 3D RENDERING AND VIRTUALIZATION SOFTWARE MARKET BY PRODUCT (USD BILLION) 2020-2030
TABLE 9 CANADA 3D RENDERING AND VIRTUALIZATION SOFTWARE MARKET BY DEPLOYMENT TYPE (USD BILLION) 2020-2030
TABLE 10 CANADA 3D RENDERING AND VIRTUALIZATION SOFTWARE MARKET BY PRODUCT (USD BILLION) 2020-2030
TABLE 11 MEXICO 3D RENDERING AND VIRTUALIZATION SOFTWARE MARKET BY DEPLOYMENT TYPE (USD BILLION) 2020-2030
TABLE 12 MEXICO 3D RENDERING AND VIRTUALIZATION SOFTWARE MARKET BY PRODUCT (USD BILLION) 2020-2030
TABLE 13 SOUTH AMERICA 3D RENDERING AND VIRTUALIZATION SOFTWARE MARKET BY COUNTRY (USD BILLION) 2020-2030
TABLE 14 SOUTH AMERICA 3D RENDERING AND VIRTUALIZATION SOFTWARE MARKET BY DEPLOYMENT TYPE (USD BILLION) 2020-2030
TABLE 15 SOUTH AMERICA 3D RENDERING AND VIRTUALIZATION SOFTWARE MARKET BY PRODUCT (USD BILLION) 2020-2030
TABLE 16 BRAZIL 3D RENDERING AND VIRTUALIZATION SOFTWARE MARKET BY DEPLOYMENT TYPE (USD BILLION) 2020-2030
TABLE 17 BRAZIL 3D RENDERING AND VIRTUALIZATION SOFTWARE MARKET BY PRODUCT (USD BILLION) 2020-2030
TABLE 18 ARGENTINA 3D RENDERING AND VIRTUALIZATION SOFTWARE MARKET BY DEPLOYMENT TYPE (USD BILLION) 2020-2030
TABLE 19 ARGENTINA 3D RENDERING AND VIRTUALIZATION SOFTWARE MARKET BY PRODUCT (USD BILLION) 2020-2030
TABLE 20 COLOMBIA 3D RENDERING AND VIRTUALIZATION SOFTWARE MARKET BY DEPLOYMENT TYPE (USD BILLION) 2020-2030
TABLE 21 COLOMBIA 3D RENDERING AND VIRTUALIZATION SOFTWARE MARKET BY PRODUCT (USD BILLION) 2020-2030
TABLE 22 REST OF SOUTH AMERICA 3D RENDERING AND VIRTUALIZATION SOFTWARE MARKET BY DEPLOYMENT TYPE (USD BILLION) 2020-2030
TABLE 23 REST OF SOUTH AMERICA 3D RENDERING AND VIRTUALIZATION SOFTWARE MARKET BY PRODUCT (USD BILLION) 2020-2030
TABLE 24 ASIA-PACIFIC 3D RENDERING AND VIRTUALIZATION SOFTWARE MARKET BY COUNTRY (USD BILLION) 2020-2030
TABLE 25 ASIA-PACIFIC 3D RENDERING AND VIRTUALIZATION SOFTWARE MARKET BY DEPLOYMENT TYPE (USD BILLION) 2020-2030
TABLE 26 ASIA-PACIFIC 3D RENDERING AND VIRTUALIZATION SOFTWARE MARKET BY PRODUCT (USD BILLION) 2020-2030
TABLE 27 INDIA 3D RENDERING AND VIRTUALIZATION SOFTWARE MARKET BY DEPLOYMENT TYPE (USD BILLION) 2020-2030
TABLE 28 INDIA 3D RENDERING AND VIRTUALIZATION SOFTWARE MARKET BY PRODUCT (USD BILLION) 2020-2030
TABLE 29 CHINA 3D RENDERING AND VIRTUALIZATION SOFTWARE MARKET BY DEPLOYMENT TYPE (USD BILLION) 2020-2030
TABLE 30 CHINA 3D RENDERING AND VIRTUALIZATION SOFTWARE MARKET BY PRODUCT (USD BILLION) 2020-2030
TABLE 31 JAPAN 3D RENDERING AND VIRTUALIZATION SOFTWARE MARKET BY DEPLOYMENT TYPE (USD BILLION) 2020-2030
TABLE 32 JAPAN 3D RENDERING AND VIRTUALIZATION SOFTWARE MARKET BY PRODUCT (USD BILLION) 2020-2030
TABLE 33 SOUTH KOREA 3D RENDERING AND VIRTUALIZATION SOFTWARE MARKET BY DEPLOYMENT TYPE (USD BILLION) 2020-2030
TABLE 34 SOUTH KOREA 3D RENDERING AND VIRTUALIZATION SOFTWARE MARKET BY PRODUCT (USD BILLION) 2020-2030
TABLE 35 AUSTRALIA 3D RENDERING AND VIRTUALIZATION SOFTWARE MARKET BY DEPLOYMENT TYPE (USD BILLION) 2020-2030
TABLE 36 AUSTRALIA 3D RENDERING AND VIRTUALIZATION SOFTWARE MARKET BY PRODUCT (USD BILLION) 2020-2030
TABLE 37 SOUTH-EAST ASIA 3D RENDERING AND VIRTUALIZATION SOFTWARE MARKET BY DEPLOYMENT TYPE (USD BILLION) 2020-2030
TABLE 38 SOUTH-EAST ASIA 3D RENDERING AND VIRTUALIZATION SOFTWARE MARKET BY PRODUCT (USD BILLION) 2020-2030
TABLE 39 REST OF ASIA PACIFIC 3D RENDERING AND VIRTUALIZATION SOFTWARE MARKET BY DEPLOYMENT TYPE (USD BILLION) 2020-2030
TABLE 40 REST OF ASIA PACIFIC 3D RENDERING AND VIRTUALIZATION SOFTWARE MARKET BY PRODUCT (USD BILLION) 2020-2030
TABLE 41 EUROPE 3D RENDERING AND VIRTUALIZATION SOFTWARE MARKET BY COUNTRY (USD BILLION) 2020-2030
TABLE 42 EUROPE 3D RENDERING AND VIRTUALIZATION SOFTWARE MARKET BY DEPLOYMENT TYPE (USD BILLION) 2020-2030
TABLE 43 EUROPE 3D RENDERING AND VIRTUALIZATION SOFTWARE MARKET BY PRODUCT (USD BILLION) 2020-2030
TABLE 44 GERMANY 3D RENDERING AND VIRTUALIZATION SOFTWARE MARKET BY DEPLOYMENT TYPE (USD BILLION) 2020-2030
TABLE 45 GERMANY 3D RENDERING AND VIRTUALIZATION SOFTWARE MARKET BY PRODUCT (USD BILLION) 2020-2030
TABLE 46 UK 3D RENDERING AND VIRTUALIZATION SOFTWARE MARKET BY DEPLOYMENT TYPE (USD BILLION) 2020-2030
TABLE 47 UK 3D RENDERING AND VIRTUALIZATION SOFTWARE MARKET BY PRODUCT (USD BILLION) 2020-2030
TABLE 48 FRANCE 3D RENDERING AND VIRTUALIZATION SOFTWARE MARKET BY DEPLOYMENT TYPE (USD BILLION) 2020-2030
TABLE 49 FRANCE 3D RENDERING AND VIRTUALIZATION SOFTWARE MARKET BY PRODUCT (USD BILLION) 2020-2030
TABLE 50 ITALY 3D RENDERING AND VIRTUALIZATION SOFTWARE MARKET BY DEPLOYMENT TYPE (USD BILLION) 2020-2030
TABLE 51 ITALY 3D RENDERING AND VIRTUALIZATION SOFTWARE MARKET BY PRODUCT (USD BILLION) 2020-2030
TABLE 52 SPAIN 3D RENDERING AND VIRTUALIZATION SOFTWARE MARKET BY DEPLOYMENT TYPE (USD BILLION) 2020-2030
TABLE 53 SPAIN 3D RENDERING AND VIRTUALIZATION SOFTWARE MARKET BY PRODUCT (USD BILLION) 2020-2030
TABLE 54 RUSSIA 3D RENDERING AND VIRTUALIZATION SOFTWARE MARKET BY DEPLOYMENT TYPE (USD BILLION) 2020-2030
TABLE 55 RUSSIA 3D RENDERING AND VIRTUALIZATION SOFTWARE MARKET BY PRODUCT (USD BILLION) 2020-2030
TABLE 56 REST OF EUROPE 3D RENDERING AND VIRTUALIZATION SOFTWARE MARKET BY DEPLOYMENT TYPE (USD BILLION) 2020-2030
TABLE 57 REST OF EUROPE 3D RENDERING AND VIRTUALIZATION SOFTWARE MARKET BY PRODUCT (USD BILLION) 2020-2030
TABLE 58 MIDDLE EAST AND AFRICA 3D RENDERING AND VIRTUALIZATION SOFTWARE MARKET BY COUNTRY (USD BILLION) 2020-2030
TABLE 59 MIDDLE EAST AND AFRICA 3D RENDERING AND VIRTUALIZATION SOFTWARE MARKET BY DEPLOYMENT TYPE (USD BILLION) 2020-2030
TABLE 60 MIDDLE EAST AND AFRICA 3D RENDERING AND VIRTUALIZATION SOFTWARE MARKET BY PRODUCT (USD BILLION) 2020-2030
TABLE 61 UAE 3D RENDERING AND VIRTUALIZATION SOFTWARE MARKET BY DEPLOYMENT TYPE (USD BILLION) 2020-2030
TABLE 62 UAE 3D RENDERING AND VIRTUALIZATION SOFTWARE MARKET BY PRODUCT (USD BILLION) 2020-2030
TABLE 63 SAUDI ARABIA 3D RENDERING AND VIRTUALIZATION SOFTWARE MARKET BY DEPLOYMENT TYPE (USD BILLION) 2020-2030
TABLE 64 SAUDI ARABIA 3D RENDERING AND VIRTUALIZATION SOFTWARE MARKET BY PRODUCT (USD BILLION) 2020-2030
TABLE 65 SOUTH AFRICA 3D RENDERING AND VIRTUALIZATION SOFTWARE MARKET BY DEPLOYMENT TYPE (USD BILLION) 2020-2030
TABLE 66 SOUTH AFRICA 3D RENDERING AND VIRTUALIZATION SOFTWARE MARKET BY PRODUCT (USD BILLION) 2020-2030
TABLE 67 REST OF MIDDLE EAST AND AFRICA 3D RENDERING AND VIRTUALIZATION SOFTWARE MARKET BY DEPLOYMENT TYPE (USD BILLION) 2020-2030
TABLE 68 REST OF MIDDLE EAST AND AFRICA 3D RENDERING AND VIRTUALIZATION SOFTWARE MARKET BY PRODUCT (USD BILLION) 2020-2030
LIST OF FIGURES
FIGURE 1 MARKET DYNAMICS
FIGURE 2 MARKET SEGMENTATION
FIGURE 3 REPORT TIMELINES: YEARS CONSIDERED
FIGURE 4 DATA TRIANGULATION
FIGURE 5 BOTTOM-UP APPROACH
FIGURE 6 TOP-DOWN APPROACH
FIGURE 7 RESEARCH FLOW
FIGURE 8 GLOBAL 3D RENDERING AND VIRTUALIZATION SOFTWARE MARKET BY DEPLOYMENT TYPE (USD BILLION) 2020-2030
FIGURE 9 GLOBAL 3D RENDERING AND VIRTUALIZATION SOFTWARE MARKET BY PRODUCT (USD BILLION) 2020-2030
FIGURE 11 GLOBAL 3D RENDERING AND VIRTUALIZATION SOFTWARE MARKET BY REGION (USD BILLION) 2020-2030
FIGURE 12 PORTER’S FIVE FORCES MODEL
FIGURE 13 GLOBAL 3D RENDERING AND VIRTUALIZATION SOFTWARE MARKET BY DEPLOYMENT TYPE (USD BILLION) 2021
FIGURE 14 GLOBAL 3D RENDERING AND VIRTUALIZATION SOFTWARE MARKET BY PRODUCT (USD BILLION) 2021
FIGURE 16 GLOBAL 3D RENDERING AND VIRTUALIZATION SOFTWARE MARKET BY REGION (USD BILLION) 2021
FIGURE 17 MARKET SHARE ANALYSIS
FIGURE 18 AUTODESK: COMPANY SNAPSHOT
FIGURE 19 NVIDIA CORPORATION: COMPANY SNAPSHOT
FIGURE 20 ADOBE INC.: COMPANY SNAPSHOT
FIGURE 21 DASSAULT SYSTÈMES: COMPANY SNAPSHOT
FIGURE 22 TRIMBLE INC.: COMPANY SNAPSHOT
FIGURE 23 CHAOS GROUP: COMPANY SNAPSHOT
FIGURE 24 UNITY TECHNOLOGIES: COMPANY SNAPSHOT
FIGURE 25 EPIC GAMES: COMPANY SNAPSHOT
FIGURE 26 BLENDER FOUNDATION: COMPANY SNAPSHOT
FIGURE 27 MAXON COMPUTER: COMPANY SNAPSHOT
FIGURE 28 LUXION: COMPANY SNAPSHOT
FIGURE 29 KEYSHOT: COMPANY SNAPSHOT
FIGURE 30 NEXT LIMIT TECHNOLOGIES: COMPANY SNAPSHOT
FIGURE 31 ENSCAPE: COMPANY SNAPSHOT
FIGURE 32 OTOY INC.: COMPANY SNAPSHOT
FIGURE 33 V-RAY (CHAOS GROUP): COMPANY SNAPSHOT
FIGURE 34 REDSHIFT RENDERING TECHNOLOGIES: COMPANY SNAPSHOT
FIGURE 35 FOUNDRY: COMPANY SNAPSHOT
FIGURE 36 REALLUSION INC.: COMPANY SNAPSHOT
FIGURE 37 ACT-3D B.V.: COMPANY SNAPSHOT
FAQ
The global 3D Rendering and Virtualization Software Market is anticipated to grow from USD 2.86 Billion in 2023 to USD 17.95 Billion by 2030, at a CAGR of 30 % during the forecast period.
North America accounted for the largest market in the 3D Rendering and Virtualization Software market. North America accounted for 36 % market share of the global market value.
Autodesk, NVIDIA Corporation, Adobe Inc., Dassault Systèmes, Trimble Inc., Chaos Group, Unity Technologies, Epic Games, Blender Foundation, MAXON Computer, Luxion, KeyShot, Next Limit Technologies, Enscape
Rendering software is becoming more and more integrated with AI and machine learning to improve automation, streamline workflows, and produce higher-quality rendered images. Features like automated scene optimization, noise reduction, and predictive rendering can benefit from the use of these technologies. Software for virtualization and 3D rendering has become more widely used in a variety of industries. Although it has historically been important in the gaming and entertainment industries, industries like healthcare, education, automotive design, and manufacturing are adopting it more frequently for simulation, training, and prototyping purposes.
In-Depth Database
Our Report’s database covers almost all topics of all regions over the Globe.
Recognised Publishing Sources
Tie ups with top publishers around the globe.
Customer Support
Complete pre and post sales
support.
Safe & Secure
Complete secure payment
process.
