

Base Year Value ()
x.x %
x.x %
CAGR ()
x.x %
x.x %
Forecast Year Value ()
x.x %
x.x %
Historical Data Period
Largest Region
Forecast Period
Markt für Antibeschlagbeschichtungen nach Substrat (Acryl, Glas, PET (Polyesterfolie), Polycarbonat (PC), Polyamid), Endverbraucher (Bauwesen und Konstruktion, Automobilindustrie, Luft- und Raumfahrt, Elektronik, Militär und Sicherheit, Medizin- und Sicherheitsindustrie, Sonstige) und Region (Nordamerika, Europa, Asien-Pazifik, Südamerika, Naher Osten und Afrika), globale Trends und Prognosen von 2023 bis 2029.
Instant access to hundreds of data points and trends
- Market estimates from 2014-2029
- Competitive analysis, industry segmentation, financial benchmarks
- Incorporates SWOT, Porter's Five Forces and risk management frameworks
- PDF report or online database with Word, Excel and PowerPoint export options
- 100% money back guarantee
Marktübersicht für Antibeschlagbeschichtungen
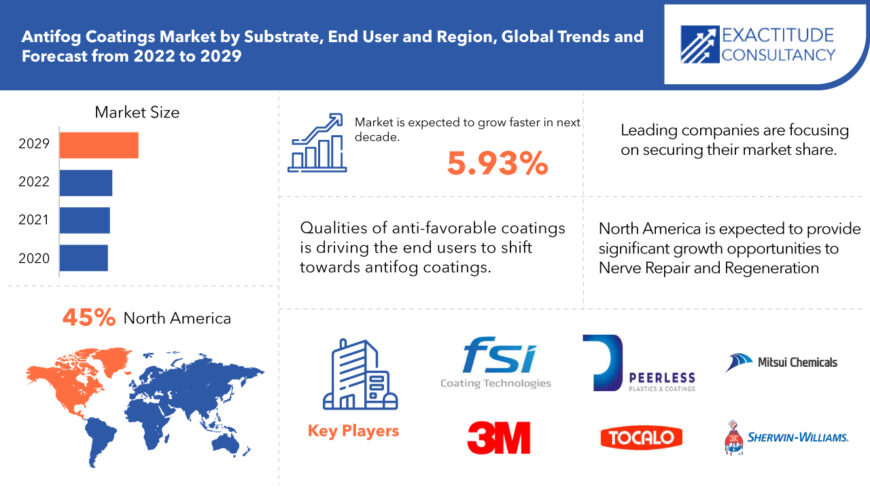
Der globale Markt für Antibeschlagbeschichtungen hat im Jahr 2022 ein Volumen von 16,20 Milliarden US-Dollar und soll bis 2029 auf 26,42 Milliarden US-Dollar wachsen, bei einer durchschnittlichen jährlichen Wachstumsrate (CAGR) von 5,93 %. Antibeschlagbeschichtungen, auch bekannt als beschlagfreie Beschichtungen , werden für Brillen sowie von außen sichtbare Messgeräte und Anzeigen benötigt. Die Vorteile eines transparenten Kunststoffprodukts mit einer Beschichtung zur Reduzierung des Beschlagens liegen bei vielen Anwendungen auf der Hand, bei denen Temperaturschwankungen und/oder hohe Luftfeuchtigkeit erforderlich sind. Sie sind stark chemikalien- und UV-beständig und haften auch in feuchten Umgebungen. Antibeschlagbeschichtungen sind in den Branchen Luft- und Raumfahrt , Bau und Konstruktion , Automobil, Elektronik, Militär und Sicherheit sowie Medizin und Schutz sehr gefragt.
Antibeschlagmittel und -behandlungen sind Substanzen, die das Beschlagen der Oberfläche, auf die sie aufgetragen werden, verhindern, indem sie die Kondensation von Wasser auf der Oberfläche verhindern.
| ATTRIBUT | DETAILS |
| Studiendauer | 2022–2029 |
| Basisjahr | 2022 |
| Geschätztes Jahr | 2023 |
| Voraussichtliches Jahr | 2023–2029 |
| Historischer Zeitraum | 2018-2022 |
| Einheit | Wert (Millionen USD) |
| Segmentierung | Nach Produkttyp, Nach Endbenutzer, Nach Region |
| Nach Substrat | |
| Durch Endbenutzer |
|
| Nach Region |
|
Nach Angaben der amerikanischen Centers for Disease Control and Prevention kommt es täglich zu 2.000 berufsbedingten Augenverletzungen, die ärztlich behandelt werden müssen, wobei über 100 davon zu einem oder mehreren Fehltagen führen. Die finanzielle Belastung ist dadurch enorm. Arbeiter in der Lebensmittelverarbeitung, die Kühlräume betreten und verlassen, können von demselben Problem betroffen sein. Bauarbeiter oder Lagerarbeiter, die sowohl drinnen als auch draußen arbeiten, sind ebenso anfällig. Antibeschlagbeschichtungen werden in der Luft- und Raumfahrt, im Bauwesen, in der Automobilindustrie, der Elektronik, im Militär und in der Sicherheit sowie in der Medizin- und Sicherheitsbranche eingesetzt, daher wird die Nachfrage nach Antibeschlagprodukten schnell wachsen.
Die Eigenschaften von Anti-Gunst-Beschichtungen haben zu einem zunehmenden Wachstum in einer Reihe von Endverbrauchssektoren geführt, darunter Automobil und Luftfahrt, optische Bildgebungsgeräte, Schutzbrillen sowie Sport und Freizeit, um nur einige zu nennen. Der Markt wird durch die steigende Nachfrage nach Schutzausrüstung in der Militär- und Medizinbranche sowie in der Automobilbeleuchtung angetrieben, um Sicherheitsvorschriften in feindlichen Umgebungen einzuhalten. Viele Länder haben ihre Verteidigungsausgaben erhöht, darunter Indien, die Vereinigten Staaten, China, Pakistan und Russland, was die Marktentwicklung unterstützt hat.
Darüber hinaus treibt die steigende Nachfrage nach Schutzausrüstung in der Militär- und Medizinbranche für raue Umgebungsbedingungen sowie die Anforderung an die Fahrzeugbeleuchtung, Sicherheitsvorschriften zu erfüllen, den Markt an. Aufgrund ihrer Fähigkeit, die Lichtstreuung zu verringern, sind solche Beschichtungen beliebt geworden. Bei extremen Wetterbedingungen können sie jedoch ungleichmäßige Merkmale aufweisen und Frost erzeugen, was während des gesamten Prognosezeitraums eine Bedrohung für die Branche darstellt.
[Bildunterschrift id="attachment_12564" align="aligncenter" width="870"]
Frequently Asked Questions
What is the worth of global Antifog Coatings market?
The Antifog Coatings market size had crossed USD 16.20 Billion in 2022.
Which is the largest regional market for Antifog Coatings market?
The Largest Regional market for Antifog Coatings market is North America having a market share of 45%.
What is the CAGR of Antifog Coatings Market?
The global Antifog Coatings market registered a CAGR of 5.93% from 2023 to 2029.
Which are the top companies to hold the market share in Antifog Coatings market?
Key players profiled in the report include are FSI Coating Technologies, 3M Company, Peerless Plastics & Coatings, TOCALO Co., Ltd, Mitsui Chemicals, ALCAT Coatings, PPG., The Sherwin-Williams Co., AkzoNobel, Nippon Paint Holdings Co., RPM International Inc., Axalta Coating Systems., BASF Coatings., Kansai Paint Co. Ltd., Others.
What is the study period in this market?
The study period for Antifog Coatings market is from 2023-2029
Antifog Coatings Market Segment Analysis
The Antifog Coatings market is segmented by Substrate and end user.
On the basis of Substrate, global Antifog Coatings market is segmented into, Acrylic, Glass, PET (Polyester Film), Polycarbonate (PC), Polyamide. Acrylic to dominate the market due to its rising demand, followed by polyamide, increasing demand for interior lighting, protective eyewear, and automotive gauges applications is driving market expansion in these areas. For these goals, anti-fog coatings are commonly employed in the production of polyamide, glass substrate, and acrylic.
On the basis of End user, global Antifog Coatings market is segmented into, Building & Construction, Automotive, Aviation & Aerospace, Electronics, Military & Security, Medical & Safety Industries, Others. By market share, the Building & Construction industry segment was the most dominating.
[caption id="attachment_12565" align="aligncenter" width="680"]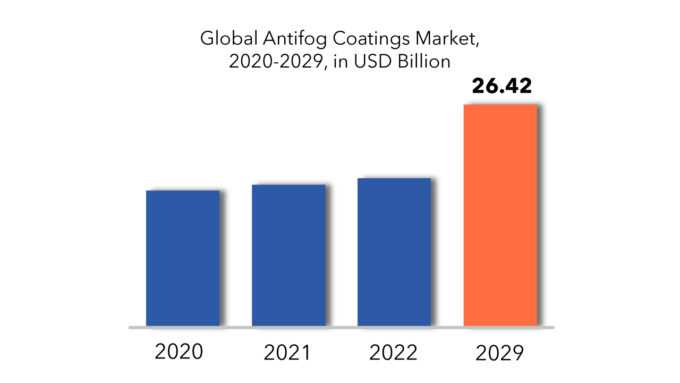
Antifog Coatings Market Players
The Key Players in Anti-fog Coatings Market are FSI Coating Technologies, 3M Company, Peerless Plastics & Coatings, TOCALO Co., Ltd, Mitsui Chemicals, ALCAT Coatings, PPG., The Sherwin-Williams Co., AkzoNobel, Nippon Paint Holdings Co., RPM International Inc., Axalta Coating Systems., BASF Coatings., Kansai Paint Co. Ltd., Others
To increase their market position, these businesses have implemented a variety of growth tactics. These companies are using expansion, new product development, mergers and acquisitions, and cooperation as important growth strategies to improve their product range and geographical presence in order to fulfil the rising demand for Antifog Coatings from emerging nations.
Who Should Buy? Or Key Stakeholders
- Industry and consulting firms
- State and national regulatory authorities
- Investors
- Suppliers and Distributors
- Research Institutes
- Others
Antifog Coatings Market Regional Analysis
Geographically, Antifog Coatings market is segmented into North America, Europe, Asia Pacific, and Rest of the world.- North America: includes the US, Canada, Mexico
- Europe: includes UK, Germany, France, Italy, Spain, Russia, and Rest of Europe
- Asia Pacific: includes China, Japan, South Korea, India, Australia, ASEAN and Rest of APAC
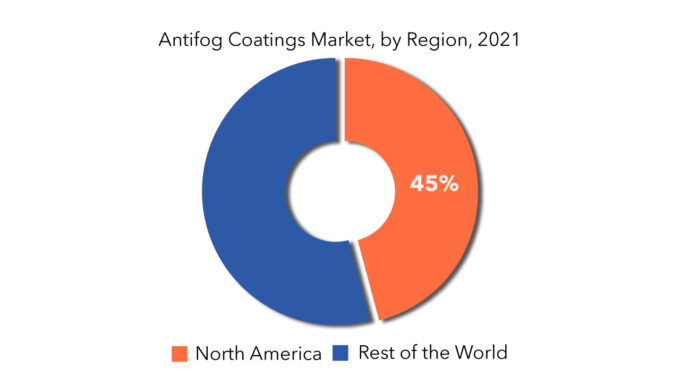
North America is the most important contributor to the growth of the Anti-fog Coatings market, with a 50% share in 2020. This is due to growing demand from the automotive and building & construction sectors. The usage of digital gadgets, protective eyewear, and apparel has expanded as the sports industry in the United States and Canada has grown. The anti-fog coatings market in Europe is being driven by rising demand for colorful sunglasses in the fashion and cosmetics industries. The anti-fog coatings market in Europe is driven by the need for colorful sunglasses in the fashion and cosmetics industries.
Asia Pacific is anticipated to rise at a rapid rate. The expanding population and consumer desire to improve aesthetics have a significant influence in Asia Pacific. Throughout the forecast period, an increase in research activities toward nano-based anti-fog coatings comprising blended PAA and PEG is projected to boost the anti-fog coatings market.
Key Market Segments: Antifog Coatings Market
Antifog Coatings Market by Substrate, 2022-2029, (USD Millions), (Thousand Units)- Acrylic
- Glass
- Pet (Polyester Film)
- Polycarbonate (Pc)
- Polyamide
- Building & Construction
- Automotive
- Aviation & Aerospace
- Electronics
- Military & Security
- Medical & Safety Industries
- Others
- North America
- Europe
- Apac
- Mea
- Latin America
[video width="1920" height="1080" mp4="https://gwsdigital.com/exactitudeconsultancy/wp-content/uploads/2023/01/Anti-fog-Coatings-Market.mp4" poster="https://gwsdigital.com/exactitudeconsultancy/wp-content/uploads/2022/02/exactitude-1-3.jpg"][/video]
Key Question Answered
- What is the current market size of this high growth market?
- What is the overall growth rate?
- What are the key growth areas, end users, end uses and types?
- Key reasons for growth
- Challenges for growth
- What technological developments are happening in this area?
- Einführung
- Marktdefinition
- Marktsegmentierung
- Forschungszeitpläne
- Annahmen und Einschränkungen
- Forschungsmethodik
- Datengewinnung
- Sekundärforschung
- Primärforschung
- Ratschläge von Fachexperten
- Qualitätskontrollen
- Abschließende Überprüfung
- Datentriangulation
- Bottom-Up-Ansatz
- Top-Down-Ansatz
- Forschungsablauf
- Datenquellen
- Datengewinnung
- Zusammenfassung
- Marktübersicht
- Globaler Marktausblick für Antifog-Beschichtungen
- Markttreiber
- Marktbeschränkungen
- Marktchancen
- Auswirkungen von Covid-19 auf den globalen Markt für Antibeschlagbeschichtungen
- Globaler Marktausblick für Antifog-Beschichtungen
- Globaler Markt für Antibeschlagbeschichtungen nach Substrat (in Mio. USD)
- Acryl
- Glas
- PET (Polyesterfolie)
- Polycarbonat (PC)
- Polyamid
- Globaler Markt für Antibeschlagbeschichtungen nach Endverbrauchsbranche (in Mio. USD)
- Bauindustrie
- Automobilindustrie
- Luft- und Raumfahrt
- Elektronik
- Militär & Sicherheit
- Medizin- und Sicherheitsbranche
- Sonstiges
- Globaler Markt für Antibeschlagbeschichtungen nach Regionen (in Mio. USD)
- Einführung
- Asien-Pazifik
- China
- Indien
- Japan
- Südkorea
- Australien
- Südostasien
- Restlicher Asien-Pazifik-Raum
- Nordamerika
- Vereinigte Staaten
- Kanada
- Mexiko
- Europa
- Deutschland
- Vereinigtes Königreich
- Frankreich
- Italien
- Spanien
- Russland
- Restliches Europa
- Südamerika
- Brasilien
- Argentinien
- Kolumbien
- Restliches Südamerika
- Naher Osten und Afrika
- Vereinigte Arabische Emirate
- Saudi-Arabien
- Südafrika
- Restlicher Naher Osten und Afrika
- Firmenprofile* (Geschäftsübersicht, Firmenporträt, angebotene Produkte, aktuelle Entwicklungen)
- FSI Beschichtungstechnologien
- 3M Unternehmen
- Unvergleichliche Kunststoffe und Beschichtungen
- TOCALO Co.
- Mitsui-Chemikalien
- ALCAT-Beschichtungen
- Die Sherwin-Williams Co.
- AkzoNobel, Nippon Paint Holdings Co.
*Die Firmenliste ist indikativ
TABELLENLISTE
TABLE 1 GLOBAL ANTIFOG COATINGS MARKET BY SUBSTRATE (USD MILLIONS), 2020-2029
TABLE 2 GLOBAL ANTIFOG COATINGS MARKET BY SUBSTRATE (THOUSAND UNITS), 2020-2029
TABLE 3 GLOBAL ANTIFOG COATINGS MARKET BY END USE INDUSTRY (USD MILLIONS), 2020-2029
TABLE 4 GLOBAL ANTIFOG COATINGS MARKET BY END USE INDUSTRY (THOUSAND UNITS), 2020-2029
TABLE 5 GLOBAL ANTIFOG COATINGS MARKET BY REGION (USD MILLIONS), 2020-2029
TABLE 6 GLOBAL ANTIFOG COATINGS MARKET BY REGION (THOUSAND UNITS), 2020-2029
TABLE 7 NORTH AMERICA ANTIFOG COATINGS MARKET BY COUNTRY (USD MILLIONS), 2020-2029
TABLE 8 NORTH AMERICA ANTIFOG COATINGS MARKET BY COUNTRY (THOUSAND UNITS), 2020-2029
TABLE 9 US ANTIFOG COATINGS MARKET BY SUBSTRATE (USD MILLIONS), 2020-2029
TABLE 10 US ANTIFOG COATINGS MARKET BY SUBSTRATE (THOUSAND UNITS), 2020-2029
TABLE 11 US ANTIFOG COATINGS MARKET BY END USE INDUSTRY (USD MILLIONS), 2020-2029
TABLE 12 US ANTIFOG COATINGS MARKET BY END USE INDUSTRY (THOUSAND UNITS), 2020-2029
TABLE 13 Canada ANTIFOG COATINGS MARKET BY SUBSTRATE (USD MILLIONS), 2020-2029
TABLE 14 Canada ANTIFOG COATINGS MARKET BY SUBSTRATE (THOUSAND UNITS), 2020-2029
TABLE 15 Canada ANTIFOG COATINGS MARKET BY END USE INDUSTRY (USD MILLIONS), 2020-2029
TABLE 16 Canada ANTIFOG COATINGS MARKET BY END USE INDUSTRY (THOUSAND UNITS), 2020-2029
TABLE 17 MEXICO ANTIFOG COATINGS MARKET BY SUBSTRATE (USD MILLIONS), 2020-2029
TABLE 18 MEXICO ANTIFOG COATINGS MARKET BY SUBSTRATE (THOUSAND UNITS), 2020-2029
TABLE 19 MEXICO ANTIFOG COATINGS MARKET BY END USE INDUSTRY (USD MILLIONS), 2020-2029
TABLE 20 MEXICO ANTIFOG COATINGS MARKET BY END USE INDUSTRY (THOUSAND UNITS), 2020-2029
TABLE 21 SOUTH AMERICA ANTIFOG COATINGS MARKET BY COUNTRY (USD MILLIONS), 2020-2029
TABLE 22 SOUTH AMERICA ANTIFOG COATINGS MARKET BY COUNTRY (THOUSAND UNITS), 2020-2029
TABLE 23 BRAZIL ANTIFOG COATINGS MARKET BY SUBSTRATE (USD MILLIONS), 2020-2029
TABLE 24 BRAZIL ANTIFOG COATINGS MARKET BY SUBSTRATE (THOUSAND UNITS), 2020-2029
TABLE 25 BRAZIL ANTIFOG COATINGS MARKET BY END USE INDUSTRY (USD MILLIONS), 2020-2029
TABLE 26 BRAZIL ANTIFOG COATINGS MARKET BY END USE INDUSTRY (THOUSAND UNITS), 2020-2029
TABLE 27 ARGENTINA ANTIFOG COATINGS MARKET BY SUBSTRATE (USD MILLIONS), 2020-2029
TABLE 28 ARGENTINA ANTIFOG COATINGS MARKET BY SUBSTRATE (THOUSAND UNITS), 2020-2029
TABLE 29 ARGENTINA ANTIFOG COATINGS MARKET BY END USE INDUSTRY (USD MILLIONS), 2020-2029
TABLE 30 ARGENTINA ANTIFOG COATINGS MARKET BY END USE INDUSTRY (THOUSAND UNITS), 2020-2029
TABLE 31 COLOMBIA ANTIFOG COATINGS MARKET BY SUBSTRATE (USD MILLIONS), 2020-2029
TABLE 32 COLOMBIA ANTIFOG COATINGS MARKET BY SUBSTRATE (THOUSAND UNITS), 2020-2029
TABLE 33 COLOMBIA ANTIFOG COATINGS MARKET BY END USE INDUSTRY (USD MILLIONS), 2020-2029
TABLE 34 COLOMBIA ANTIFOG COATINGS MARKET BY END USE INDUSTRY (THOUSAND UNITS), 2020-2029
TABLE 35 REST OF SOUTH AMERICA ANTIFOG COATINGS MARKET BY SUBSTRATE (USD MILLIONS), 2020-2029
TABLE 36 REST OF SOUTH AMERICA ANTIFOG COATINGS MARKET BY SUBSTRATE (THOUSAND UNITS), 2020-2029
TABLE 37 REST OF SOUTH AMERICA ANTIFOG COATINGS MARKET BY END USE INDUSTRY (USD MILLIONS), 2020-2029
TABLE 38 REST OF SOUTH AMERICA ANTIFOG COATINGS MARKET BY END USE INDUSTRY (THOUSAND UNITS), 2020-2029
TABLE 39 ASIA-PACIFIC ANTIFOG COATINGS MARKET BY COUNTRY (USD MILLIONS), 2020-2029
TABLE 40 ASIA-PACIFIC ANTIFOG COATINGS MARKET BY COUNTRY (THOUSAND UNITS), 2020-2029
TABLE 41 INDIA ANTIFOG COATINGS MARKET BY SUBSTRATE (USD MILLIONS), 2020-2029
TABLE 42 INDIA ANTIFOG COATINGS MARKET BY SUBSTRATE (THOUSAND UNITS), 2020-2029
TABLE 43 INDIA ANTIFOG COATINGS MARKET BY END USE INDUSTRY (USD MILLIONS), 2020-2029
TABLE 44 INDIA ANTIFOG COATINGS MARKET BY END USE INDUSTRY (THOUSAND UNITS), 2020-2029
TABLE 45 CHINA ANTIFOG COATINGS MARKET BY SUBSTRATE (USD MILLIONS), 2020-2029
TABLE 46 CHINA ANTIFOG COATINGS MARKET BY SUBSTRATE (THOUSAND UNITS), 2020-2029
TABLE 47 CHINA ANTIFOG COATINGS MARKET BY END USE INDUSTRY (USD MILLIONS), 2020-2029
TABLE 48 CHINA ANTIFOG COATINGS MARKET BY END USE INDUSTRY (THOUSAND UNITS), 2020-2029
TABLE 49 JAPAN ANTIFOG COATINGS MARKET BY SUBSTRATE (USD MILLIONS), 2020-2029
TABLE 50 JAPAN ANTIFOG COATINGS MARKET BY SUBSTRATE (THOUSAND UNITS), 2020-2029
TABLE 51 JAPAN ANTIFOG COATINGS MARKET BY END USE INDUSTRY (USD MILLIONS), 2020-2029
TABLE 52 JAPAN ANTIFOG COATINGS MARKET BY END USE INDUSTRY (THOUSAND UNITS), 2020-2029
TABLE 53 SOUTH KOREA ANTIFOG COATINGS MARKET BY SUBSTRATE (USD MILLIONS), 2020-2029
TABLE 54 SOUTH KOREA ANTIFOG COATINGS MARKET BY SUBSTRATE (THOUSAND UNITS), 2020-2029
TABLE 55 SOUTH KOREA ANTIFOG COATINGS MARKET BY END USE INDUSTRY (USD MILLIONS), 2020-2029
TABLE 56 SOUTH KOREA ANTIFOG COATINGS MARKET BY END USE INDUSTRY (THOUSAND UNITS), 2020-2029
TABLE 57 AUSTRALIA ANTIFOG COATINGS MARKET BY SUBSTRATE (USD MILLIONS), 2020-2029
TABLE 58 AUSTRALIA ANTIFOG COATINGS MARKET BY SUBSTRATE (THOUSAND UNITS), 2020-2029
TABLE 59 AUSTRALIA ANTIFOG COATINGS MARKET BY END USE INDUSTRY (USD MILLIONS), 2020-2029
TABLE 60 AUSTRALIA ANTIFOG COATINGS MARKET BY END USE INDUSTRY (THOUSAND UNITS), 2020-2029
TABLE 61 SOUTH EAST ASIA ANTIFOG COATINGS MARKET BY SUBSTRATE (USD MILLIONS), 2020-2029
TABLE 62 SOUTH EAST ASIA ANTIFOG COATINGS MARKET BY SUBSTRATE (THOUSAND UNITS), 2020-2029
TABLE 63 SOUTH EAST ASIA ANTIFOG COATINGS MARKET BY END USE INDUSTRY (USD MILLIONS), 2020-2029
TABLE 64 SOUTH EAST ASIA ANTIFOG COATINGS MARKET BY END USE INDUSTRY (THOUSAND UNITS), 2020-2029
TABLE 65 REST OF ASIA PACIFIC ANTIFOG COATINGS MARKET BY SUBSTRATE (USD MILLIONS), 2020-2029
TABLE 66 REST OF ASIA PACIFIC ANTIFOG COATINGS MARKET BY SUBSTRATE (THOUSAND UNITS), 2020-2029
TABLE 67 REST OF ASIA PACIFIC ANTIFOG COATINGS MARKET BY END USE INDUSTRY (USD MILLIONS), 2020-2029
TABLE 68 REST OF ASIA PACIFIC ANTIFOG COATINGS MARKET BY END USE INDUSTRY (THOUSAND UNITS), 2020-2029
TABLE 69 EUROPE ANTIFOG COATINGS MARKET BY COUNTRY (USD MILLIONS), 2020-2029
TABLE 70 EUROPE ANTIFOG COATINGS MARKET BY COUNTRY (THOUSAND UNITS), 2020-2029
TABLE 71 GERMANY ANTIFOG COATINGS MARKET BY SUBSTRATE (USD MILLIONS), 2020-2029
TABLE 72 GERMANY ANTIFOG COATINGS MARKET BY SUBSTRATE (THOUSAND UNITS), 2020-2029
TABLE 73 GERMANY ANTIFOG COATINGS MARKET BY END USE INDUSTRY (USD MILLIONS), 2020-2029
TABLE 74 GERMANY ANTIFOG COATINGS MARKET BY END USE INDUSTRY (THOUSAND UNITS), 2020-2029
TABLE 75 UK ANTIFOG COATINGS MARKET BY SUBSTRATE (USD MILLIONS), 2020-2029
TABLE 76 UK ANTIFOG COATINGS MARKET BY SUBSTRATE (THOUSAND UNITS), 2020-2029
TABLE 77 UK ANTIFOG COATINGS MARKET BY END USE INDUSTRY (USD MILLIONS), 2020-2029
TABLE 78 UK ANTIFOG COATINGS MARKET BY END USE INDUSTRY (THOUSAND UNITS), 2020-2029
TABLE 79 FRANCE ANTIFOG COATINGS MARKET BY SUBSTRATE (USD MILLIONS), 2020-2029
TABLE 80 FRANCE ANTIFOG COATINGS MARKET BY SUBSTRATE (THOUSAND UNITS), 2020-2029
TABLE 81 FRANCE ANTIFOG COATINGS MARKET BY END USE INDUSTRY (USD MILLIONS), 2020-2029
TABLE 82 FRANCE ANTIFOG COATINGS MARKET BY END USE INDUSTRY (THOUSAND UNITS), 2020-2029
TABLE 83 ITALY ANTIFOG COATINGS MARKET BY SUBSTRATE (USD MILLIONS), 2020-2029
TABLE 84 ITALY ANTIFOG COATINGS MARKET BY SUBSTRATE (THOUSAND UNITS), 2020-2029
TABLE 85 ITALY ANTIFOG COATINGS MARKET BY END USE INDUSTRY (USD MILLIONS), 2020-2029
TABLE 86 ITALY ANTIFOG COATINGS MARKET BY END USE INDUSTRY (THOUSAND UNITS), 2020-2029
TABLE 87 SPAIN ANTIFOG COATINGS MARKET BY SUBSTRATE (USD MILLIONS), 2020-2029
TABLE 88 SPAIN ANTIFOG COATINGS MARKET BY SUBSTRATE (THOUSAND UNITS), 2020-2029
TABLE 89 SPAIN ANTIFOG COATINGS MARKET BY END USE INDUSTRY (USD MILLIONS), 2020-2029
TABLE 90 SPAIN ANTIFOG COATINGS MARKET BY END USE INDUSTRY (THOUSAND UNITS), 2020-2029
TABLE 91 RUSSIA ANTIFOG COATINGS MARKET BY SUBSTRATE (USD MILLIONS), 2020-2029
TABLE 92 RUSSIA ANTIFOG COATINGS MARKET BY SUBSTRATE (THOUSAND UNITS), 2020-2029
TABLE 93 RUSSIA ANTIFOG COATINGS MARKET BY END USE INDUSTRY (USD MILLIONS), 2020-2029
TABLE 94 RUSSIA ANTIFOG COATINGS MARKET BY END USE INDUSTRY (THOUSAND UNITS), 2020-2029
TABLE 95 REST OF EUROPE ANTIFOG COATINGS MARKET BY SUBSTRATE (USD MILLIONS), 2020-2029
TABLE 96 REST OF EUROPE ANTIFOG COATINGS MARKET BY SUBSTRATE (THOUSAND UNITS), 2020-2029
TABLE 97 REST OF EUROPE ANTIFOG COATINGS MARKET BY END USE INDUSTRY (USD MILLIONS), 2020-2029
TABLE 98 REST OF EUROPE ANTIFOG COATINGS MARKET BY END USE INDUSTRY (THOUSAND UNITS), 2020-2029
TABLE 99 MIDDLE EAST AND AFRICA ANTIFOG COATINGS MARKET BY COUNTRY (USD MILLIONS), 2020-2029
TABLE 100 MIDDLE EAST AND AFRICA ANTIFOG COATINGS MARKET BY COUNTRY (THOUSAND UNITS), 2020-2029
TABLE 101 UAE ANTIFOG COATINGS MARKET BY SUBSTRATE (USD MILLIONS), 2020-2029
TABLE 102 UAE ANTIFOG COATINGS MARKET BY SUBSTRATE (THOUSAND UNITS), 2020-2029
TABLE 103 UAE ANTIFOG COATINGS MARKET BY END USE INDUSTRY (USD MILLIONS), 2020-2029
TABLE 104 UAE ANTIFOG COATINGS MARKET BY END USE INDUSTRY (THOUSAND UNITS), 2020-2029
TABLE 105 SAUDI ARABIA ANTIFOG COATINGS MARKET BY SUBSTRATE (USD MILLIONS), 2020-2029
TABLE 106 SAUDI ARABIA ANTIFOG COATINGS MARKET BY SUBSTRATE (THOUSAND UNITS), 2020-2029
TABLE 107 SAUDI ARABIA ANTIFOG COATINGS MARKET BY END USE INDUSTRY (USD MILLIONS), 2020-2029
TABLE 108 SAUDI ARABIA ANTIFOG COATINGS MARKET BY END USE INDUSTRY (THOUSAND UNITS), 2020-2029
TABLE 109 SOUTH AFRICA ANTIFOG COATINGS MARKET BY SUBSTRATE (USD MILLIONS), 2020-2029
TABLE 110 SOUTH AFRICA ANTIFOG COATINGS MARKET BY SUBSTRATE (THOUSAND UNITS), 2020-2029
TABLE 111 SOUTH AFRICA ANTIFOG COATINGS MARKET BY END USE INDUSTRY (USD MILLIONS), 2020-2029
TABLE 112 SOUTH AFRICA ANTIFOG COATINGS MARKET BY END USE INDUSTRY (THOUSAND UNITS), 2020-2029
TABLE 113 REST OF MIDDLE EAST AND AFRICA ANTIFOG COATINGS MARKET BY SUBSTRATE (USD MILLIONS), 2020-2029
TABLE 114 REST OF MIDDLE EAST AND AFRICA ANTIFOG COATINGS MARKET BY SUBSTRATE (THOUSAND UNITS), 2020-2029
TABLE 115 REST OF MIDDLE EAST AND AFRICA ANTIFOG COATINGS MARKET BY END USE INDUSTRY (USD MILLIONS), 2020-2029
TABLE 116 REST OF MIDDLE EAST AND AFRICA ANTIFOG COATINGS MARKET BY END USE INDUSTRY (THOUSAND UNITS), 2020-2029
LIST OF FIGURES
FIGURE 1 MARKET DYNAMICS
FIGURE 2 MARKET SEGMENTATION
FIGURE 3 REPORT TIMELINES: YEARS CONSIDERED
FIGURE 4 DATA TRIANGULATION
FIGURE 5 BOTTOM-UP APPROACH
FIGURE 6 TOP-DOWN APPROACH
FIGURE 7 RESEARCH FLOW
FIGURE 8 GLOBAL ANTIFOG COATINGS MARKET BY SUBSTRATE, USD MILLION, 2020-2029
FIGURE 9 GLOBAL ANTIFOG COATINGS MARKET BY END USE INDUSTRY, USD MILLION, 2020-2029
FIGURE 10 GLOBAL ANTIFOG COATINGS MARKET BY REGION, USD MILLION, 2020-2029
FIGURE 11 PORTER’S FIVE FORCES MODEL
FIGURE 12 GLOBAL ANTIFOG COATINGS MARKET BY SUBSTRATE, USD MILLION, 2020-2029
FIGURE 13 GLOBAL ANTIFOG COATINGS MARKET BY END USE INDUSTRY, USD MILLION, 2020-2029
FIGURE 14 GLOBAL ANTIFOG COATINGS MARKET BY REGION, USD MILLION, 2020-2029
FIGURE 15 ANTIFOG COATINGS MARKET BY REGION 2020
FIGURE 16 MARKET SHARE ANALYSIS
FIGURE 17 FSI COATING TECHNOLOGIES COMPANY SNAPSHOT
FIGURE 18 3M COMPANY SNAPSHOT
FIGURE 19 PEERLESS PLASTICS & COATINGS COMPANY SNAPSHOT
FIGURE 20 TOCALO CO. COMPANY SNAPSHOT
FIGURE 21 MITSUI CHEMICALS COMPANY SNAPSHOT
FIGURE 22 ALCAT COATINGS COMPANY SNAPSHOT
FIGURE 23 PPG. COMPANY SNAPSHOT
FIGURE 24 THE SHERWIN-WILLIAMS CO. COMPANY SNAPSHOT
FIGURE 25 AKZONOBEL, NIPPON PAINT HOLDINGS CO. COMPANY SNAPSHOT
DOWNLOAD FREE SAMPLE REPORT
License Type
SPEAK WITH OUR ANALYST
Want to know more about the report or any specific requirement?
WANT TO CUSTOMIZE THE REPORT?
Our Clients Speak
We asked them to research ‘ Equipment market’ all over the world, and their whole arrangement was helpful to us. thehealthanalytics.com insightful analysis and reports contributed to our current analysis and in creating a future strategy. Besides, the te
Yosuke Mitsui
Senior Associate Construction Equipment Sales & Marketing
We asked them to research ‘Equipment market’ all over the world, and their whole arrangement was helpful to us. thehealthanalytics.com insightful analysis and reports contributed to our current analysis and in creating a future strategy. Besides, the te


