

Base Year Value ()
x.x %
x.x %
CAGR ()
x.x %
x.x %
Forecast Year Value ()
x.x %
x.x %
Historical Data Period
Largest Region
Forecast Period
Der Markt für Verbundwerkstoffreparaturen ist nach Typ (strukturell, halbstrukturell, kosmetisch), Verfahren (Handlaminieren, Vakuuminfusion, Autoklav, andere), Endbenutzer (Luft- und Raumfahrt und Verteidigung, Windenergie, Automobil und Transport, Schifffahrt, Bau, Rohr und Tank, andere) und Region, globalen Trends und Prognosen von 2022 bis 2029 segmentiert.
Instant access to hundreds of data points and trends
- Market estimates from 2014-2029
- Competitive analysis, industry segmentation, financial benchmarks
- Incorporates SWOT, Porter's Five Forces and risk management frameworks
- PDF report or online database with Word, Excel and PowerPoint export options
- 100% money back guarantee
Marktübersicht für Verbundwerkstoffreparaturen
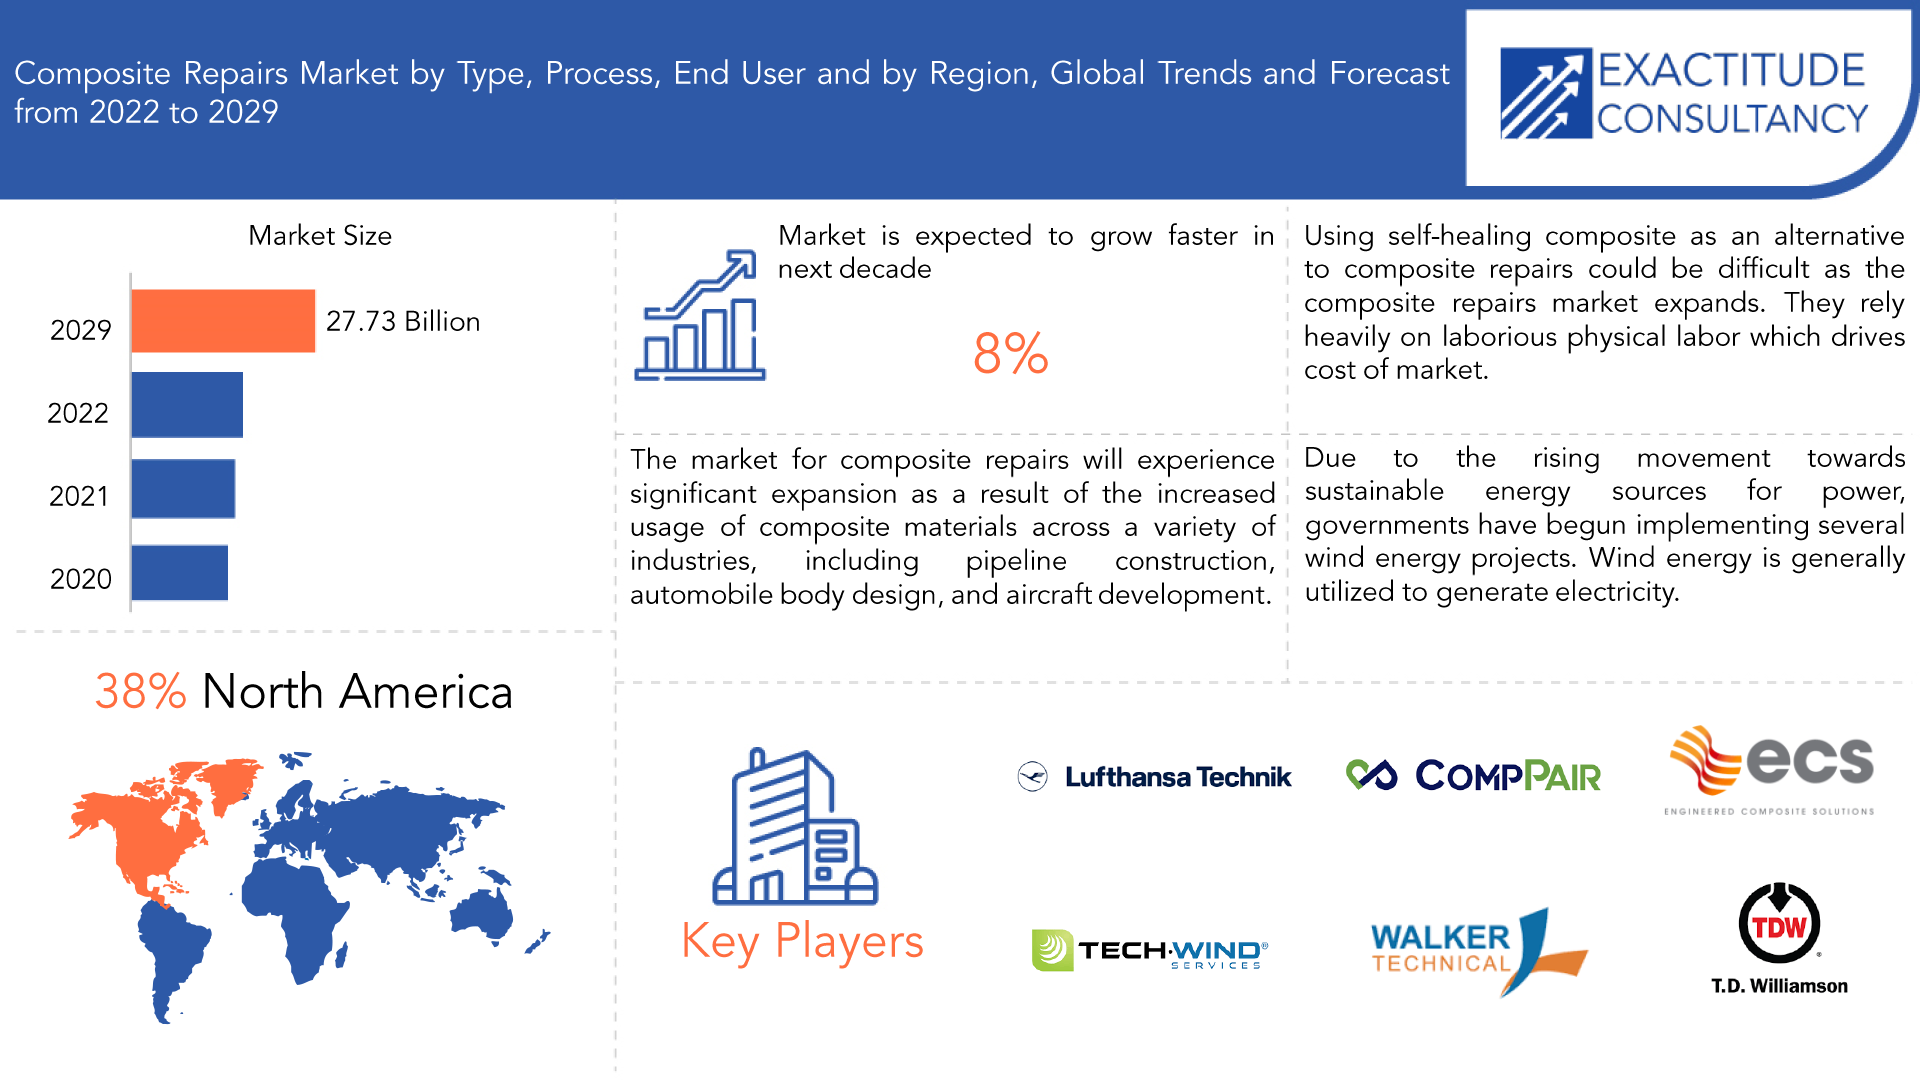
Der Markt für Verbundwerkstoffreparaturen wird voraussichtlich von 2022 bis 2029 um durchschnittlich 8 % jährlich wachsen. Im Jahr 2020 hatte er einen Wert von 13,87 Milliarden USD. Bis 2029 wird ein Wert von über 27,73 Milliarden USD erwartet.
Der Markt für Verbundwerkstoffreparaturen wird aufgrund der zunehmenden Verwendung von Verbundwerkstoffen in einer Vielzahl von Branchen, darunter Rohrleitungsbau, Karosseriedesign und Flugzeugentwicklung , ein erhebliches Wachstum erfahren . Branchen wie die Automobil-, Schifffahrts- und Luftfahrtindustrie streben nach Komponentendesigns und -verbesserungen, die das endgültige Ladegewicht des gesamten Systems reduzieren und so zur Kraftstoffeffizienz beitragen können. Die Maßnahmen dieser Branche stimulieren die Nachfrage nach Verbundwerkstoffen und damit den Markt für Verbundwerkstoffreparaturen.
Um beschädigte Dünnschichtkomponenten zu reparieren und die Ausbreitung der Risse zu verhindern, wenden Systemingenieure ein Verfahren namens Verbundreparatur an. Prozessrohrleitungen, Wärmetauscher, Schläuche, Lagertanks und andere Druckbehälter können alle vorübergehend mithilfe der Verbundreparatur repariert werden. Die Verwendung der Verbundreparatur dient als Alternative zu herkömmlichen Wartungsverfahren. Der Prozess oder die Ausrüstung wird verwendet, ohne vollständig abgeschaltet zu werden. Für den Einsatz in verschiedenen Umgebungen und zur Reparatur verschiedener Materialtypen sind viele Arten von Verbundwerkstoffen verfügbar. Ultraschall, Radiographie, Holographie, Thermographie und andere Inspektionstechniken werden verwendet, um Verbundreparaturen zu überprüfen. Die Durchführung einer erfolgreichen Verbundreparatur bringt viele technologische Schwierigkeiten mit sich.
| ATTRIBUT | DETAILS |
| Studiendauer | 2020–2029 |
| Basisjahr | 2021 |
| Geschätztes Jahr | 2022 |
| Voraussichtliches Jahr | 2022–2029 |
| Historischer Zeitraum | 2018-2020 |
| Einheit | Wert (Milliarden USD, Kilotonnen) |
| Segmentierung | Nach Typ, nach Prozess, nach Endbenutzer |
| Nach Typ |
|
| Nach Prozess |
|
| Nach Endbenutzer |
|
| Nach Region |
|
Die deutliche Expansion des Marktes für Verbundwerkstoffreparaturen wird durch die zunehmende Verwendung von Verbundwerkstoffen in einer Vielzahl von Branchen, darunter Rohrleitungsbau, Karosseriedesign und Flugzeugentwicklung, verursacht. Branchen wie die Automobil-, Schifffahrts- und Luftfahrtindustrie streben nach Komponentendesigns und -verbesserungen, die das Gesamtgewicht des Systems reduzieren und so den Kraftstoffverbrauch senken können. Die Maßnahmen dieser Branchen steigern die Nachfrage nach Verbundwerkstoffen und damit den Markt für Verbundwerkstoffreparaturen.
Der Haupttrend, der die Expansion dieses Marktes vorantreibt, wird sein, dass die Verbundwerkstoffreparatur im Öl- und Gassektor zu einer praktikablen und bevorzugten Alternative zur Metallreparatur wird. Aufgrund der zahlreichen Vorteile, die sie bietet, ist die Verbundwerkstoffreparatur ein wesentliches und wichtiges Wartungsverfahren, das in der zivilen Infrastruktur, im Bergbau, in der Luft- und Raumfahrt, im Automobilbau und in der Schifffahrtsindustrie eingesetzt wird . Dieses Verfahren, eine der kostengünstigsten Reparaturoptionen zum Beheben von Rissen in relativ dünnhäutigen Bauteilen, wird den Markt wachsen lassen. Das Wachstum dieses Marktes wird durch die strengen Prozesskontrollen, die für die erfolgreiche Anwendung der Verbundwerkstoffreparatur erforderlich sind, erheblich behindert.
[Bildunterschrift id="attachment_16456" align="aligncenter" width="1920"]
Frequently Asked Questions
• What is the worth of composite repairs market?
Composite Repairs market is expected to grow at 8% CAGR from 2022 to 2029. it is expected to reach above USD 27.73 billion by 2029
• What is the size of the North America in composite repairs industry?
North America held more than 38% of composite repairs market revenue share in 2021 and will witness expansion in the forecast period.
• What are some of the market's driving forces?
The market for composite repairs will experience significant expansion as a result of the increased usage of composite materials across a variety of industries, including pipeline construction, automobile body design, and aircraft development. Industries including automotive, maritime, and aeronautical are aiming for component designs and advancements that can reduce the final loaded weight of the complete system and hence contribute to fuel efficiency. This industry's action is stimulating demand for composite materials and, therefore, the composite repairs market.
• Which are the top companies to hold the market share in composite repairs market?
Lufthansa Technik AG, Air France KLM E&M, CompPair Technologies, Engineered Composite Solution, Total Wind Group A/S, Technical Wind Services, Citadel Technologies, Milliken Infrastructure, T.D. Williamson Inc., Walker Technical Resource Limited.
• What is the leading component segment of composite repairs market?
The end-use category for composite repairs that is expected to increase at the quickest rate throughout the forecast period is aerospace & defense. A significant demand for composite repairs is being driven by the growing use of composites in next-generation aircraft like the B787 and A350XWB. The Commercial Aircraft Composite Repair Committee (CACRC), based in the USA, has established a number of criteria for composite repairs to guarantee quality and safety for airlines. Over the next five years, the composite repairs market is anticipated to grow strongly in the sectors of wind energy, transportation, marine, and building & construction.
Composite Repairs Market Segment Analysis
Composite repairs market is segmented based on type, process, end user and region.
By type the market is segmented into structural, semi-structural, cosmetic. The major part type is anticipated to continue to be composite repairs for structural components during the forecasted period. The increased use of advanced composites in structural applications in the aerospace & military and automotive industries is expected to propel this category to experience the maximum growth during the same time period.
By process the market is segmented into hand lay-up, vacuum infusion, autoclave, others. In the majority of industries, including aerospace & military, automotive, and building & construction, prepreg lay-up is frequently used for composite part repairs. Throughout the forecast period, it is anticipated that the process type will continue to grow at the fastest rate. The need for enhanced manufacturing processes for both part fabrication and repairs are being driven by the growing use of composites across several industries.
By end user the market is segmented into aerospace & defense, wind energy, automotive & transportation, marine, construction, pipe & tank, and others. The end-use category for composite repairs that is expected to increase at the quickest rate throughout the forecast period is aerospace & defense. A significant demand for composite repairs is being driven by the growing use of composites in next-generation aircraft like the B787 and A350XWB. The Commercial Aircraft Composite Repair Committee (CACRC), based in the USA, has established a number of criteria for composite repairs to guarantee quality and safety for airlines. Over the next five years, the composite repairs market is anticipated to grow strongly in the sectors of wind energy, transportation, marine, and building & construction.
[caption id="attachment_16457" align="aligncenter" width="1920"]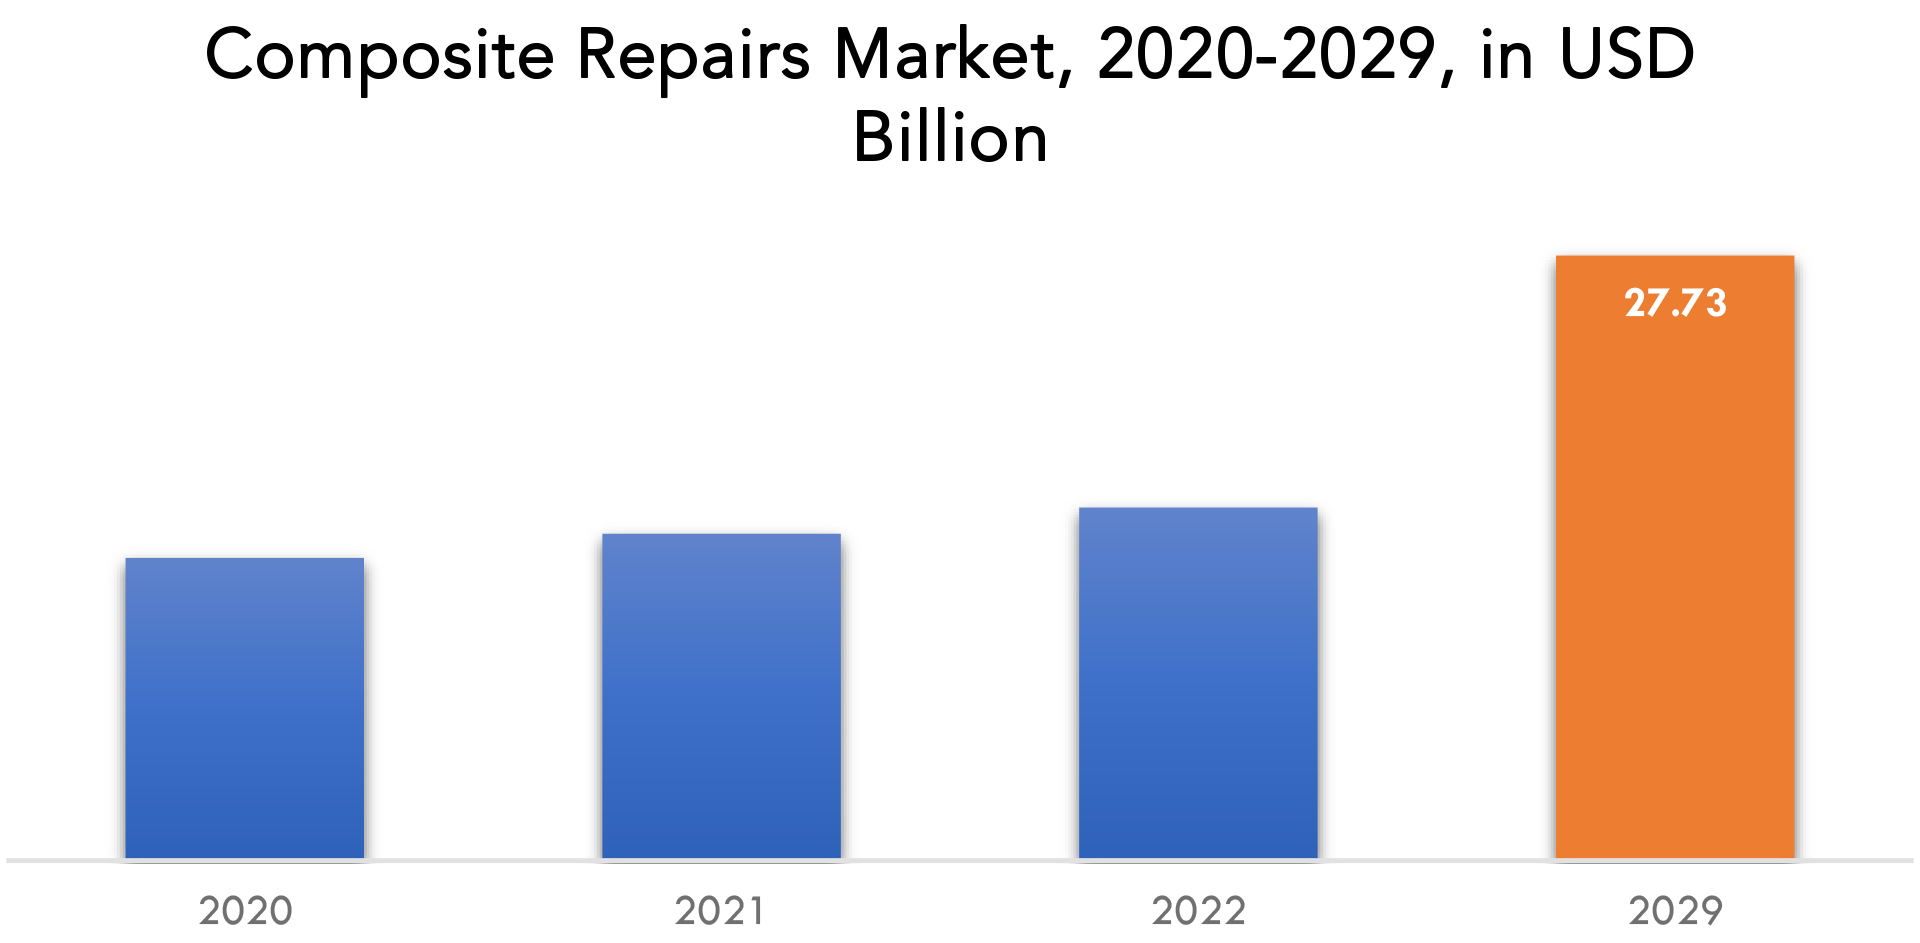
Composite Repairs Market Key Players
Composite repairs market key players include Lufthansa Technik AG, Air France KLM E&M, CompPair Technologies, Engineered Composite Solution, Total Wind Group A/S, Technical Wind Services, Citadel Technologies, Milliken Infrastructure, T.D. Williamson Inc., Walker Technical Resource Limited.
Industry Development:- February 8, 2023: Lufthansa Technik and Colombian carrier Avianca signed a five-year contract which will provide digital Condition Monitoring through the AVIATAR platform. With the new contract, Avianca will be able to receive instant and real-time information about the configuration and condition of its Airbus A320 and A330 aircraft as well as their engines and components – during flight and on ground, all consolidated in one place.
- May 06, 2021: AFI KLM E&M offered its services for the maintenance of the A220 fleet. The MRO arm of Air France-KLM has designed a comprehensive equipment support program for the aircraft and is able to market a complete nose-to-tail component support for A220 operators.
Who Should Buy? Or Key stakeholders
- Pharmaceutical companies
- Raw Material Suppliers
- Composite Material Distributors
- Composite Material Suppliers
- Composite Part Manufacturers
- Composite Repair Service Providers
- End Users
- Government & Regional Agencies
- Research Organizations
- Investment Research Firms Investors
- Others
Composite Repairs Market Regional Analysis
Composite Repairs Market by region includes North America, Asia-Pacific (APAC), Europe, South America, and Middle East & Africa (MEA).
- North America: includes the US, Canada, Mexico
- Asia Pacific: includes China, Japan, South Korea, India, Australia, ASEAN and Rest of APAC
- Europe: includes UK, Germany, France, Italy, Spain, Russia, and Rest of Europe
- South America: includes Brazil, Argentina and Rest of South America
- Middle East & Africa: includes Turkey, UAE, Saudi Arabia, South Africa, and Rest of MEA
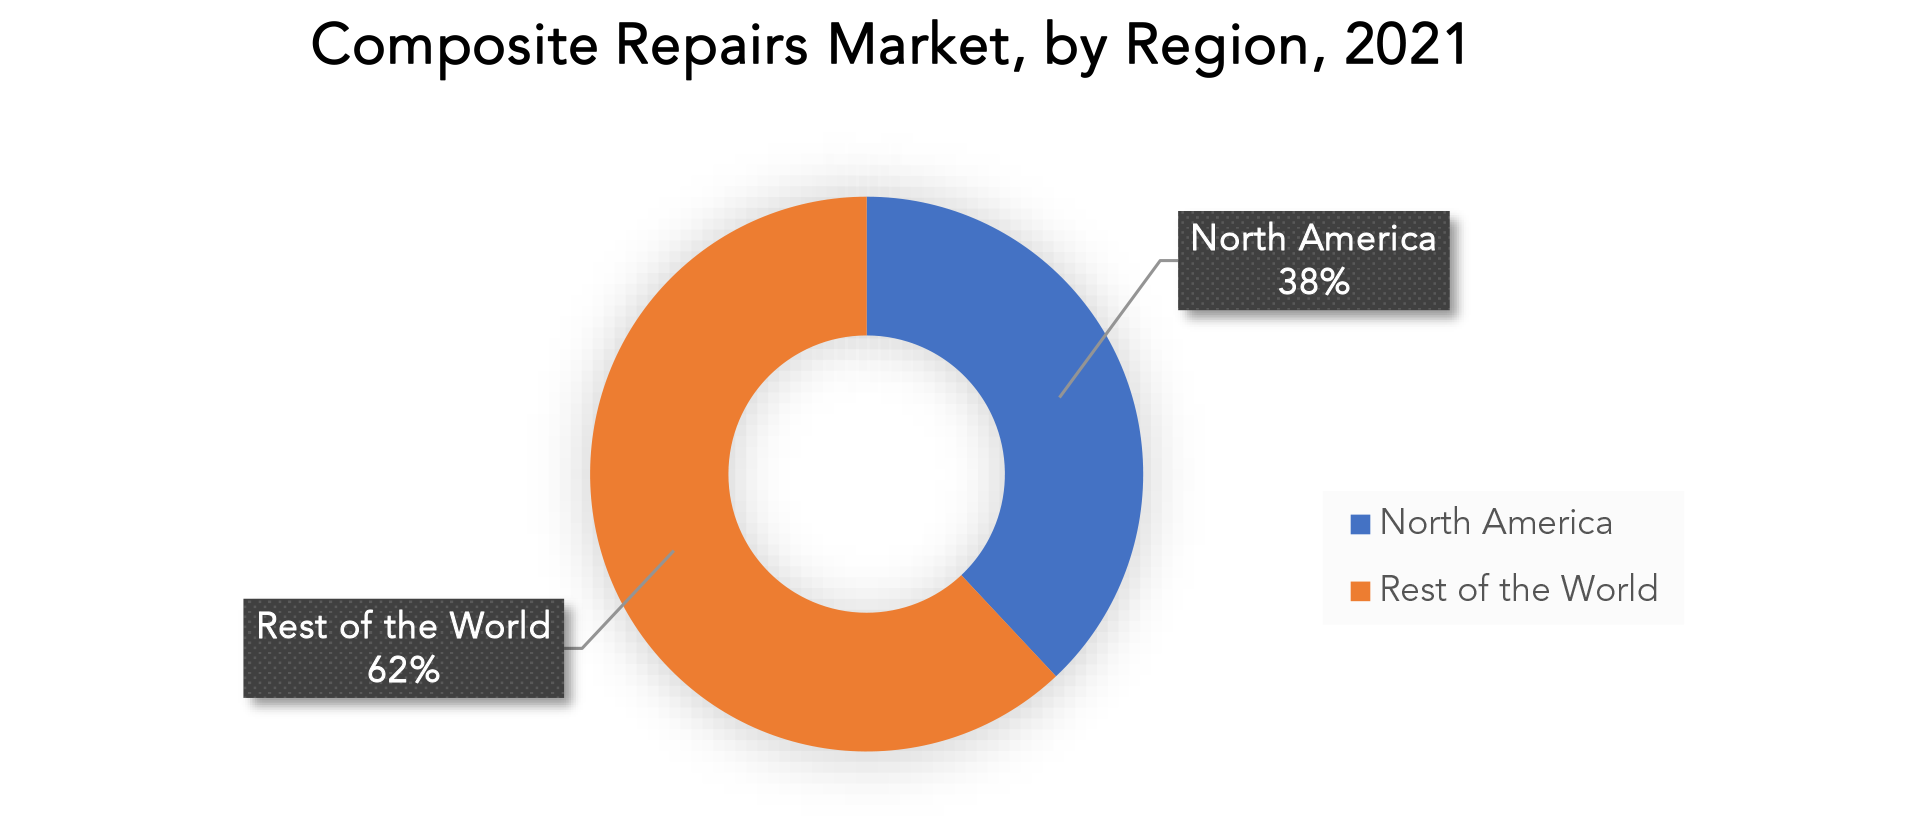
In 2021, North America retained the greatest market share for composite repairs (up to 38%). The rapidly expanding end-use sectors in North America, including the US, Canada, and Mexico, including aerospace, automotive, and construction, are a major factor in the increased need for composite repairs. 340 aircraft were delivered in 2021, a 116% rise from the 157 that were delivered in 2020, according to yearly figures from US aircraft manufacturer Boeing. The national institute of statistics and geography of Mexico also reports that the country's construction sector experienced a strong 33.8% year-over-year growth rate in 2021.
The International Organization of Motor Vehicle Manufacturers also reports that, in 2019, Canada produced 1.4 million units of light commercial vehicles, an increase of 6% from the previous year. The demand for composite repairs for structural and component applications increased as a result of the strong expansion in these sectors, and this development contributed to the positive growth of the composite repairs industry in the North American region throughout the course of the projection period.
The market for composite repairs is expanding rapidly in Eastern Europe, which is the next-largest region after Western Europe for similar reasons as in North America. The use of composite repair will increase due to Japan's big automotive sector, which is actively engaged in R&D for a variety of materials that may be incorporated into automobile frames. The composite repair market has been growing little in MEA and South America, but this industry is anticipated to expand over the coming years.
Key Market Segments: Composite Repairs Market
Composite Repairs Market By Type, 2020-2029, (USD Billion, Kilotons)- Structural
- Semi-Structural
- Cosmetic
- Hand Lay-Up
- Vacuum Infusion
- Autoclave
- Others
- Aerospace & Defense
- Wind Energy
- Automotive & Transportation
- Marine
- Construction
- Pipe & Tank
- Others
- North America
- Asia Pacific
- Europe
- South America
- Middle East and Africa
Exactitude Consultancy Services Key Objectives:
- Increasing sales and market share
- Developing new technology
- Improving profitability
- Entering new markets
- Enhancing brand reputation
Key Question Answered
- What is the expected growth rate of the composite repairs market over the next 7 years?
- Who are the major players in the composite repairs market and what is their market share?
- What are the end-user industries driving demand for market and what is their outlook?
- What are the opportunities for growth in emerging markets such as Asia-Pacific, Middle East, and Africa?
- How is the economic environment affecting the composite repairs market, including factors such as interest rates, inflation, and exchange rates?
- What is the expected impact of government policies and regulations on the composite repairs market?
- What is the current and forecasted size and growth rate of the global composite repairs market?
- What are the key drivers of growth in the composite repairs market?
- Who are the major players in the market and what is their market share?
- What are the distribution channels and supply chain dynamics in the composite repairs market?
- What are the technological advancements and innovations in the composite repairs market and their impact on product development and growth?
- What are the regulatory considerations and their impact on the market?
- What are the challenges faced by players in the Composite Repairs market and how are they addressing these challenges?
- What are the opportunities for growth and expansion in the composite repairs market?
- What are the service offerings and specifications of leading players in the market?
- What is the pricing trend of composite repairs market in the market and what is the impact of raw material prices on the price trend?
- EINFÜHRUNG
- MARKTDEFINITION
- MARKTSEGMENTIERUNG
- FORSCHUNGSZEITPLAN
- ANNAHMEN UND EINSCHRÄNKUNGEN
- FORSCHUNGSMETHODIK
- DATENMINING
- Sekundärforschung
- PRIMÄRFORSCHUNG
- RAT VON FACHEXPERTEN
- QUALITÄTSPRÜFUNGEN
- ABSCHLIESSENDE ÜBERPRÜFUNG
- DATENTRIANGULATION
- Bottom-Up-Ansatz
- TOP-DOWN-ANSATZ
- FORSCHUNGSABLAUF
- DATENQUELLEN
- DATENMINING
- ZUSAMMENFASSUNG
- MARKTÜBERSICHT
- GLOBALER MARKTAUSBLICK FÜR REPARATUREN AUS VERBUNDWERKSTOFFEN
- MARKTTREIBER
- Marktbeschränkungen
- Marktchancen
- Auswirkungen von COVID-19 auf den Markt für Verbundwerkstoffreparaturen
- PORTERS FÜNF-KRÄFTE-MODELL
- Bedrohung durch Neueinsteiger
- Bedrohung durch Ersatzprodukte
- Verhandlungsmacht der Lieferanten
- VERHANDLUNGSMACHT DER KUNDEN
- WETTBEWERBSGRAD
- ANALYSE DER BRANCHENWERTSCHÖPFUNGSKETTE
- GLOBALER MARKTAUSBLICK FÜR REPARATUREN AUS VERBUNDWERKSTOFFEN
- GLOBALER MARKT FÜR REPARATUREN VON VERBUNDWERKSTOFFEN NACH TYP (MRD. USD, KILOTONS), 2020-2029
- STRUKTURELL
- HALBSTRUKTURELL
- KOSMETIK
- GLOBALER MARKT FÜR REPARATUREN VON VERBUNDWERKSTOFFEN NACH VERFAHREN (MILLIARDEN USD, KILOTONS), 2020-2029
- HANDAUFLAGE
- VAKUUMINFUSION
- AUTOKLAVEN
- ANDERE
- GLOBALER MARKT FÜR REPARATUREN AUS VERBUNDWERKSTOFFEN NACH ENDVERWENDERN (MILLIARDEN USD, KILOTONS), 2020-2029
- LUFT- UND RAUMFAHRT & VERTEIDIGUNG
- WINDENERGIE
- AUTOMOBIL & TRANSPORT
- MARINE
- KONSTRUKTION
- ROHR & TANK
- ANDERE
- GLOBALER MARKT FÜR REPARATUREN VON VERBUNDWERKSTOFFEN NACH REGIONEN (MILLIARDEN USD, KILOTONS), 2020-2029
- NORDAMERIKA
- UNS
- KANADA
- MEXIKO
- SÜDAMERIKA
- BRASILIEN
- ARGENTINIEN
- KOLUMBIEN
- RESTLICHES SÜDAMERIKA
- EUROPA
- DEUTSCHLAND
- Vereinigtes Königreich
- FRANKREICH
- ITALIEN
- SPANIEN
- RUSSLAND
- RESTLICHES EUROPA
- ASIEN-PAZIFIK
- INDIEN
- CHINA
- JAPAN
- SÜDKOREA
- AUSTRALIEN
- SÜDOSTASIEN
- RESTLICHER ASIEN-PAZIFIK-RAUM
- NAHER OSTEN UND AFRIKA
- Vereinigte Arabische Emirate
- SAUDI-ARABIEN
- SÜDAFRIKA
- RESTLICHER NAHER OSTEN UND AFRIKA
- NORDAMERIKA
- FIRMENPROFILE*
(GESCHÄFTSÜBERBLICK, UNTERNEHMENSÜBERSICHT, ANGEBOTENE PRODUKTE, NEUE ENTWICKLUNGEN)
- LUFTHANSA TECHNIK AG
- AIR FRANCE KLM E&M
- COMPPAIR TECHNOLOGIES
- ENGINEERED COMPOSITE SOLUTION
- TOTAL WIND GROUP A/S
- TECHNICAL WIND SERVICES
- CITADEL TECHNOLOGIES
- MILLIKEN INFRASTRUCTURE
- D. WILLIAMSON INC.
- WALKER TECHNICAL RESOURCE LIMITED
*THE COMPANY LIST IS INDICATIVE
LIST OF TABLES
TABLE 1 GLOBAL COMPOSITE REPAIRS MARKET BY TYPE (USD BILLION), 2020-2029
TABLE 2 GLOBAL COMPOSITE REPAIRS MARKET BY TYPE (KILOTONS), 2020-2029
TABLE 3 GLOBAL COMPOSITE REPAIRS MARKET BY PROCESS (USD BILLION), 2020-2029
TABLE 4 GLOBAL COMPOSITE REPAIRS MARKET BY PROCESS (KILOTONS), 2020-2029
TABLE 5 GLOBAL COMPOSITE REPAIRS MARKET BY END USER (USD BILLION), 2020-2029
TABLE 6 GLOBAL COMPOSITE REPAIRS MARKET BY END USER (KILOTONS), 2020-2029
TABLE 7 GLOBAL COMPOSITE REPAIRS MARKET BY REGION (USD BILLION), 2020-2029
TABLE 8 GLOBAL COMPOSITE REPAIRS MARKET BY REGION (KILOTONS), 2020-2029
TABLE 9 NORTH AMERICA COMPOSITE REPAIRS BY COUNTRY (USD BILLION), 2020-2029
TABLE 10 NORTH AMERICA COMPOSITE REPAIRS BY COUNTRY (KILOTONS), 2020-2029
TABLE 11 NORTH AMERICA COMPOSITE REPAIRS MARKET BY TYPE (USD BILLION), 2020-2029
TABLE 12 NORTH AMERICA COMPOSITE REPAIRS MARKET BY TYPE (KILOTONS), 2020-2029
TABLE 13 NORTH AMERICA COMPOSITE REPAIRS MARKET BY PROCESS (USD BILLION), 2020-2029
TABLE 14 NORTH AMERICA COMPOSITE REPAIRS MARKET BY PROCESS (KILOTONS), 2020-2029
TABLE 15 NORTH AMERICA COMPOSITE REPAIRS MARKET BY END USER (USD BILLION), 2020-2029
TABLE 16 NORTH AMERICA COMPOSITE REPAIRS MARKET BY END USER INDUSTRY (KILOTONS), 2020-2029
TABLE 17 US COMPOSITE REPAIRS MARKET BY TYPE (USD BILLION), 2020-2029
TABLE 18 US COMPOSITE REPAIRS MARKET BY TYPE (KILOTONS), 2020-2029
TABLE 19 US COMPOSITE REPAIRS MARKET BY PROCESS (USD BILLION), 2020-2029
TABLE 20 US COMPOSITE REPAIRS MARKET BY PROCESS (KILOTONS), 2020-2029
TABLE 21 US COMPOSITE REPAIRS MARKET BY END USER (USD BILLION), 2020-2029
TABLE 22 US COMPOSITE REPAIRS MARKET BY END USER (KILOTONS), 2020-2029
TABLE 23 CANADA COMPOSITE REPAIRS MARKET BY TYPE (USD BILLION), 2020-2029
TABLE 24 CANADA COMPOSITE REPAIRS MARKET BY TYPE (KILOTONS), 2020-2029
TABLE 25 CANADA COMPOSITE REPAIRS MARKET BY PROCESS (USD BILLION), 2020-2029
TABLE 26 CANADA COMPOSITE REPAIRS MARKET BY PROCESS (KILOTONS), 2020-2029
TABLE 27 CANADA COMPOSITE REPAIRS MARKET BY END USER (USD BILLION), 2020-2029
TABLE 28 CANADA COMPOSITE REPAIRS MARKET BY END USER (KILOTONS), 2020-2029
TABLE 29 MEXICO COMPOSITE REPAIRS MARKET BY TYPE (USD BILLION), 2020-2029
TABLE 30 MEXICO COMPOSITE REPAIRS MARKET BY TYPE (KILOTONS), 2020-2029
TABLE 31 MEXICO COMPOSITE REPAIRS MARKET BY PROCESS (USD BILLION), 2020-2029
TABLE 32 MEXICO COMPOSITE REPAIRS MARKET BY PROCESS (KILOTONS), 2020-2029
TABLE 33 MEXICO COMPOSITE REPAIRS MARKET BY END USER (USD BILLION), 2020-2029
TABLE 34 MEXICO COMPOSITE REPAIRS MARKET BY END USER (KILOTONS), 2020-2029
TABLE 35 SOUTH AMERICA COMPOSITE REPAIRS MARKET BY COUNTRY (USD BILLION), 2020-2029
TABLE 36 SOUTH AMERICA COMPOSITE REPAIRS MARKET BY COUNTRY (KILOTONS), 2020-2029
TABLE 37 SOUTH AMERICA COMPOSITE REPAIRS MARKET BY TYPE (USD BILLION), 2020-2029
TABLE 38 SOUTH AMERICA COMPOSITE REPAIRS MARKET BY TYPE (KILOTONS), 2020-2029
TABLE 39 SOUTH AMERICA COMPOSITE REPAIRS MARKET BY PROCESS (USD BILLION), 2020-2029
TABLE 40 SOUTH AMERICA COMPOSITE REPAIRS MARKET BY PROCESS (KILOTONS), 2020-2029
TABLE 41 SOUTH AMERICA COMPOSITE REPAIRS MARKET BY END USER (USD BILLION), 2020-2029
TABLE 42 SOUTH AMERICA COMPOSITE REPAIRS MARKET BY END USER (KILOTONS), 2020-2029
TABLE 43 BRAZIL COMPOSITE REPAIRS MARKET BY TYPE (USD BILLION), 2020-2029
TABLE 44 BRAZIL COMPOSITE REPAIRS MARKET BY TYPE (KILOTONS), 2020-2029
TABLE 45 BRAZIL COMPOSITE REPAIRS MARKET BY PROCESS (USD BILLION), 2020-2029
TABLE 46 BRAZIL COMPOSITE REPAIRS MARKET BY PROCESS (KILOTONS), 2020-2029
TABLE 47 BRAZIL COMPOSITE REPAIRS MARKET BY END USER (USD BILLION), 2020-2029
TABLE 48 BRAZIL COMPOSITE REPAIRS MARKET BY END USER (KILOTONS), 2020-2029
TABLE 49 ARGENTINA COMPOSITE REPAIRS MARKET BY TYPE (USD BILLION), 2020-2029
TABLE 50 ARGENTINA COMPOSITE REPAIRS MARKET BY TYPE (KILOTONS), 2020-2029
TABLE 51 ARGENTINA COMPOSITE REPAIRS MARKET BY PROCESS (USD BILLION), 2020-2029
TABLE 52 ARGENTINA COMPOSITE REPAIRS MARKET BY PROCESS (KILOTONS), 2020-2029
TABLE 53 ARGENTINA COMPOSITE REPAIRS MARKET BY END USER (USD BILLION), 2020-2029
TABLE 54 ARGENTINA COMPOSITE REPAIRS MARKET BY END USER (KILOTONS), 2020-2029
TABLE 55 COLOMBIA COMPOSITE REPAIRS MARKET BY TYPE (KILOTONS), 2020-2029
TABLE 56 COLOMBIA COMPOSITE REPAIRS MARKET BY TYPE (USD BILLION), 2020-2029
TABLE 57 COLOMBIA COMPOSITE REPAIRS MARKET BY TYPE (KILOTONS), 2020-2029
TABLE 58 COLOMBIA COMPOSITE REPAIRS MARKET BY PROCESS (USD BILLION), 2020-2029
TABLE 59 COLOMBIA COMPOSITE REPAIRS MARKET BY PROCESS (KILOTONS), 2020-2029
TABLE 60 COLOMBIA COMPOSITE REPAIRS MARKET BY END USER (USD BILLION), 2020-2029
TABLE 61 COLOMBIA COMPOSITE REPAIRS MARKET BY END USER (KILOTONS), 2020-2029
TABLE 62 REST OF SOUTH AMERICA COMPOSITE REPAIRS MARKET BY TYPE (USD BILLION), 2020-2029
TABLE 63 REST OF SOUTH AMERICA COMPOSITE REPAIRS MARKET BY TYPE (KILOTONS), 2020-2029
TABLE 64 REST OF SOUTH AMERICA COMPOSITE REPAIRS MARKET BY PROCESS (USD BILLION), 2020-2029
TABLE 65 REST OF SOUTH AMERICA COMPOSITE REPAIRS MARKET BY PROCESS (KILOTONS), 2020-2029
TABLE 66 REST OF SOUTH AMERICA COMPOSITE REPAIRS MARKET BY END USER (USD BILLION), 2020-2029
TABLE 67 REST OF SOUTH AMERICA COMPOSITE REPAIRS MARKET BY END USER (KILOTONS), 2020-2029
TABLE 68 ASIA-PACIFIC COMPOSITE REPAIRS MARKET BY COUNTRY (USD BILLION), 2020-2029
TABLE 69 ASIA-PACIFIC COMPOSITE REPAIRS MARKET BY COUNTRY (KILOTONS), 2020-2029
TABLE 70 ASIA-PACIFIC COMPOSITE REPAIRS MARKET BY TYPE (USD BILLION), 2020-2029
TABLE 71 ASIA-PACIFIC COMPOSITE REPAIRS MARKET BY TYPE (KILOTONS), 2020-2029
TABLE 72 ASIA-PACIFIC COMPOSITE REPAIRS MARKET BY PROCESS (USD BILLION), 2020-2029
TABLE 73 ASIA-PACIFIC COMPOSITE REPAIRS MARKET BY PROCESS (KILOTONS), 2020-2029
TABLE 74 ASIA-PACIFIC COMPOSITE REPAIRS MARKET BY END USER (USD BILLION), 2020-2029
TABLE 75 ASIA-PACIFIC COMPOSITE REPAIRS MARKET BY END USER (KILOTONS), 2020-2029
TABLE 76 INDIA COMPOSITE REPAIRS MARKET BY TYPE (USD BILLION), 2020-2029
TABLE 77 INDIA COMPOSITE REPAIRS MARKET BY TYPE (KILOTONS), 2020-2029
TABLE 78 INDIA COMPOSITE REPAIRS MARKET BY PROCESS (USD BILLION), 2020-2029
TABLE 79 INDIA COMPOSITE REPAIRS MARKET BY PROCESS (KILOTONS), 2020-2029
TABLE 80 INDIA COMPOSITE REPAIRS MARKET BY END-USER INDUTRY (USD BILLION), 2020-2029
TABLE 81 INDIA COMPOSITE REPAIRS MARKET BY END USER (KILOTONS), 2020-2029
TABLE 82 CHINA COMPOSITE REPAIRS MARKET BY TYPE (USD BILLION), 2020-2029
TABLE 83 CHINA COMPOSITE REPAIRS MARKET BY TYPE (KILOTONS), 2020-2029
TABLE 84 CHINA COMPOSITE REPAIRS MARKET BY PROCESS (USD BILLION), 2020-2029
TABLE 85 CHINA COMPOSITE REPAIRS MARKET BY PROCESS (KILOTONS), 2020-2029
TABLE 86 CHINA COMPOSITE REPAIRS MARKET BY END USER (USD BILLION), 2020-2029
TABLE 87 CHINA COMPOSITE REPAIRS MARKET BY END USER (KILOTONS), 2020-2029
TABLE 88 JAPAN COMPOSITE REPAIRS MARKET BY TYPE (USD BILLION), 2020-2029
TABLE 89 JAPAN COMPOSITE REPAIRS MARKET BY TYPE (KILOTONS), 2020-2029
TABLE 90 JAPAN COMPOSITE REPAIRS MARKET BY PROCESS (USD BILLION), 2020-2029
TABLE 91 JAPAN COMPOSITE REPAIRS MARKET BY PROCESS (KILOTONS), 2020-2029
TABLE 92 JAPAN COMPOSITE REPAIRS MARKET BY END USER (USD BILLION), 2020-2029
TABLE 93 JAPAN COMPOSITE REPAIRS MARKET BY END USER (KILOTONS), 2020-2029
TABLE 94 SOUTH KOREA COMPOSITE REPAIRS MARKET BY TYPE (USD BILLION), 2020-2029
TABLE 95 SOUTH KOREA COMPOSITE REPAIRS MARKET BY TYPE (KILOTONS), 2020-2029
TABLE 96 SOUTH KOREA COMPOSITE REPAIRS MARKET BY PROCESS (USD BILLION), 2020-2029
TABLE 97 SOUTH KOREA COMPOSITE REPAIRS MARKET BY PROCESS (KILOTONS), 2020-2029
TABLE 98 SOUTH KOREA COMPOSITE REPAIRS MARKET BY END USER (USD BILLION), 2020-2029
TABLE 99 SOUTH KOREA COMPOSITE REPAIRS MARKET BY END USER (KILOTONS), 2020-2029
TABLE 100 AUSTRALIA COMPOSITE REPAIRS MARKET BY TYPE (USD BILLION), 2020-2029
TABLE 101 AUSTRALIA COMPOSITE REPAIRS BY TYPE (KILOTONS), 2020-2029
TABLE 102 AUSTRALIA COMPOSITE REPAIRS MARKET BY PROCESS (USD BILLION), 2020-2029
TABLE 103 AUSTRALIA COMPOSITE REPAIRS MARKET BY PROCESS (KILOTONS), 2020-2029
TABLE 104 AUSTRALIA COMPOSITE REPAIRS MARKET BY END USER (USD BILLION), 2020-2029
TABLE 105 AUSTRALIA COMPOSITE REPAIRS MARKET BY END USER (KILOTONS), 2020-2029
TABLE 106 SOUTH EAST ASIA COMPOSITE REPAIRS MARKET BY TYPE (USD MI LLION), 2020-2029
TABLE 107 SOUTH EAST ASIA COMPOSITE REPAIRS BY TYPE (KILOTONS), 2020-2029
TABLE 108 SOUTH EAST ASIA COMPOSITE REPAIRS MARKET BY PROCESS (USD BILLION), 2020-2029
TABLE 109 SOUTH EAST ASIA COMPOSITE REPAIRS MARKET BY PROCESS (KILOTONS), 2020-2029
TABLE 110 SOUTH EAST ASIA COMPOSITE REPAIRS MARKET BY END USER (USD BILLION), 2020-2029
TABLE 111 SOUTH EAST ASIA COMPOSITE REPAIRS MARKET BY END USER (KILOTONS), 2020-2029
TABLE 112 REST OF ASIA PACIFIC COMPOSITE REPAIRS MARKET BY TYPE (USD BILLION), 2020-2029
TABLE 113 REST OF ASIA PACIFIC COMPOSITE REPAIRS BY TYPE (KILOTONS), 2020-2029
TABLE 114 REST OF ASIA PACIFIC COMPOSITE REPAIRS MARKET BY PROCESS (USD BILLION), 2020-2029
TABLE 115 REST OF ASIA PACIFIC COMPOSITE REPAIRS MARKET BY PROCESS (KILOTONS), 2020-2029
TABLE 116 REST OF ASIA PACIFIC COMPOSITE REPAIRS MARKET BY END USER (USD BILLION), 2020-2029
TABLE 117 REST OF ASIA PACIFIC COMPOSITE REPAIRS MARKET BY END USER (KILOTONS), 2020-2029
TABLE 118 EUROPE COMPOSITE REPAIRS MARKET BY COUNTRY (USD BILLION), 2020-2029
TABLE 119 EUROPE COMPOSITE REPAIRS MARKET BY COUNTRY (KILOTONS), 2020-2029
TABLE 120 EUROPE COMPOSITE REPAIRS MARKET BY TYPE (USD BILLION), 2020-2029
TABLE 121 EUROPE COMPOSITE REPAIRS MARKET BY TYPE (KILOTONS), 2020-2029
TABLE 122 EUROPE COMPOSITE REPAIRS MARKET BY PROCESS (USD BILLION), 2020-2029
TABLE 123 EUROPE COMPOSITE REPAIRS MARKET BY PROCESS (KILOTONS), 2020-2029
TABLE 124 EUROPE COMPOSITE REPAIRS MARKET BY END USER (USD BILLION), 2020-2029
TABLE 125 EUROPE COMPOSITE REPAIRS MARKET BY END USER (KILOTONS), 2020-2029
TABLE 126 GERMANY COMPOSITE REPAIRS MARKET BY TYPE (USD BILLION), 2020-2029
TABLE 127 GERMANY COMPOSITE REPAIRS MARKET BY TYPE (KILOTONS), 2020-2029
TABLE 128 GERMANY COMPOSITE REPAIRS MARKET BY PROCESS (USD BILLION), 2020-2029
TABLE 129 GERMANY COMPOSITE REPAIRS MARKET BY PROCESS (KILOTONS), 2020-2029
TABLE 130 GERMANY COMPOSITE REPAIRS MARKET BY END USER (USD BILLION), 2020-2029
TABLE 131 GERMANY COMPOSITE REPAIRS MARKET BY END USER (KILOTONS), 2020-2029
TABLE 132 UK COMPOSITE REPAIRS MARKET BY TYPE (USD BILLION), 2020-2029
TABLE 133 UK COMPOSITE REPAIRS MARKET BY TYPE (KILOTONS), 2020-2029
TABLE 134 UK COMPOSITE REPAIRS MARKET BY PROCESS (USD BILLION), 2020-2029
TABLE 135 UK COMPOSITE REPAIRS MARKET BY PROCESS (KILOTONS), 2020-2029
TABLE 136 UK COMPOSITE REPAIRS MARKET BY END USER (USD BILLION), 2020-2029
TABLE 137 UK COMPOSITE REPAIRS MARKET BY END USER (KILOTONS), 2020-2029
TABLE 138 FRANCE COMPOSITE REPAIRS MARKET BY TYPE (USD BILLION), 2020-2029
TABLE 139 FRANCE COMPOSITE REPAIRS MARKET BY TYPE (KILOTONS), 2020-2029
TABLE 140 FRANCE COMPOSITE REPAIRS MARKET BY PROCESS (USD BILLION), 2020-2029
TABLE 141 FRANCE COMPOSITE REPAIRS MARKET BY PROCESS (KILOTONS), 2020-2029
TABLE 142 FRANCE COMPOSITE REPAIRS MARKET BY END USER (USD BILLION), 2020-2029
TABLE 143 FRANCE COMPOSITE REPAIRS MARKET BY END USER (KILOTONS), 2020-2029
TABLE 144 ITALY COMPOSITE REPAIRS MARKET BY TYPE (USD BILLION), 2020-2029
TABLE 145 ITALY COMPOSITE REPAIRS MARKET BY TYPE (KILOTONS), 2020-2029
TABLE 146 ITALY COMPOSITE REPAIRS MARKET BY PROCESS (USD BILLION), 2020-2029
TABLE 147 ITALY COMPOSITE REPAIRS MARKET BY PROCESS (KILOTONS), 2020-2029
TABLE 148 ITALY COMPOSITE REPAIRS MARKET BY END USER (USD BILLION), 2020-2029
TABLE 149 ITALY COMPOSITE REPAIRS MARKET BY END USER (KILOTONS), 2020-2029
TABLE 150 SPAIN COMPOSITE REPAIRS MARKET BY TYPE (USD BILLION), 2020-2029
TABLE 151 SPAIN COMPOSITE REPAIRS MARKET BY TYPE (KILOTONS), 2020-2029
TABLE 152 SPAIN COMPOSITE REPAIRS MARKET BY PROCESS (USD BILLION), 2020-2029
TABLE 153 SPAIN COMPOSITE REPAIRS MARKET BY PROCESS (KILOTONS), 2020-2029
TABLE 154 SPAIN COMPOSITE REPAIRS MARKET BY END USER (USD BILLION), 2020-2029
TABLE 155 SPAIN COMPOSITE REPAIRS MARKET BY END USER (KILOTONS), 2020-2029
TABLE 156 RUSSIA COMPOSITE REPAIRS MARKET BY TYPE (USD BILLION), 2020-2029
TABLE 157 RUSSIA COMPOSITE REPAIRS MARKET BY TYPE (KILOTONS), 2020-2029
TABLE 158 RUSSIA COMPOSITE REPAIRS MARKET BY PROCESS (USD BILLION), 2020-2029
TABLE 159 RUSSIA COMPOSITE REPAIRS MARKET BY PROCESS (KILOTONS), 2020-2029
TABLE 160 RUSSIA COMPOSITE REPAIRS MARKET BY END USER (USD BILLION), 2020-2029
TABLE 161 RUSSIA COMPOSITE REPAIRS MARKET BY END USER (KILOTONS), 2020-2029
TABLE 162 REST OF EUROPE COMPOSITE REPAIRS MARKET BY TYPE (USD BILLION), 2020-2029
TABLE 163 REST OF EUROPE COMPOSITE REPAIRS MARKET BY TYPE (KILOTONS), 2020-2029
TABLE 164 REST OF EUROPE COMPOSITE REPAIRS MARKET BY PROCESS (USD BILLION), 2020-2029
TABLE 165 REST OF EUROPE COMPOSITE REPAIRS MARKET BY PROCESS (KILOTONS), 2020-2029
TABLE 166 REST OF EUROPE COMPOSITE REPAIRS MARKET BY END USER (USD BILLION), 2020-2029
TABLE 167 REST OF EUROPE COMPOSITE REPAIRS MARKET BY END USER (KILOTONS), 2020-2029
TABLE 168 MIDDLE EAST AND AFRICA COMPOSITE REPAIRS MARKET BY COUNTRY (USD BILLION), 2020-2029
TABLE 169 MIDDLE EAST AND AFRICA COMPOSITE REPAIRS MARKET BY COUNTRY (KILOTONS), 2020-2029
TABLE 170 MIDDLE EAST AND AFRICA COMPOSITE REPAIRS MARKET BY TYPE (USD BILLION), 2020-2029
TABLE 171 MIDDLE EAST AND AFRICA COMPOSITE REPAIRS MARKET BY TYPE (KILOTONS), 2020-2029
TABLE 172 MIDDLE EAST AND AFRICA COMPOSITE REPAIRS MARKET BY PROCESS (USD BILLION), 2020-2029
TABLE 173 MIDDLE EAST AND AFRICA COMPOSITE REPAIRS MARKET BY PROCESS (KILOTONS), 2020-2029
TABLE 174 MIDDLE EAST AND AFRICA COMPOSITE REPAIRS MARKET BY END USER (USD BILLION), 2020-2029
TABLE 175 MIDDLE EAST AND AFRICA COMPOSITE REPAIRS MARKET BY END USER (KILOTONS), 2020-2029
TABLE 176 UAE COMPOSITE REPAIRS MARKET BY TYPE (USD BILLION), 2020-2029
TABLE 177 UAE COMPOSITE REPAIRS MARKET BY TYPE (KILOTONS), 2020-2029
TABLE 178 UAE COMPOSITE REPAIRS MARKET BY PROCESS (USD BILLION), 2020-2029
TABLE 179 UAE COMPOSITE REPAIRS MARKET BY PROCESS (KILOTONS), 2020-2029
TABLE 180 UAE COMPOSITE REPAIRS MARKET BY END USER (USD BILLION), 2020-2029
TABLE 181 UAE COMPOSITE REPAIRS MARKET BY END USER (KILOTONS), 2020-2029
TABLE 182 SAUDI ARABIA COMPOSITE REPAIRS MARKET BY TYPE (USD BILLION), 2020-2029
TABLE 183 SAUDI ARABIA COMPOSITE REPAIRS MARKET BY TYPE (KILOTONS), 2020-2029
TABLE 184 SAUDI ARABIA COMPOSITE REPAIRS MARKET BY PROCESS (USD BILLION), 2020-2029
TABLE 185 SAUDI ARABIA COMPOSITE REPAIRS MARKET BY PROCESS (KILOTONS), 2020-2029
TABLE 186 SAUDI ARABIA COMPOSITE REPAIRS MARKET BY END USER (USD BILLION), 2020-2029
TABLE 187 SAUDI ARABIA COMPOSITE REPAIRS MARKET BY END USER (KILOTONS), 2020-2029
TABLE 188 SOUTH AFRICA COMPOSITE REPAIRS MARKET BY TYPE (USD BILLION), 2020-2029
TABLE 189 SOUTH AFRICA COMPOSITE REPAIRS MARKET BY TYPE (KILOTONS), 2020-2029
TABLE 190 SOUTH AFRICA COMPOSITE REPAIRS MARKET BY PROCESS (USD BILLION), 2020-2029
TABLE 191 SOUTH AFRICA COMPOSITE REPAIRS MARKET BY PROCESS (KILOTONS), 2020-2029
TABLE 192 SOUTH AFRICA COMPOSITE REPAIRS MARKET BY END USER (USD BILLION), 2020-2029
TABLE 193 SOUTH AFRICA COMPOSITE REPAIRS MARKET BY END USER (KILOTONS), 2020-2029
TABLE 194 REST OF MIDDLE EAST AND AFRICA COMPOSITE REPAIRS MARKET BY TYPE (USD BILLION), 2020-2029
TABLE 195 REST OF MIDDLE EAST AND AFRICA COMPOSITE REPAIRS MARKET BY TYPE (KILOTONS), 2020-2029
TABLE 196 REST OF MIDDLE EAST AND AFRICA COMPOSITE REPAIRS MARKET BY PROCESS (USD BILLION), 2020-2029
TABLE 197 REST OF MIDDLE EAST AND AFRICA COMPOSITE REPAIRS MARKET BY PROCESS (KILOTONS), 2020-2029
TABLE 198 REST OF MIDDLE EAST AND AFRICA COMPOSITE REPAIRS MARKET BY END USER (USD BILLION), 2020-2029
TABLE 199 REST OF MIDDLE EAST AND AFRICA COMPOSITE REPAIRS MARKET BY END USER(KILOTONS), 2020-2029
LIST OF FIGURES
FIGURE 1 MARKET DYNAMICS
FIGURE 2 MARKET SEGMENTATION
FIGURE 3 REPORT TIMELINES: YEARS CONSIDERED
FIGURE 4 DATA TRIANGULATION
FIGURE 5 BOTTOM-UP APPROACH
FIGURE 6 TOP-DOWN APPROACH
FIGURE 7 RESEARCH FLOW
FIGURE 8 GLOBAL COMPOSITE REPAIRS BY TYPE, USD BILLION, 2020-2029
FIGURE 9 GLOBAL COMPOSITE REPAIRS BY PROCESS, USD BILLION, 2020-2029
FIGURE 10 GLOBAL COMPOSITE REPAIRS BY END USER, USD BILLION, 2020-2029
FIGURE 11 GLOBAL COMPOSITE REPAIRS BY REGION, USD BILLION, 2020-2029
FIGURE 12 PORTER’S FIVE FORCES MODEL
FIGURE 13 GLOBAL COMPOSITE REPAIRS MARKET BY TYPE, USD BILLION, 2021
FIGURE 14 GLOBAL COMPOSITE REPAIRS MARKET BY PROCESS, USD BILLION, 2021
FIGURE 15 GLOBAL COMPOSITE REPAIRS MARKET BY END USER, USD BILLION, 2021
FIGURE 16 GLOBAL COMPOSITE REPAIRS MARKET BY REGION, USD BILLION, 2021
FIGURE 17 MARKET SHARE ANALYSIS
FIGURE 18 LUFTHANSA TECHNIK AG: COMPANY SNAPSHOT
FIGURE 19 COMPPAIR TECHNOLOGIES: COMPANY SNAPSHOT
FIGURE 20 ENGINEERED COMPOSITE SOLUTION: COMPANY SNAPSHOT
FIGURE 21 TOTAL WIND GROUP A/S: COMPANY SNAPSHOT
FIGURE 22 TECHNICAL WIND SERVICES: COMPANY SNAPSHOT
FIGURE 23 CITADEL TECHNOLOGIES: COMPANY SNAPSHOT
FIGURE 24 MILLIKEN INFRASTRUCTURE: COMPANY SNAPSHOT
FIGURE 25 T.D. WILLIAMSON INC: COMPANY SNAPSHOT
FIGURE 26 WALKER TECHNICAL RESOURCE LIMITED: COMPANY SNAPSHOT
DOWNLOAD FREE SAMPLE REPORT
License Type
SPEAK WITH OUR ANALYST
Want to know more about the report or any specific requirement?
WANT TO CUSTOMIZE THE REPORT?
Our Clients Speak
We asked them to research ‘ Equipment market’ all over the world, and their whole arrangement was helpful to us. thehealthanalytics.com insightful analysis and reports contributed to our current analysis and in creating a future strategy. Besides, the te
Yosuke Mitsui
Senior Associate Construction Equipment Sales & Marketing
We asked them to research ‘Equipment market’ all over the world, and their whole arrangement was helpful to us. thehealthanalytics.com insightful analysis and reports contributed to our current analysis and in creating a future strategy. Besides, the te


