

Base Year Value ()
x.x %
x.x %
CAGR ()
x.x %
x.x %
Forecast Year Value ()
x.x %
x.x %
Historical Data Period
Largest Region
Forecast Period
Markt für Epoxidhärter nach Produkt (Amine und Polyamine, Amide und Polyamide, Anhydride, Phenole, andere), Anwendung (Farben, Beschichtungen und Tinten, Klebstoffe und Dichtstoffe, Verbundwerkstoffe), Endverbrauchsindustrie (Bau, Elektrik und Elektronik, Stromerzeugung, Automobil und Transport, Marine, andere) und nach Region Globale Trends und Prognose von 2022 bis 2029
Instant access to hundreds of data points and trends
- Market estimates from 2014-2029
- Competitive analysis, industry segmentation, financial benchmarks
- Incorporates SWOT, Porter's Five Forces and risk management frameworks
- PDF report or online database with Word, Excel and PowerPoint export options
- 100% money back guarantee
Marktübersicht für Epoxidhärter
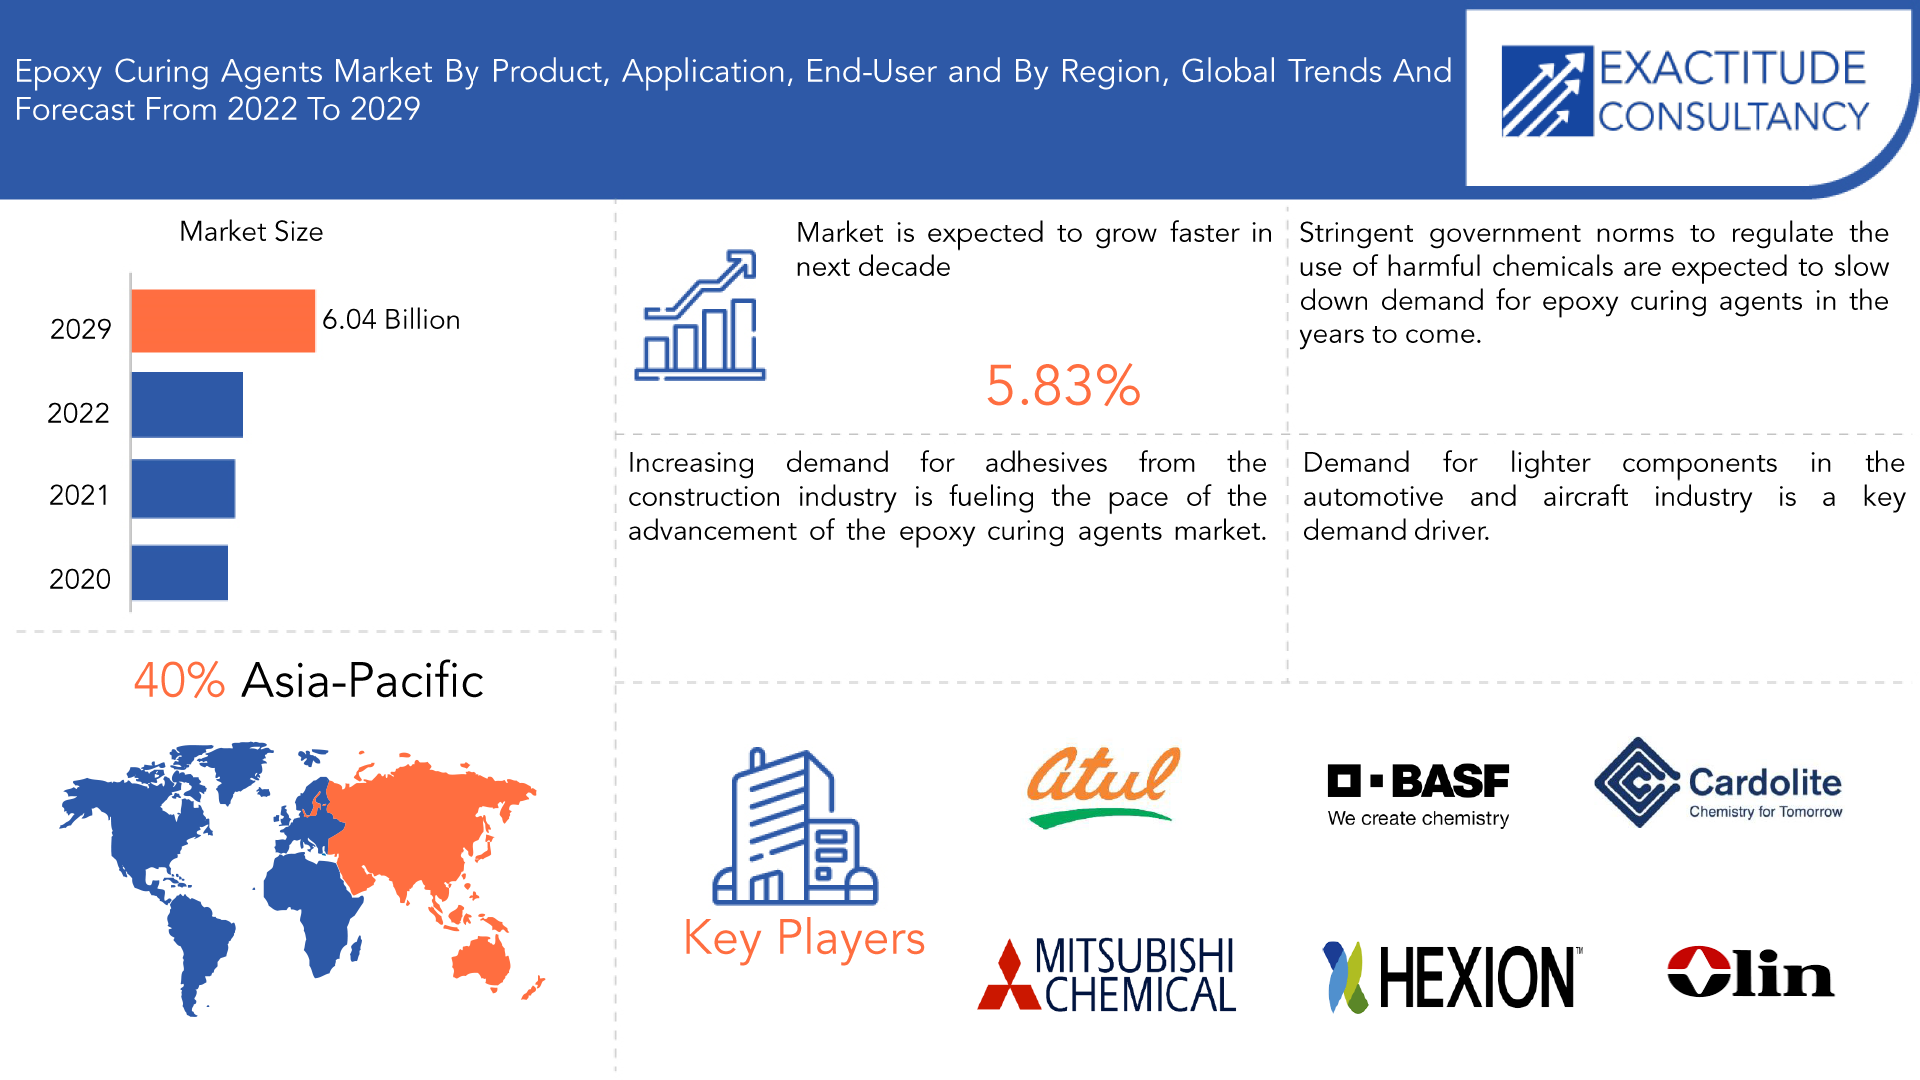
Der weltweite Markt für Epoxidhärter soll von 3,74 Milliarden US-Dollar im Jahr 2020 auf 6,04 Milliarden US-Dollar im Jahr 2029 anwachsen und zwischen 2022 und 2029 eine durchschnittliche jährliche Wachstumsrate (CAGR) von 5,69 % aufweisen .
Durch die Kombination von Epoxidhärtern und Epoxidpolymeren entstehen hochwertige Endprodukte. Nach dem Aushärten weist das Material außerdem eine ausgezeichnete Haftung auf. Epoxidhärter weisen eine hohe mechanische Festigkeit, elektrische Isolierung und chemische Beständigkeit auf. Das Aushärten von Epoxidharzen ist eine exotherme Reaktion, die, wenn sie unkontrolliert bleibt, so viel Wärme erzeugen kann, dass es zu thermischer Zersetzung kommt. Das Epoxidharzsystem ist in die Seiten „A“ und „B“ unterteilt. Der Epoxidhärter, auch „Härter“ genannt, befindet sich auf der B-Seite. Der Härter reagiert mit den Epoxidgruppen im Harz.
Härtemittel sind Substanzen, die zum Härten einer Oberfläche oder eines Materials verwendet werden. Sie werden normalerweise auf Polymeroberflächen aufgetragen, um die Bindung der molekularen Komponenten des Materials zu unterstützen: Je stärker die molekularen Bindungen, desto komplexer die Materialoberfläche. Das beste Härtemittel muss basierend auf den Nutzungsbedingungen, der Anwendung, der Verarbeitbarkeit und anderen Faktoren ausgewählt werden.
| ATTRIBUT | DETAILS |
| Studiendauer | 2020–2029 |
| Basisjahr | 2021 |
| Geschätztes Jahr | 2022 |
| Voraussichtliches Jahr | 2022–2029 |
| Historischer Zeitraum | 2018-2020 |
| Einheit | Wert (Mrd. USD) Volumen (Kilotonnen) |
| Segmentierung | Nach Produkt, nach Anwendung, nach Endbenutzer, nach Region. |
| Nach Produkttyp |
|
| Nach Anwendung |
|
| Nach Endbenutzer |
|
| Nach Region |
|
Die steigende Nachfrage nach Epoxidhärtern aus der Baubranche sowie neue innovative Entwicklungen bei Leichtbaustoffen werden die Nachfrage nach Epoxidhärtern im Prognosezeitraum ankurbeln. Strenge gesetzliche Vorschriften und Qualitätsstandards fördern die Verwendung von Leichtbaustoffen in verschiedenen Industriezweigen wie der Luft- und Raumfahrt und der Automobilindustrie. Darüber hinaus besteht eine hohe Nachfrage nach Epoxidhärtern für die Herstellung von Leiterplatten (PCBs), die in einer Vielzahl von elektronischen Produkten verwendet werden, darunter Mobiltelefone, Smartphones, Automobilelektronik, Geräte und andere Unterhaltungselektronik.
Darüber hinaus wird der Markttrend für Epoxidhärter weiterhin positiv durch die steigende Nachfrage nach ihnen als leichtgewichtiger Rohstoff in verschiedenen industriellen Anwendungen beeinflusst. Darüber hinaus haben Epoxidhärter auf Aminbasis gute Expansionschancen aufgrund der steigenden Nachfrage nach Farben und Beschichtungen in der Bauindustrie, insbesondere für Fußböden und Innenanstriche. Aufgrund der schnellen Entwicklung von Wind- und Solarenergie und der steigenden Nachfrage nach einer Vielzahl von Industriewerkzeugen auf der ganzen Welt wird erwartet, dass Epoxidhärter aufgrund ihrer hervorragenden thermischen und elektrischen Isoliereigenschaften und ihrer ausgezeichneten mechanischen Eigenschaften ein hohes Marktwachstum erleben werden. Epoxidhärter sind weltweit stark gefragt und die Hersteller erweitern ihre globale Präsenz, um diese Nachfrage zu decken und ihren Kundenstamm zu erweitern.
Die Herstellung von Epoxidharzhärtern unterliegt in einigen europäischen Ländern strengen Gesetzen. Aufgrund der eingeführten Regulierungsrichtlinien und der zunehmenden Umweltbedenken verwenden Hersteller in einer Vielzahl von Anwendungen umweltfreundliche Produkte. Darüber hinaus haben die Sicherheit und die Minderung der Gesundheitsrisiken durch VOC-Emissionen aus Chemikalien für Hersteller von Epoxidhärtern weltweit höchste Priorität.
[Bildunterschrift id="attachment_17310" align="aligncenter" width="1920"]
Frequently Asked Questions
• What is the worth of global epoxy curing agents market?
The global epoxy curing agents market is projected to reach USD 6.04 billion by 2029 from USD 3.74 billion in 2020, at a CAGR of 5.69 % from 2022 to 2029.
• What are the key factors boosting the epoxy curing agents market growth?
Increase in demand for materials used in construction and transport industry, increase in demand for efficient wind and solar power plants are the key factors driving the growth of epoxy curing agents market
• What is the CAGR of epoxy curing agents market?
The global Epoxy curing agents market registered a CAGR of 5.69 % from 2022 to 2029.
• Which are the top companies to hold the market share in epoxy curing agents market?
Key players profiled in the report include Atul Ltd, BASF SE, Cardolite Corporation, Epochemie - Epoxy Curing Agents, Epoxy Division Aditya Birla Chemicals (Thailand) Limited (Aditya Birla Group), Evonik Industries, Hexion, Huntsman International LLC, Kukdo Chemical Co. Ltd, Kumho P&B Chemicals Inc., Mitsubishi Chemical Corporation, Olin Corporation, Shandong Deyuan Epoxy Resin Co. Ltd, Toray Industries Inc., Dow Chemical Company, DIC Corporation, Olin Corporation
• Which is the largest regional market for epoxy curing agents market?
The region of Asia Pacific is anticipated to hold a sizable portion of the worldwide market. Epoxy curing agents would be in greater demand if they were used more frequently in flooring, marble veneer, and concrete binding. The primary driver of product demand is China's rapid expansion in manufacturing along with helpful regulations.
Epoxy Curing Agents Market Segment Analysis
The global epoxy curing agents market is segmented by product, application, end-user and region.
Based on product, the epoxy curing agents market is segmented into Amines and Polyamines, Amides and Polyamides, Anhydrides, Phenolic, Others. The Amine Based Curing Agents hold a large number of shares in the market because it is more durable & chemical resistant than other curing agents. The features of amine-based curing agents include curing duration, pot life, chemical and thermal resistance, and weather resistance. Additionally, it is anticipated that the market for polyamide epoxy curing agents will see an increase in demand due to the strict government laws governing hazardous emissions from amines. The market for amine-based curing agents has a net value of US$ 2.19 billion and a commanding 46.2% market share worldwide. Throughout the forecast period, this sector is anticipated to grow at the highest CAGR of 8.4%.
Anhydride-based curing agents are commonly used in high-performance applications, such as aerospace and automotive, due to their high temperature resistance and excellent mechanical properties. Phenolic-based curing agents are often used in applications that require high chemical resistance, such as in the production of electrical components.
Based on application, the epoxy curing agents market is segmented into paints, coatings, and inks, adhesives and sealants, composites. The coatings application segment will also provide highly beneficial opportunities as it is estimated to account for a major market share of 28.2% in the global landscape. Increasing use of coatings in several industry verticals will bolster growth in this segment through 2029. Epoxy paint thinners are also anticipated to see an increase in demand over the years to come.
Based on end-user, the epoxy curing agents market is segmented into construction, electrical and electronics, power generation, automotive and transportation, marine, others. The demand for construction chemicals and additives has grown as a result of a significant rise in construction activity worldwide. The prevalence of this factor is anticipated to continue in the years to come, and over the forecast period, it is anticipated to propel sales of epoxy curing agents in building applications at a CAGR of 8.6%.
[caption id="attachment_17322" align="aligncenter" width="1920"]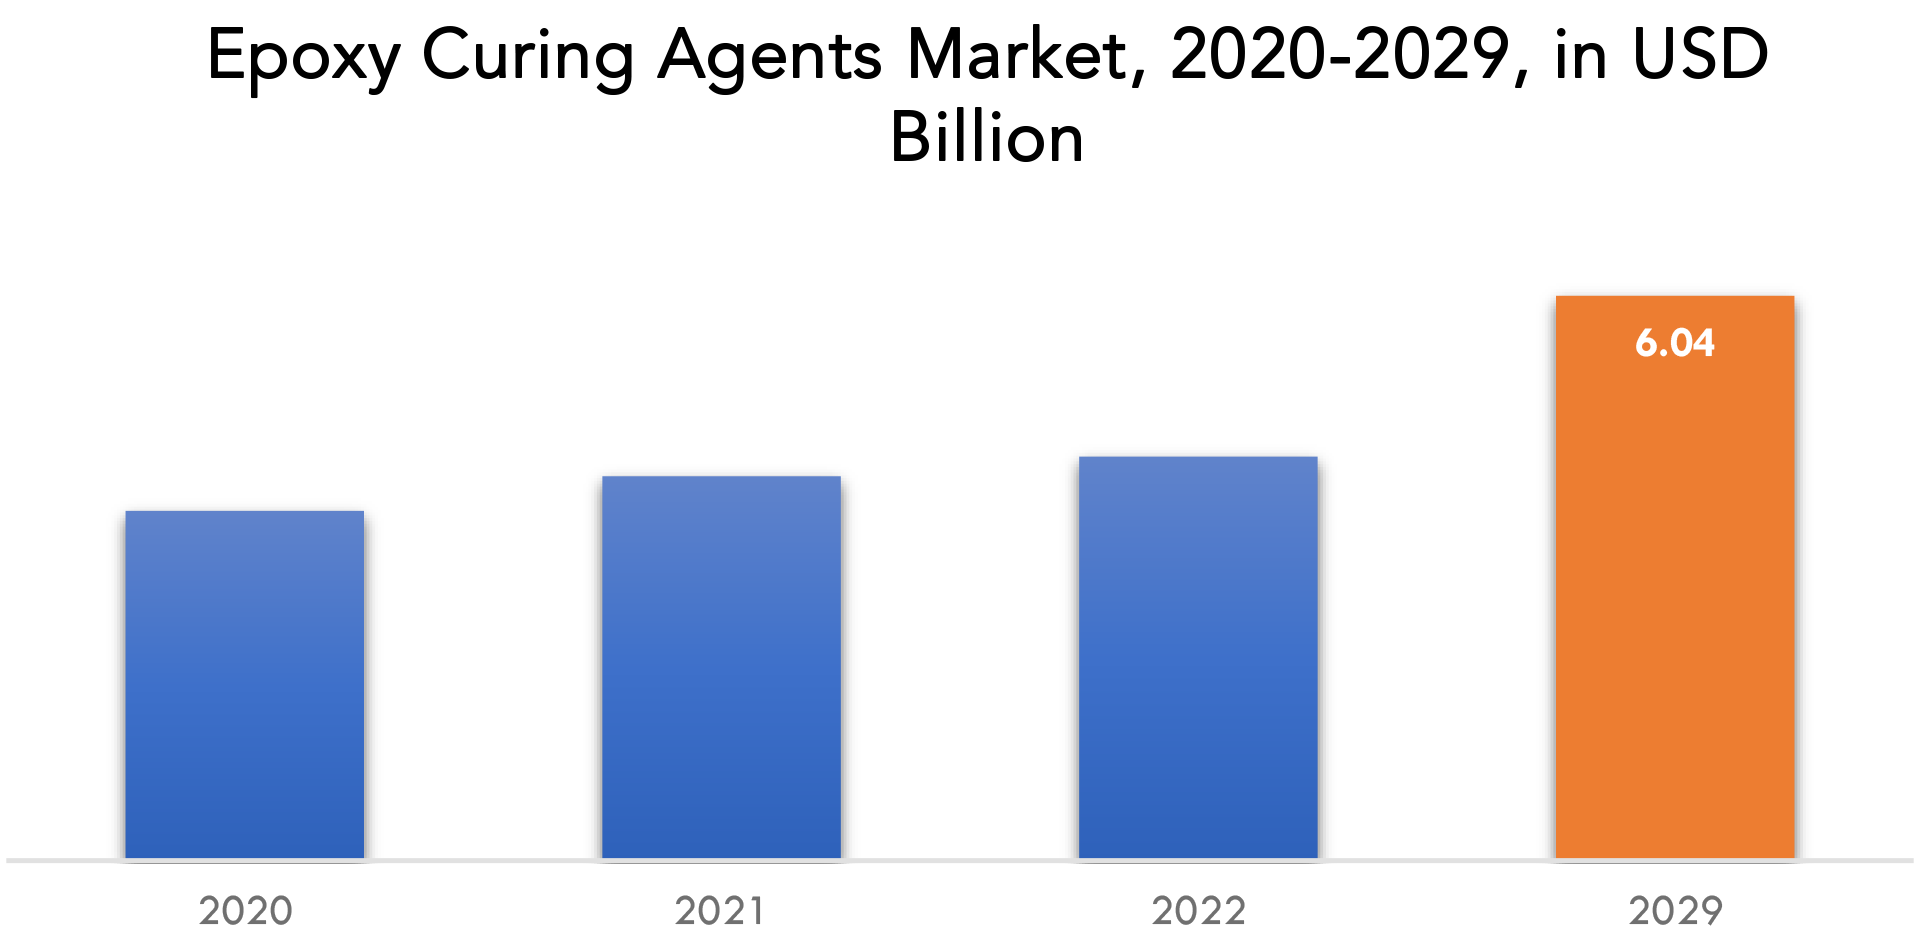
Epoxy curing agents Market Players
The global epoxy curing agents market key players include Atul Ltd, BASF SE, CARDOLITE Corporation, EPOCHEMIE - Epoxy Curing Agents, Epoxy Division Aditya Birla Chemicals (Thailand) Limited (Aditya Birla Group), Evonik Industries, Hexion, Huntsman International LLC, KUKDO Chemical Co. Ltd, Kumho P&B Chemicals Inc., Mitsubishi Chemical Corporation, Olin Corporation, Shandong DEYUAN Epoxy Resin Co. Ltd, Toray Industries Inc., Dow Chemical Company, DIC Corporation, Olin Corporation and others. Recent developments:- January 2022- CARDOLITE Corporation announced New Waterborne Curing Agent for Epoxy Systems. NX-8402 is a new waterborne curing agent for epoxy coatings and adhesives. This epoxy hardener does not contain any solvent and does not require co-solvents to properly form a film. Since this epoxy curing agent is supplied as an emulsion, it can be easily diluted in water as is and after mixing with epoxy resins.
- In January 2021 - Huntsman International LLC completed the acquisition of Gabriel Performance Products, a specialty chemical manufacturer of specialty additives and epoxy curing agents for the coatings, adhesives, and others, from Audax Private Equity.
- April 2022- Huntsman International LLC announced CTS, which offers specialized curing and toughening agents, resin adducts, and other high-performance epoxy resins.
Who Should Buy? Or Key stakeholders
- Regional agencies and research organizations
- Investment research firm
- Construction Companies
- Chemical Companies
- Manufacturing Companies
- Government and Regulatory Bodies
- End –Users
- Research institutes
- Others
Epoxy Curing Agents Market Regional Analysis
The epoxy curing agents market by region includes North America, Asia-Pacific (APAC), Europe, South America, and Middle East & Africa (MEA).
- North America: includes the US, Canada, Mexico
- Asia Pacific: includes China, Japan, South Korea, India, Australia, ASEAN and Rest of APAC
- Europe: includes UK, Germany, France, Italy, Spain, Russia, and Rest of Europe
- South America: includes Brazil, Argentina and Rest of South America
- Middle East & Africa: includes Turkey, UAE, Saudi Arabia, South Africa, and Rest of MEA
The Asia Pacific region held a market share of more than 40% for epoxy curing agents in 2021, due to the region's expanding automotive and aviation sector. The region's automotive and aviation industries are growing as a result of rising per capita revenue and population. Most composite materials have a strength to weight relationship that is superior to that of steel and aluminium. The use of composites is essential in the automotive and aviation industries due to the decreased weight for a given degree of strength.
The demand for epoxy curing agents in North America, which is presently valued at US$ 1.46 billion, is expected to hold a commanding 31.8% market share in the global epoxy curing agents market by 2029. Over the next few years, rising development in the area is anticipated to significantly boost market potential.
Europe is anticipated to develop at a CAGR of 4.12% during the forecast period. Germany, one of the top manufacturing centres for the automotive industry, is home to companies from a variety of industries, including equipment producers, suppliers of materials and components, engine manufacturers, and integrators of complete systems. In order to satisfy the escalating demand in the aviation industry, it is anticipated that over 30-35 thousand new aircraft will enter service over the next 15 years. As a result, it is expected that the market for epoxy curing agents will grow during the projection period alongside an increase in aircraft production.
[caption id="attachment_17324" align="aligncenter" width="1920"]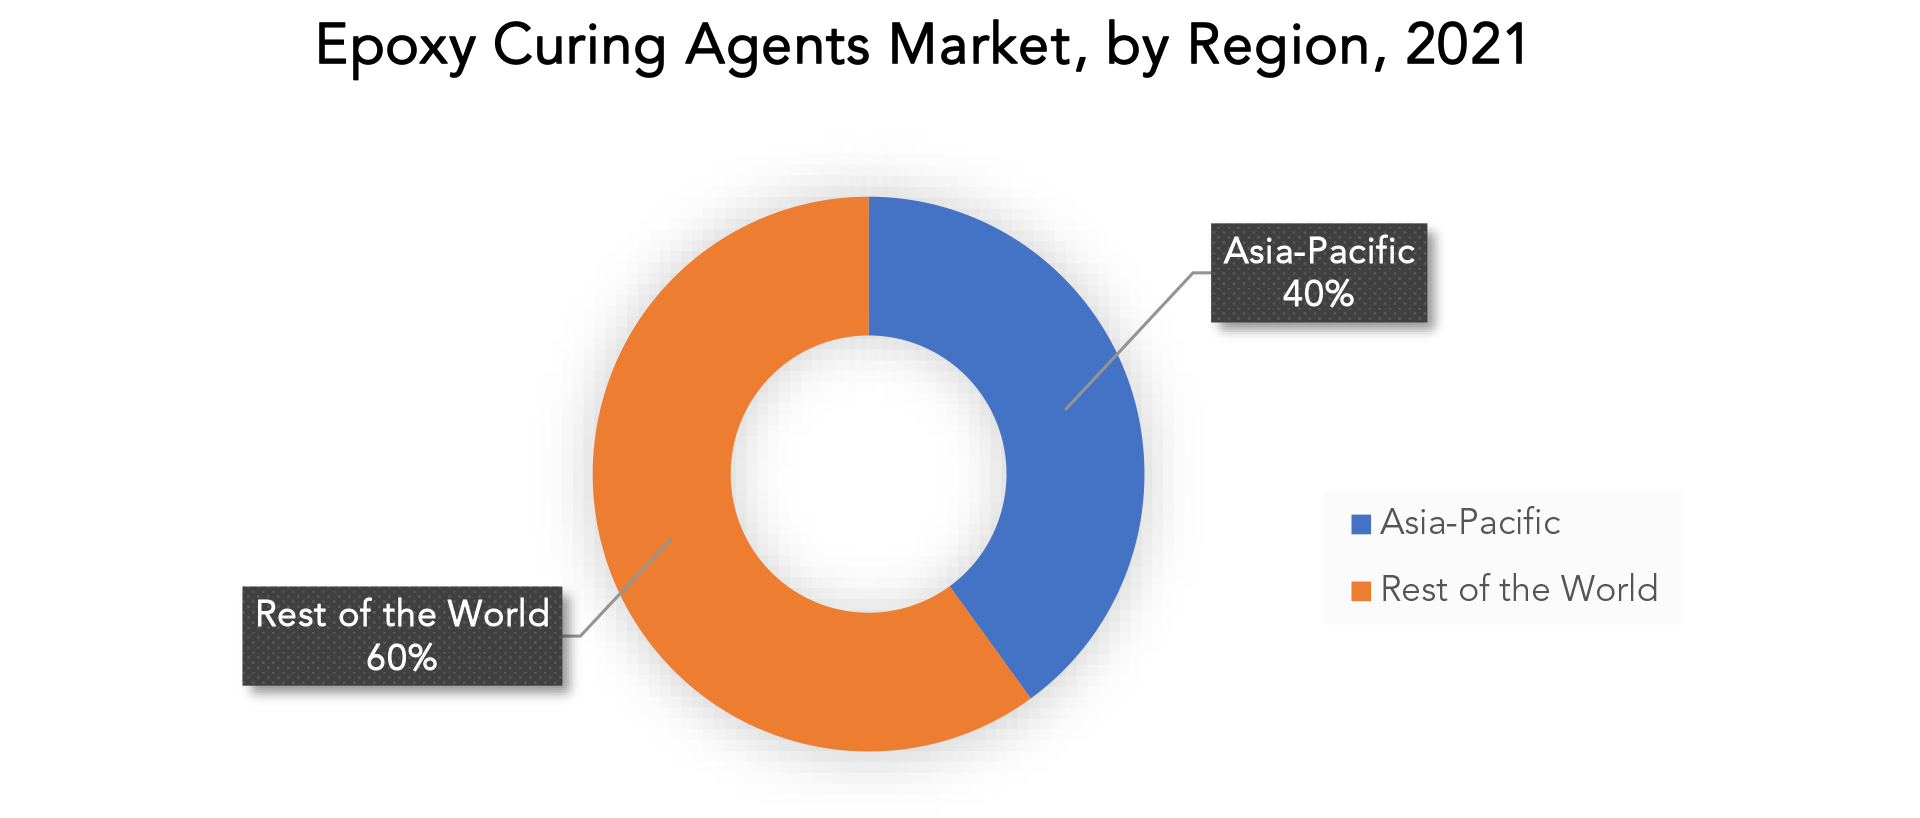
Key Market Segments: Epoxy Curing Agents Market
Epoxy Curing Agents Market By Product, 2020-2029, (Usd Billion) (Kilotons)- Amines And Polyamines
- Amides And Polyamides
- Anhydrides
- Phenolic
- Others
- Paints, Coatings, And Inks
- Adhesives And Sealants
- Composites
- Construction
- Electrical And Electronics
- Power Generation
- Automotive And Transportation
- Marine
- Others
- North America
- Europe
- Asia Pacific
- South America
- Middle East and Africa
Exactitude Consultancy Services Key Objectives:
- Increasing sales and market share
- Developing new technology
- Improving profitability
- Entering new markets
- Enhancing brand reputation
Key Question Answered
- What is the expected growth rate of the epoxy curing agents market over the next 7 years?
- Who are the major players in the epoxy curing agents market and what is their market share?
- What are the end-user industries driving demand for market and what is their outlook?
- What are the opportunities for growth in emerging markets such as Asia-Pacific, Middle East, and Africa?
- How is the economic environment affecting the epoxy curing agents market, including factors such as interest rates, inflation, and exchange rates?
- What is the expected impact of government policies and regulations on the epoxy curing agents market?
- What is the current and forecasted size and growth rate of the global epoxy curing agents market?
- What are the key drivers of growth in the epoxy curing agents market?
- What are the distribution channels and supply chain dynamics in the epoxy curing agents market?
- What are the technological advancements and innovations in the epoxy curing agents market and their impact on product development and growth?
- What are the regulatory considerations and their impact on the market?
- What are the challenges faced by players in the epoxy curing agents market and how are they addressing these challenges?
- What are the opportunities for growth and expansion in the epoxy curing agents market?
- What are the product offerings and specifications of leading players in the market?
- What is the pricing trend of epoxy curing agents in the market and what is the impact of raw material prices on the price trend?
- EINFÜHRUNG
- MARKTDEFINITION
- MARKTSEGMENTIERUNG
- FORSCHUNGSZEITPLAN
- ANNAHMEN UND EINSCHRÄNKUNGEN
- FORSCHUNGSMETHODIK
- DATENMINING
- Sekundärforschung
- PRIMÄRFORSCHUNG
- RAT VON FACHEXPERTEN
- QUALITÄTSPRÜFUNGEN
- ABSCHLIESSENDE ÜBERPRÜFUNG
- DATENTRIANGULATION
- Bottom-Up-Ansatz
- TOP-DOWN-ANSATZ
- FORSCHUNGSABLAUF
- DATENQUELLEN
- DATENMINING
- ZUSAMMENFASSUNG
- MARKTÜBERSICHT
- GLOBALER MARKTAUSBLICK FÜR EPOXY-HÄRTER
- MARKTTREIBER
- Marktbeschränkungen
- Marktchancen
- AUSWIRKUNGEN VON COVID-19 AUF DEN MARKT FÜR EPOXY-HÄRTUNGSMITTEL
- PORTERS FÜNF-KRÄFTE-MODELL
- Bedrohung durch Neueinsteiger
- Bedrohung durch Ersatzprodukte
- Verhandlungsmacht der Lieferanten
- VERHANDLUNGSMACHT DER KUNDEN
- WETTBEWERBSGRAD
- ANALYSE DER BRANCHENWERTSCHÖPFUNGSKETTE
- GLOBALER MARKTAUSBLICK FÜR EPOXY-HÄRTER
- GLOBALER MARKT FÜR EPOXY-HÄRTUNGSMITTEL NACH PRODUKT, 2020–2029, (MRD. USD) (KILOTONS)
- Amine und Polyamine
- AMIDE UND POLYAMIDE
- ANHYDRIDE
- PHENOL
- ANDERE
- GLOBAL EPOXY CURING AGENTS MARKET BY APPLICATION, 2020-2029, (USD BILLION) KILOTONS)
- PAINTS, COATINGS, AND INKS
- ADHESIVES AND SEALANTS
- COMPOSITES
- GLOBAL EPOXY CURING AGENTS MARKET BY END-USER, 2020-2029, (USD BILLION) KILOTONS)
- CONSTRUCTION
- ELECTRICAL AND ELECTRONICS
- POWER GENERATION
- AUTOMOTIVE AND TRANSPORTATION
- MARINE
- OTHERS
- GLOBAL EPOXY CURING AGENTS MARKET BY REGION, 2020-2029, (USD BILLION) KILOTONS)
- NORTH AMERICA
- US
- CANADA
- MEXICO
- SOUTH AMERICA
- BRAZIL
- ARGENTINA
- COLOMBIA
- REST OF SOUTH AMERICA
- EUROPE
- GERMANY
- UK
- FRANCE
- ITALY
- SPAIN
- RUSSIA
- REST OF EUROPE
- ASIA PACIFIC
- INDIA
- CHINA
- JAPAN
- SOUTH KOREA
- AUSTRALIA
- SOUTH-EAST ASIA
- REST OF ASIA PACIFIC
- MIDDLE EAST AND AFRICA
- UAE
- SAUDI ARABIA
- SOUTH AFRICA
- REST OF MIDDLE EAST AND AFRICA
- NORTH AMERICA
- COMPANY PROFILES* (BUSINESS OVERVIEW, COMPANY SNAPSHOT, PRODUCT OFFERED, RECENT DEVELOPMENTS)
9.1. ATUL LTD
9.2. BASF SE
9.3. CARDOLITE CORPORATION
9.4. EPOCHEMIE - EPOXY CURING AGENTS
9.5. EPOXY DIVISION ADITYA BIRLA CHEMICALS
9.6. EVONIK INDUSTRIES
9.7. HEXION
9.8. HUNTSMAN INTERNATIONAL LLC
9.9. KUKDO CHEMICAL CO. LTD
9.10. KUMHO P&B CHEMICALS INC.
9.11. MITSUBISHI CHEMICAL CORPORATION
9.12. OLIN CORPORATION
9.13. SHANDONG DEYUAN EPOXY RESIN CO. LTD
9.14. TORAY INDUSTRIES INC.
9.15. DOW CHEMICAL COMPANY
9.16. DIC CORPORATION
9.17. OLIN CORPORATION*THE COMPANY LIST IS INDICATIVE
LIST OF TABLES
TABLE 1 GLOBAL EPOXY CURING AGENTS MARKET BY PRODUCT (USD BILLION) 2020-2029
TABLE 2 GLOBAL EPOXY CURING AGENTS MARKET BY PRODUCT (KILOTONS) 2020-2029
TABLE 3 GLOBAL EPOXY CURING AGENTS MARKET BY APPLICATION (USD BILLION) 2020-2029
TABLE 4 GLOBAL EPOXY CURING AGENTS MARKET BY APPLICATION (KILOTONS) 2020-2029
TABLE 5 GLOBAL EPOXY CURING AGENTS MARKET BY END-USER (USD BILLION) 2020-2029
TABLE 6 GLOBAL EPOXY CURING AGENTS MARKET BY END-USER (KILOTONS) 2020-2029
TABLE 7 GLOBAL EPOXY CURING AGENTS MARKET BY REGION (USD BILLION) 2020-2029
TABLE 8 GLOBAL EPOXY CURING AGENTS MARKET BY REGION (KILOTONS) 2020-2029
TABLE 9 NORTH AMERICA EPOXY CURING AGENTS MARKET BY PRODUCT (USD BILLION) 2020-2029
TABLE 10 NORTH AMERICA EPOXY CURING AGENTS MARKET BY PRODUCT (KILOTONS) 2020-2029
TABLE 11 NORTH AMERICA EPOXY CURING AGENTS MARKET BY APPLICATION (USD BILLION) 2020-2029
TABLE 12 NORTH AMERICA EPOXY CURING AGENTS MARKET BY APPLICATION (KILOTONS) 2020-2029
TABLE 13 NORTH AMERICA EPOXY CURING AGENTS MARKET BY END-USER (USD BILLION) 2020-2029
TABLE 14 NORTH AMERICA EPOXY CURING AGENTS MARKET BY END-USER (KILOTONS) 2020-2029
TABLE 15 NORTH AMERICA EPOXY CURING AGENTS MARKET BY COUNTRY (USD BILLION) 2020-2029
TABLE 16 NORTH AMERICA EPOXY CURING AGENTS MARKET BY COUNTRY (KILOTONS) 2020-2029
TABLE 17 US EPOXY CURING AGENTS MARKET BY PRODUCT (USD BILLION) 2020-2029
TABLE 18 US EPOXY CURING AGENTS MARKET BY PRODUCT (KILOTONS) 2020-2029
TABLE 19 US EPOXY CURING AGENTS MARKET BY APPLICATION (USD BILLION) 2020-2029
TABLE 20 US EPOXY CURING AGENTS MARKET BY APPLICATION (KILOTONS) 2020-2029
TABLE 21 US EPOXY CURING AGENTS MARKET BY END-USER (USD BILLION) 2020-2029
TABLE 22 US EPOXY CURING AGENTS MARKET BY END-USER (KILOTONS) 2020-2029
TABLE 23 US EPOXY CURING AGENTS MARKET BY REGION (USD BILLION) 2020-2029
TABLE 24 US EPOXY CURING AGENTS MARKET BY REGION (KILOTONS) 2020-2029
TABLE 25 CANADA EPOXY CURING AGENTS MARKET BY PRODUCT (USD BILLION) 2020-2029
TABLE 26 CANADA EPOXY CURING AGENTS MARKET BY PRODUCT (KILOTONS) 2020-2029
TABLE 27 CANADA EPOXY CURING AGENTS MARKET BY APPLICATION (USD BILLION) 2020-2029
TABLE 28 CANADA EPOXY CURING AGENTS MARKET BY APPLICATION (KILOTONS) 2020-2029
TABLE 29 CANADA EPOXY CURING AGENTS MARKET BY END-USER (USD BILLION) 2020-2029
TABLE 30 CANADA EPOXY CURING AGENTS MARKET BY END-USER (KILOTONS) 2020-2029
TABLE 31 CANADA EPOXY CURING AGENTS MARKET BY REGION (USD BILLION) 2020-2029
TABLE 32 CANADA EPOXY CURING AGENTS MARKET BY REGION (KILOTONS) 2020-2029
TABLE 33 MEXICO EPOXY CURING AGENTS MARKET BY PRODUCT (USD BILLION) 2020-2029
TABLE 34 MEXICO EPOXY CURING AGENTS MARKET BY PRODUCT (KILOTONS) 2020-2029
TABLE 35 MEXICO EPOXY CURING AGENTS MARKET BY APPLICATION (USD BILLION) 2020-2029
TABLE 36 MEXICO EPOXY CURING AGENTS MARKET BY APPLICATION (KILOTONS) 2020-2029
TABLE 37 MEXICO EPOXY CURING AGENTS MARKET BY END-USER (USD BILLION) 2020-2029
TABLE 38 MEXICO EPOXY CURING AGENTS MARKET BY END-USER (KILOTONS) 2020-2029
TABLE 39 MEXICO EPOXY CURING AGENTS MARKET BY REGION (USD BILLION) 2020-2029
TABLE 40 MEXICO EPOXY CURING AGENTS MARKET BY REGION (KILOTONS) 2020-2029
TABLE 41 SOUTH AMERICA EPOXY CURING AGENTS MARKET BY PRODUCT (USD BILLION) 2020-2029
TABLE 42 SOUTH AMERICA EPOXY CURING AGENTS MARKET BY PRODUCT (KILOTONS) 2020-2029
TABLE 43 SOUTH AMERICA EPOXY CURING AGENTS MARKET BY APPLICATION (USD BILLION) 2020-2029
TABLE 44 SOUTH AMERICA EPOXY CURING AGENTS MARKET BY APPLICATION (KILOTONS) 2020-2029
TABLE 45 SOUTH AMERICA EPOXY CURING AGENTS MARKET BY END-USER (USD BILLION) 2020-2029
TABLE 46 SOUTH AMERICA EPOXY CURING AGENTS MARKET BY END-USER (KILOTONS) 2020-2029
TABLE 47 SOUTH AMERICA EPOXY CURING AGENTS MARKET BY COUNTRY (USD BILLION) 2020-2029
TABLE 48 SOUTH AMERICA EPOXY CURING AGENTS MARKET BY COUNTRY (KILOTONS) 2020-2029
TABLE 49 BRAZIL EPOXY CURING AGENTS MARKET BY PRODUCT (USD BILLION) 2020-2029
TABLE 50 BRAZIL EPOXY CURING AGENTS MARKET BY PRODUCT (KILOTONS) 2020-2029
TABLE 51 BRAZIL EPOXY CURING AGENTS MARKET BY APPLICATION (USD BILLION) 2020-2029
TABLE 52 BRAZIL EPOXY CURING AGENTS MARKET BY APPLICATION (KILOTONS) 2020-2029
TABLE 53 BRAZIL EPOXY CURING AGENTS MARKET BY END-USER (USD BILLION) 2020-2029
TABLE 54 BRAZIL EPOXY CURING AGENTS MARKET BY END-USER (KILOTONS) 2020-2029
TABLE 55 BRAZIL EPOXY CURING AGENTS MARKET BY REGION (USD BILLION) 2020-2029
TABLE 56 BRAZIL EPOXY CURING AGENTS MARKET BY REGION (KILOTONS) 2020-2029
TABLE 57 ARGENTINA EPOXY CURING AGENTS MARKET BY PRODUCT (USD BILLION) 2020-2029
TABLE 58 ARGENTINA EPOXY CURING AGENTS MARKET BY PRODUCT (KILOTONS) 2020-2029
TABLE 59 ARGENTINA EPOXY CURING AGENTS MARKET BY APPLICATION (USD BILLION) 2020-2029
TABLE 60 ARGENTINA EPOXY CURING AGENTS MARKET BY APPLICATION (KILOTONS) 2020-2029
TABLE 61 ARGENTINA EPOXY CURING AGENTS MARKET BY END-USER (USD BILLION) 2020-2029
TABLE 62 ARGENTINA EPOXY CURING AGENTS MARKET BY END-USER (KILOTONS) 2020-2029
TABLE 63 ARGENTINA EPOXY CURING AGENTS MARKET BY REGION (USD BILLION) 2020-2029
TABLE 64 ARGENTINA EPOXY CURING AGENTS MARKET BY REGION (KILOTONS) 2020-2029
TABLE 65 COLOMBIA EPOXY CURING AGENTS MARKET BY PRODUCT (USD BILLION) 2020-2029
TABLE 66 COLOMBIA EPOXY CURING AGENTS MARKET BY PRODUCT (KILOTONS) 2020-2029
TABLE 67 COLOMBIA EPOXY CURING AGENTS MARKET BY APPLICATION (USD BILLION) 2020-2029
TABLE 68 COLOMBIA EPOXY CURING AGENTS MARKET BY APPLICATION (KILOTONS) 2020-2029
TABLE 69 COLOMBIA EPOXY CURING AGENTS MARKET BY END-USER (USD BILLION) 2020-2029
TABLE 70 COLOMBIA EPOXY CURING AGENTS MARKET BY END-USER (KILOTONS) 2020-2029
TABLE 71 COLOMBIA EPOXY CURING AGENTS MARKET BY REGION (USD BILLION) 2020-2029
TABLE 72 COLOMBIA EPOXY CURING AGENTS MARKET BY REGION (KILOTONS) 2020-2029
TABLE 73 REST OF SOUTH AMERICA EPOXY CURING AGENTS MARKET BY PRODUCT (USD BILLION) 2020-2029
TABLE 74 REST OF SOUTH AMERICA EPOXY CURING AGENTS MARKET BY PRODUCT (KILOTONS) 2020-2029
TABLE 75 REST OF SOUTH AMERICA EPOXY CURING AGENTS MARKET BY APPLICATION (USD BILLION) 2020-2029
TABLE 76 REST OF SOUTH AMERICA EPOXY CURING AGENTS MARKET BY APPLICATION (KILOTONS) 2020-2029
TABLE 77 REST OF SOUTH AMERICA EPOXY CURING AGENTS MARKET BY END-USER (USD BILLION) 2020-2029
TABLE 78 REST OF SOUTH AMERICA EPOXY CURING AGENTS MARKET BY END-USER (KILOTONS) 2020-2029
TABLE 79 REST OF SOUTH AMERICA EPOXY CURING AGENTS MARKET BY REGION (USD BILLION) 2020-2029
TABLE 80 REST OF SOUTH AMERICA EPOXY CURING AGENTS MARKET BY REGION (KILOTONS) 2020-2029
TABLE 81 ASIA-PACIFIC EPOXY CURING AGENTS MARKET BY PRODUCT (USD BILLION) 2020-2029
TABLE 82 ASIA-PACIFIC EPOXY CURING AGENTS MARKET BY PRODUCT (KILOTONS) 2020-2029
TABLE 83 ASIA-PACIFIC EPOXY CURING AGENTS MARKET BY APPLICATION (USD BILLION) 2020-2029
TABLE 84 ASIA-PACIFIC EPOXY CURING AGENTS MARKET BY APPLICATION (KILOTONS) 2020-2029
TABLE 85 ASIA-PACIFIC EPOXY CURING AGENTS MARKET BY END-USER (USD BILLION) 2020-2029
TABLE 86 ASIA-PACIFIC EPOXY CURING AGENTS MARKET BY END-USER (KILOTONS) 2020-2029
TABLE 87 ASIA-PACIFIC EPOXY CURING AGENTS MARKET BY COUNTRY (USD BILLION) 2020-2029
TABLE 88 ASIA-PACIFIC EPOXY CURING AGENTS MARKET BY COUNTRY (KILOTONS) 2020-2029
TABLE 89 INDIA EPOXY CURING AGENTS MARKET BY PRODUCT (USD BILLION) 2020-2029
TABLE 90 INDIA EPOXY CURING AGENTS MARKET BY PRODUCT (KILOTONS) 2020-2029
TABLE 91 INDIA EPOXY CURING AGENTS MARKET BY APPLICATION (USD BILLION) 2020-2029
TABLE 92 INDIA EPOXY CURING AGENTS MARKET BY APPLICATION (KILOTONS) 2020-2029
TABLE 93 INDIA EPOXY CURING AGENTS MARKET BY END-USER (USD BILLION) 2020-2029
TABLE 94 INDIA EPOXY CURING AGENTS MARKET BY END-USER (KILOTONS) 2020-2029
TABLE 95 INDIA EPOXY CURING AGENTS MARKET BY REGION (USD BILLION) 2020-2029
TABLE 96 INDIA EPOXY CURING AGENTS MARKET BY REGION (KILOTONS) 2020-2029
TABLE 97 CHINA EPOXY CURING AGENTS MARKET BY PRODUCT (USD BILLION) 2020-2029
TABLE 98 CHINA EPOXY CURING AGENTS MARKET BY PRODUCT (KILOTONS) 2020-2029
TABLE 99 CHINA EPOXY CURING AGENTS MARKET BY APPLICATION (USD BILLION) 2020-2029
TABLE 100 CHINA EPOXY CURING AGENTS MARKET BY APPLICATION (KILOTONS) 2020-2029
TABLE 101 CHINA EPOXY CURING AGENTS MARKET BY END-USER (USD BILLION) 2020-2029
TABLE 102 CHINA EPOXY CURING AGENTS MARKET BY END-USER (KILOTONS) 2020-2029
TABLE 103 CHINA EPOXY CURING AGENTS MARKET BY REGION (USD BILLION) 2020-2029
TABLE 104 CHINA EPOXY CURING AGENTS MARKET BY REGION (KILOTONS) 2020-2029
TABLE 105 JAPAN EPOXY CURING AGENTS MARKET BY PRODUCT (USD BILLION) 2020-2029
TABLE 106 JAPAN EPOXY CURING AGENTS MARKET BY PRODUCT (KILOTONS) 2020-2029
TABLE 107 JAPAN EPOXY CURING AGENTS MARKET BY APPLICATION (USD BILLION) 2020-2029
TABLE 108 JAPAN EPOXY CURING AGENTS MARKET BY APPLICATION (KILOTONS) 2020-2029
TABLE 109 JAPAN EPOXY CURING AGENTS MARKET BY END-USER (USD BILLION) 2020-2029
TABLE 110 JAPAN EPOXY CURING AGENTS MARKET BY END-USER (KILOTONS) 2020-2029
TABLE 111 JAPAN EPOXY CURING AGENTS MARKET BY REGION (USD BILLION) 2020-2029
TABLE 112 JAPAN EPOXY CURING AGENTS MARKET BY REGION (KILOTONS) 2020-2029
TABLE 113 SOUTH KOREA EPOXY CURING AGENTS MARKET BY PRODUCT (USD BILLION) 2020-2029
TABLE 114 SOUTH KOREA EPOXY CURING AGENTS MARKET BY PRODUCT (KILOTONS) 2020-2029
TABLE 115 SOUTH KOREA EPOXY CURING AGENTS MARKET BY APPLICATION (USD BILLION) 2020-2029
TABLE 116 SOUTH KOREA EPOXY CURING AGENTS MARKET BY APPLICATION (KILOTONS) 2020-2029
TABLE 117 SOUTH KOREA EPOXY CURING AGENTS MARKET BY END-USER (USD BILLION) 2020-2029
TABLE 118 SOUTH KOREA EPOXY CURING AGENTS MARKET BY END-USER (KILOTONS) 2020-2029
TABLE 119 SOUTH KOREA EPOXY CURING AGENTS MARKET BY REGION (USD BILLION) 2020-2029
TABLE 120 SOUTH KOREA EPOXY CURING AGENTS MARKET BY REGION (KILOTONS) 2020-2029
TABLE 121 AUSTRALIA EPOXY CURING AGENTS MARKET BY PRODUCT (USD BILLION) 2020-2029
TABLE 122 AUSTRALIA EPOXY CURING AGENTS MARKET BY PRODUCT (KILOTONS) 2020-2029
TABLE 123 AUSTRALIA EPOXY CURING AGENTS MARKET BY APPLICATION (USD BILLION) 2020-2029
TABLE 124 AUSTRALIA EPOXY CURING AGENTS MARKET BY APPLICATION (KILOTONS) 2020-2029
TABLE 125 AUSTRALIA EPOXY CURING AGENTS MARKET BY END-USER (USD BILLION) 2020-2029
TABLE 126 AUSTRALIA EPOXY CURING AGENTS MARKET BY END-USER (KILOTONS) 2020-2029
TABLE 127 AUSTRALIA EPOXY CURING AGENTS MARKET BY REGION (USD BILLION) 2020-2029
TABLE 128 AUSTRALIA EPOXY CURING AGENTS MARKET BY REGION (KILOTONS) 2020-2029
TABLE 129 SOUTH-EAST ASIA EPOXY CURING AGENTS MARKET BY PRODUCT (USD BILLION) 2020-2029
TABLE 130 SOUTH-EAST ASIA EPOXY CURING AGENTS MARKET BY PRODUCT (KILOTONS) 2020-2029
TABLE 131 SOUTH-EAST ASIA EPOXY CURING AGENTS MARKET BY APPLICATION (USD BILLION) 2020-2029
TABLE 132 SOUTH-EAST ASIA EPOXY CURING AGENTS MARKET BY APPLICATION (KILOTONS) 2020-2029
TABLE 133 SOUTH-EAST ASIA EPOXY CURING AGENTS MARKET BY END-USER (USD BILLION) 2020-2029
TABLE 134 SOUTH-EAST ASIA EPOXY CURING AGENTS MARKET BY END-USER (KILOTONS) 2020-2029
TABLE 135 SOUTH-EAST ASIA EPOXY CURING AGENTS MARKET BY REGION (USD BILLION) 2020-2029
TABLE 136 SOUTH-EAST ASIA EPOXY CURING AGENTS MARKET BY REGION (KILOTONS) 2020-2029
TABLE 137 REST OF ASIA PACIFIC EPOXY CURING AGENTS MARKET BY PRODUCT (USD BILLION) 2020-2029
TABLE 138 REST OF ASIA PACIFIC EPOXY CURING AGENTS MARKET BY PRODUCT (KILOTONS) 2020-2029
TABLE 139 REST OF ASIA PACIFIC EPOXY CURING AGENTS MARKET BY APPLICATION (USD BILLION) 2020-2029
TABLE 140 REST OF ASIA PACIFIC EPOXY CURING AGENTS MARKET BY APPLICATION (KILOTONS) 2020-2029
TABLE 141 REST OF ASIA PACIFIC EPOXY CURING AGENTS MARKET BY END-USER (USD BILLION) 2020-2029
TABLE 142 REST OF ASIA PACIFIC EPOXY CURING AGENTS MARKET BY END-USER (KILOTONS) 2020-2029
TABLE 143 REST OF ASIA PACIFIC EPOXY CURING AGENTS MARKET BY REGION (USD BILLION) 2020-2029
TABLE 144 REST OF ASIA PACIFIC EPOXY CURING AGENTS MARKET BY REGION (KILOTONS) 2020-2029
TABLE 145 ASIA-PACIFIC EPOXY CURING AGENTS MARKET BY PRODUCT (USD BILLION) 2020-2029
TABLE 146 ASIA-PACIFIC EPOXY CURING AGENTS MARKET BY PRODUCT (KILOTONS) 2020-2029
TABLE 147 ASIA-PACIFIC EPOXY CURING AGENTS MARKET BY APPLICATION (USD BILLION) 2020-2029
TABLE 148 ASIA-PACIFIC EPOXY CURING AGENTS MARKET BY APPLICATION (KILOTONS) 2020-2029
TABLE 149 ASIA-PACIFIC EPOXY CURING AGENTS MARKET BY END-USER (USD BILLION) 2020-2029
TABLE 150 ASIA-PACIFIC EPOXY CURING AGENTS MARKET BY END-USER (KILOTONS) 2020-2029
TABLE 151 EUROPE EPOXY CURING AGENTS MARKET BY COUNTRY (USD BILLION) 2020-2029
TABLE 152 EUROPE EPOXY CURING AGENTS MARKET BY COUNTRY (KILOTONS) 2020-2029
TABLE 153 GERMANY EPOXY CURING AGENTS MARKET BY PRODUCT (USD BILLION) 2020-2029
TABLE 154 GERMANY EPOXY CURING AGENTS MARKET BY PRODUCT (KILOTONS) 2020-2029
TABLE 155 GERMANY EPOXY CURING AGENTS MARKET BY APPLICATION (USD BILLION) 2020-2029
TABLE 156 GERMANY EPOXY CURING AGENTS MARKET BY APPLICATION (KILOTONS) 2020-2029
TABLE 157 GERMANY EPOXY CURING AGENTS MARKET BY END-USER (USD BILLION) 2020-2029
TABLE 158 GERMANY EPOXY CURING AGENTS MARKET BY END-USER (KILOTONS) 2020-2029
TABLE 159 GERMANY EPOXY CURING AGENTS MARKET BY REGION (USD BILLION) 2020-2029
TABLE 160 GERMANY EPOXY CURING AGENTS MARKET BY REGION (KILOTONS) 2020-2029
TABLE 161 UK EPOXY CURING AGENTS MARKET BY PRODUCT (USD BILLION) 2020-2029
TABLE 162 UK EPOXY CURING AGENTS MARKET BY PRODUCT (KILOTONS) 2020-2029
TABLE 163 UK EPOXY CURING AGENTS MARKET BY APPLICATION (USD BILLION) 2020-2029
TABLE 164 UK EPOXY CURING AGENTS MARKET BY APPLICATION (KILOTONS) 2020-2029
TABLE 165 UK EPOXY CURING AGENTS MARKET BY END-USER (USD BILLION) 2020-2029
TABLE 166 UK EPOXY CURING AGENTS MARKET BY END-USER (KILOTONS) 2020-2029
TABLE 167 UK EPOXY CURING AGENTS MARKET BY REGION (USD BILLION) 2020-2029
TABLE 168 UK EPOXY CURING AGENTS MARKET BY REGION (KILOTONS) 2020-2029
TABLE 169 FRANCE EPOXY CURING AGENTS MARKET BY PRODUCT (USD BILLION) 2020-2029
TABLE 170 FRANCE EPOXY CURING AGENTS MARKET BY PRODUCT (KILOTONS) 2020-2029
TABLE 171 FRANCE EPOXY CURING AGENTS MARKET BY APPLICATION (USD BILLION) 2020-2029
TABLE 172 FRANCE EPOXY CURING AGENTS MARKET BY APPLICATION (KILOTONS) 2020-2029
TABLE 173 FRANCE EPOXY CURING AGENTS MARKET BY END-USER (USD BILLION) 2020-2029
TABLE 174 FRANCE EPOXY CURING AGENTS MARKET BY END-USER (KILOTONS) 2020-2029
TABLE 175 FRANCE EPOXY CURING AGENTS MARKET BY REGION (USD BILLION) 2020-2029
TABLE 176 FRANCE EPOXY CURING AGENTS MARKET BY REGION (KILOTONS) 2020-2029
TABLE 177 ITALY EPOXY CURING AGENTS MARKET BY PRODUCT (USD BILLION) 2020-2029
TABLE 178 ITALY EPOXY CURING AGENTS MARKET BY PRODUCT (KILOTONS) 2020-2029
TABLE 179 ITALY EPOXY CURING AGENTS MARKET BY APPLICATION (USD BILLION) 2020-2029
TABLE 180 ITALY EPOXY CURING AGENTS MARKET BY APPLICATION (KILOTONS) 2020-2029
TABLE 181 ITALY EPOXY CURING AGENTS MARKET BY END-USER (USD BILLION) 2020-2029
TABLE 182 ITALY EPOXY CURING AGENTS MARKET BY END-USER (KILOTONS) 2020-2029
TABLE 183 ITALY EPOXY CURING AGENTS MARKET BY REGION (USD BILLION) 2020-2029
TABLE 184 ITALY EPOXY CURING AGENTS MARKET BY REGION (KILOTONS) 2020-2029
TABLE 185 SPAIN EPOXY CURING AGENTS MARKET BY PRODUCT (USD BILLION) 2020-2029
TABLE 186 SPAIN EPOXY CURING AGENTS MARKET BY PRODUCT (KILOTONS) 2020-2029
TABLE 187 SPAIN EPOXY CURING AGENTS MARKET BY APPLICATION (USD BILLION) 2020-2029
TABLE 188 SPAIN EPOXY CURING AGENTS MARKET BY APPLICATION (KILOTONS) 2020-2029
TABLE 189 SPAIN EPOXY CURING AGENTS MARKET BY END-USER (USD BILLION) 2020-2029
TABLE 190 SPAIN EPOXY CURING AGENTS MARKET BY END-USER (KILOTONS) 2020-2029
TABLE 191 SPAIN EPOXY CURING AGENTS MARKET BY REGION (USD BILLION) 2020-2029
TABLE 192 SPAIN EPOXY CURING AGENTS MARKET BY REGION (KILOTONS) 2020-2029
TABLE 193 RUSSIA EPOXY CURING AGENTS MARKET BY PRODUCT (USD BILLION) 2020-2029
TABLE 194 RUSSIA EPOXY CURING AGENTS MARKET BY PRODUCT (KILOTONS) 2020-2029
TABLE 195 RUSSIA EPOXY CURING AGENTS MARKET BY APPLICATION (USD BILLION) 2020-2029
TABLE 196 RUSSIA EPOXY CURING AGENTS MARKET BY APPLICATION (KILOTONS) 2020-2029
TABLE 197 RUSSIA EPOXY CURING AGENTS MARKET BY END-USER (USD BILLION) 2020-2029
TABLE 198 RUSSIA EPOXY CURING AGENTS MARKET BY END-USER (KILOTONS) 2020-2029
TABLE 199 RUSSIA EPOXY CURING AGENTS MARKET BY REGION (USD BILLION) 2020-2029
TABLE 200 RUSSIA EPOXY CURING AGENTS MARKET BY REGION (KILOTONS) 2020-2029
TABLE 201 REST OF EUROPE EPOXY CURING AGENTS MARKET BY PRODUCT (USD BILLION) 2020-2029
TABLE 202 REST OF EUROPE EPOXY CURING AGENTS MARKET BY PRODUCT (KILOTONS) 2020-2029
TABLE 203 REST OF EUROPE EPOXY CURING AGENTS MARKET BY APPLICATION (USD BILLION) 2020-2029
TABLE 204 REST OF EUROPE EPOXY CURING AGENTS MARKET BY APPLICATION (KILOTONS) 2020-2029
TABLE 205 REST OF EUROPE EPOXY CURING AGENTS MARKET BY END-USER (USD BILLION) 2020-2029
TABLE 206 REST OF EUROPE EPOXY CURING AGENTS MARKET BY END-USER (KILOTONS) 2020-2029
TABLE 207 REST OF EUROPE EPOXY CURING AGENTS MARKET BY REGION (USD BILLION) 2020-2029
TABLE 208 REST OF EUROPE EPOXY CURING AGENTS MARKET BY REGION (KILOTONS) 2020-2029
TABLE 209 MIDDLE EAST AND AFRICA EPOXY CURING AGENTS MARKET BY PRODUCT (USD BILLION) 2020-2029
TABLE 210 MIDDLE EAST AND AFRICA EPOXY CURING AGENTS MARKET BY PRODUCT (KILOTONS) 2020-2029
TABLE 211 MIDDLE EAST AND AFRICA EPOXY CURING AGENTS MARKET BY APPLICATION (USD BILLION) 2020-2029
TABLE 212 MIDDLE EAST AND AFRICA EPOXY CURING AGENTS MARKET BY APPLICATION (KILOTONS) 2020-2029
TABLE 213 MIDDLE EAST AND AFRICA EPOXY CURING AGENTS MARKET BY END-USER (USD BILLION) 2020-2029
TABLE 214 MIDDLE EAST AND AFRICA EPOXY CURING AGENTS MARKET BY END-USER (KILOTONS) 2020-2029
TABLE 215 MIDDLE EAST AND AFRICA EPOXY CURING AGENTS MARKET BY COUNTRY (USD BILLION) 2020-2029
TABLE 216 MIDDLE EAST AND AFRICA EPOXY CURING AGENTS MARKET BY COUNTRY (KILOTONS) 2020-2029
TABLE 217 UAE EPOXY CURING AGENTS MARKET BY PRODUCT (USD BILLION) 2020-2029
TABLE 218 UAE EPOXY CURING AGENTS MARKET BY PRODUCT (KILOTONS) 2020-2029
TABLE 219 UAE EPOXY CURING AGENTS MARKET BY APPLICATION (USD BILLION) 2020-2029
TABLE 220 UAE EPOXY CURING AGENTS MARKET BY APPLICATION (KILOTONS) 2020-2029
TABLE 221 UAE EPOXY CURING AGENTS MARKET BY END-USER (USD BILLION) 2020-2029
TABLE 222 UAE EPOXY CURING AGENTS MARKET BY END-USER (KILOTONS) 2020-2029
TABLE 223 UAE EPOXY CURING AGENTS MARKET BY REGION (USD BILLION) 2020-2029
TABLE 224 UAE EPOXY CURING AGENTS MARKET BY REGION (KILOTONS) 2020-2029
TABLE 225 SAUDI ARABIA EPOXY CURING AGENTS MARKET BY PRODUCT (USD BILLION) 2020-2029
TABLE 226 SAUDI ARABIA EPOXY CURING AGENTS MARKET BY PRODUCT (KILOTONS) 2020-2029
TABLE 227 SAUDI ARABIA EPOXY CURING AGENTS MARKET BY APPLICATION (USD BILLION) 2020-2029
TABLE 228 SAUDI ARABIA EPOXY CURING AGENTS MARKET BY APPLICATION (KILOTONS) 2020-2029
TABLE 229 SAUDI ARABIA EPOXY CURING AGENTS MARKET BY END-USER (USD BILLION) 2020-2029
TABLE 230 SAUDI ARABIA EPOXY CURING AGENTS MARKET BY END-USER (KILOTONS) 2020-2029
TABLE 231 SAUDI ARABIA EPOXY CURING AGENTS MARKET BY REGION (USD BILLION) 2020-2029
TABLE 232 SAUDI ARABIA EPOXY CURING AGENTS MARKET BY REGION (KILOTONS) 2020-2029
TABLE 233 SOUTH AFRICA EPOXY CURING AGENTS MARKET BY PRODUCT (USD BILLION) 2020-2029
TABLE 234 SOUTH AFRICA EPOXY CURING AGENTS MARKET BY PRODUCT (KILOTONS) 2020-2029
TABLE 235 SOUTH AFRICA EPOXY CURING AGENTS MARKET BY APPLICATION (USD BILLION) 2020-2029
TABLE 236 SOUTH AFRICA EPOXY CURING AGENTS MARKET BY APPLICATION (KILOTONS) 2020-2029
TABLE 237 SOUTH AFRICA EPOXY CURING AGENTS MARKET BY END-USER (USD BILLION) 2020-2029
TABLE 238 SOUTH AFRICA EPOXY CURING AGENTS MARKET BY END-USER (KILOTONS) 2020-2029
TABLE 239 SOUTH AFRICA EPOXY CURING AGENTS MARKET BY REGION (USD BILLION) 2020-2029
TABLE 240 SOUTH AFRICA EPOXY CURING AGENTS MARKET BY REGION (KILOTONS) 2020-2029
TABLE 241 REST OF MIDDLE EAST AND AFRICA EPOXY CURING AGENTS MARKET BY PRODUCT (USD BILLION) 2020-2029
TABLE 242 REST OF MIDDLE EAST AND AFRICA EPOXY CURING AGENTS MARKET BY PRODUCT (KILOTONS) 2020-2029
TABLE 243 REST OF MIDDLE EAST AND AFRICA EPOXY CURING AGENTS MARKET BY APPLICATION (USD BILLION) 2020-2029
TABLE 244 REST OF MIDDLE EAST AND AFRICA EPOXY CURING AGENTS MARKET BY APPLICATION (KILOTONS) 2020-2029
TABLE 245 REST OF MIDDLE EAST AND AFRICA EPOXY CURING AGENTS MARKET BY END-USER (USD BILLION) 2020-2029
TABLE 246 REST OF MIDDLE EAST AND AFRICA EPOXY CURING AGENTS MARKET BY END-USER (KILOTONS) 2020-2029
TABLE 247 REST OF MIDDLE EAST AND AFRICA EPOXY CURING AGENTS MARKET BY REGION (USD BILLION) 2020-2029
TABLE 248 REST OF MIDDLE EAST AND AFRICA EPOXY CURING AGENTS MARKET BY REGION (KILOTONS) 2020-2029
LIST OF FIGURES
FIGURE 1 MARKET DYNAMICS
FIGURE 2 MARKET SEGMENTATION
FIGURE 3 REPORT TIMELINES: YEARS CONSIDERED
FIGURE 4 DATA TRIANGULATION
FIGURE 5 BOTTOM-UP APPROACH
FIGURE 6 TOP-DOWN APPROACH
FIGURE 7 RESEARCH FLOW
FIGURE 8 GLOBAL EPOXY CURING AGENTS MARKET BY TYPE (USD BILLION) 2020-2029
FIGURE 9 GLOBAL EPOXY CURING AGENTS MARKET BY APPLICATION (USD BILLION) 2020-2029
FIGURE 10 GLOBAL EPOXY CURING AGENTS MARKET BY END-USER (USD BILLION) 2020-2029
FIGURE 11 GLOBAL EPOXY CURING AGENTS MARKET BY REGION (USD BILLION) 2020-2029
FIGURE 12 PORTER’S FIVE FORCES MODEL
FIGURE 13 GLOBAL EPOXY CURING AGENTS MARKET BY TYPE (USD BILLION) 2021
FIGURE 14 GLOBAL EPOXY CURING AGENTS MARKET BY APPLICATION (USD BILLION) 2021
FIGURE 15 GLOBAL EPOXY CURING AGENTS MARKET BY END-USER (USD BILLION) 2021
FIGURE 16 GLOBAL EPOXY CURING AGENTS MARKET BY REGION (USD BILLION) 2021
FIGURE 17 NORTH AMERICA EPOXY CURING AGENTS MARKETSNAPSHOT
FIGURE 18 EUROPE EPOXY CURING AGENTS MARKETSNAPSHOT
FIGURE 19 SOUTH AMERICA EPOXY CURING AGENTS MARKETSNAPSHOT
FIGURE 20 ASIA PACIFICEPOXY CURING AGENTS MARKETSNAPSHOT
FIGURE 21 MIDDLE EAST ASIA AND AFRICA EPOXY CURING AGENTS MARKETSNAPSHOT
FIGURE 22 MARKET SHARE ANALYSIS
FIGURE 23 ATUL LTD: COMPANY SNAPSHOT
FIGURE 24 BASF SE: COMPANY SNAPSHOT
FIGURE 25 CARDOLITE CORPORATION: COMPANY SNAPSHOT
FIGURE 26 EPOCHEMIE - EPOXY CURING AGENTS: COMPANY SNAPSHOT
FIGURE 27 EPOXY DIVISION ADITYA BIRLA CHEMICALS: COMPANY SNAPSHOT
FIGURE 28 EVONIK INDUSTRIES: COMPANY SNAPSHOT
FIGURE 29 HEXION: COMPANY SNAPSHOT
FIGURE 30 HUNTSMAN INTERNATIONAL LLC: COMPANY SNAPSHOT
FIGURE 31 KUKDO CHEMICAL CO. LTD: COMPANY SNAPSHOT
FIGURE 32 KUMHO P&B CHEMICALS INC.: COMPANY SNAPSHOT
FIGURE 33 MITSUBISHI CHEMICAL CORPORATION: COMPANY SNAPSHOT
FIGURE 34 OLIN CORPORATION: COMPANY SNAPSHOT
FIGURE 35 SHANDONG DEYUAN EPOXY RESIN CO. LTD: COMPANY SNAPSHOT
FIGURE 36 TORAY INDUSTRIES INC.: COMPANY SNAPSHOT
FIGURE 37 DOW CHEMICAL COMPANY: COMPANY SNAPSHOT
FIGURE 38 DIC CORPORATION: COMPANY SNAPSHOT
FIGURE 39 OLIN CORPORATION: COMPANY SNAPSHOT
FIGURE 40 ANGSTROM ADVANCED: COMPANY SNAPSHOT
FIGURE 41 HUMMINGBIRD SCIENTIFIC: COMPANY SNAPSHOT
DOWNLOAD FREE SAMPLE REPORT
License Type
SPEAK WITH OUR ANALYST
Want to know more about the report or any specific requirement?
WANT TO CUSTOMIZE THE REPORT?
Our Clients Speak
We asked them to research ‘ Equipment market’ all over the world, and their whole arrangement was helpful to us. thehealthanalytics.com insightful analysis and reports contributed to our current analysis and in creating a future strategy. Besides, the te
Yosuke Mitsui
Senior Associate Construction Equipment Sales & Marketing
We asked them to research ‘Equipment market’ all over the world, and their whole arrangement was helpful to us. thehealthanalytics.com insightful analysis and reports contributed to our current analysis and in creating a future strategy. Besides, the te


