

Base Year Value ()
x.x %
x.x %
CAGR ()
x.x %
x.x %
Forecast Year Value ()
x.x %
x.x %
Historical Data Period
Largest Region
Forecast Period
Markt für reaktive Verdünnungsmittel nach Typ (aliphatisch, aromatisch und cycloaliphatisch), Endverbraucher (Bau, Automobil, Elektrik und Elektronik, Windenergie und andere), Anwendung (Farben und Beschichtungen, Verbundwerkstoffe, Klebstoffe und Dichtstoffe und andere (elektrisches Gießen, elektrische Verkapselung und Fasern)) und Region (Nordamerika, Europa, Asien-Pazifik, Südamerika, Naher Osten und Afrika), globale Trends und Prognose von 2022 bis 2029
Instant access to hundreds of data points and trends
- Market estimates from 2014-2029
- Competitive analysis, industry segmentation, financial benchmarks
- Incorporates SWOT, Porter's Five Forces and risk management frameworks
- PDF report or online database with Word, Excel and PowerPoint export options
- 100% money back guarantee
Marktübersicht für reaktive Verdünnungsmittel
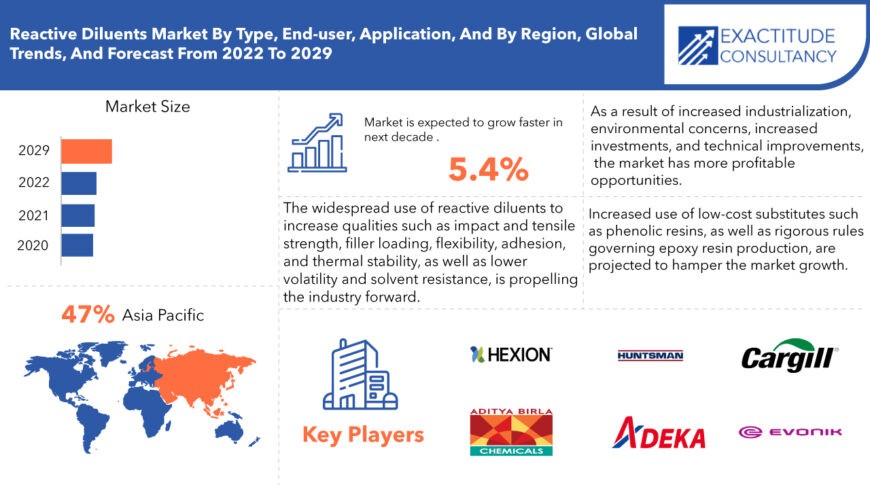
Der weltweite Markt für reaktive Verdünnungsmittel hatte im Jahr 2020 ein Volumen von 952,00 Millionen US-Dollar und soll bis 2029 einen Wert von 1.528,28 Millionen US-Dollar erreichen, was einer durchschnittlichen jährlichen Wachstumsrate (CAGR) von 5,4 % während des Prognosezeitraums entspricht.
Verdünner, auch Reaktivverdünner genannt, werden verwendet, um die Viskosität von Substanzen zu verringern. Sie senken nicht nur die Viskosität, sondern unterstützen auch die Polymerisation der Substanz, der sie zugesetzt werden. Um die Flexibilität und Handhabungseigenschaften des Epoxidharzes zu verbessern, werden regelmäßig Reaktivverdünner verwendet.
Der Reaktivverdünner besteht aus Glycidylethern, die von kurzkettigen aliphatischen Alkylphenolen oder Alkoholen mit niedriger Viskosität abgeleitet sind. Er wird verwendet, um die Viskosität von Epoxidharzen zu senken und sie in einer Vielzahl von Anwendungen leichter handhabbar und verarbeitbar zu machen. Reaktivverdünner verbessern auch Eigenschaften wie Wärmestabilität, Zugfestigkeit, Filterbeladung und Haftung. Epoxidharze werden häufig bei der Herstellung von Beschichtungen, Farben, Verbundwerkstoffen , Klebstoffen und Dichtungsmitteln verwendet . Sowohl lösemittelbasierte als auch wasserbasierte Beschichtungen und Farben erfordern Reaktivverdünner. Die Freisetzung flüchtiger organischer Moleküle wird durch Reaktivverdünner (VOCs) reduziert.
| ATTRIBUT | DETAILS |
| Studiendauer | 2020–2029 |
| Basisjahr | 2021 |
| Geschätztes Jahr | 2022 |
| Voraussichtliches Jahr | 2022–2029 |
| Historischer Zeitraum | 2018-2020 |
| Einheit | Wert (Millionen USD, Kilotonnen) |
| Segmentierung | Nach Typ, nach Endbenutzer, nach Anwendung, nach Region |
| Nach Typ |
|
| Nach Endbenutzer |
|
| Nach Anwendung |
|
| Nach Region |
|
Die steigende Nachfrage nach reaktiven Verdünnungsmitteln in verschiedenen Anwendungsbereichen wie Farben, Lacken und Verbundwerkstoffen ist ein wichtiger Faktor, der das Wachstum dieses potenziellen Marktes in den nächsten 10 Jahren ankurbeln dürfte. Darüber hinaus wird erwartet, dass die steigende Nachfrage nach reaktiven Verdünnungsmitteln bei der Herstellung von Klebstoffen und Dichtstoffen das Umsatzwachstum in diesem potenziellen Markt in den nächsten zehn Jahren ankurbeln wird.
Einer der Hauptfaktoren, die das Wachstum des Marktes für reaktive Verdünnungsmittel vorantreiben, ist die weltweit zunehmende Verwendung von Verbundwerkstoffen . Der weit verbreitete Einsatz reaktiver Verdünnungsmittel zur Verbesserung von Eigenschaften wie Schlag- und Zugfestigkeit, Füllstoffgehalt, Flexibilität, Haftung und thermischer Stabilität sowie geringerer Flüchtigkeit und Lösungsmittelbeständigkeit treibt die Branche voran. Der Markt wird auch durch eine steigende Nachfrage nach dem Produkt in Klebstoffen und Dichtstoffen, Polymeren und Verbundwerkstoffen sowie Farben und Beschichtungen zur Reduzierung der Emissionen flüchtiger organischer Verbindungen (VOC) beeinflusst. Darüber hinaus profitiert der Markt für reaktive Verdünnungsmittel von der raschen Industrialisierung, zunehmenden Umweltbedenken, erhöhten Investitionen und der Expansion des weltweiten Bausektors. Darüber hinaus bieten technologische Fortschritte im Prognosezeitraum von 2022 bis 2029 lukrative Möglichkeiten für Marktteilnehmer.
Andererseits wird erwartet, dass die zunehmende Verwendung kostengünstiger Ersatzstoffe wie Phenolharze sowie strenge Vorschriften für die Herstellung von Epoxidharzen das Marktwachstum bremsen werden. Der Markt für reaktive Verdünnungsmittel wird im Prognosezeitraum 2022–2029 voraussichtlich durch die unvorhersehbare Preisgestaltung bei Epoxidharz-Rohstoffen vor Herausforderungen gestellt werden.
Darüber hinaus dürfte die steigende Nachfrage nach reaktiven Verdünnungsmitteln aus der Automobil-, Bau- und Schifffahrtsindustrie das Wachstum des Zielmarktes im Prognosezeitraum vorantreiben. Weitere Faktoren, die das Wachstum des potenziellen Marktes ankurbeln sollen, sind die steigende Nachfrage nach Materialien mit hoher mechanischer Festigkeit, Korrosionsbeständigkeit und Leichtgewichtseigenschaften sowie erhöhte Investitionen in Forschung und Entwicklung und die Entwicklung innovativer Produkte.
Allerdings dürften die zunehmende Verwendung kostengünstiger Ersatzstoffe wie Phenolharze sowie strenge gesetzliche Vorschriften für die Verwendung von Epoxidharzen das Wachstum des Weltmarktes in gewissem Maße begrenzen.
[Bildunterschrift id="attachment_8086" align="aligncenter" width="870"]
Frequently Asked Questions
• What is the worth of global reactive diluents market?
The reactive diluents market size had crossed USD 952.00 Million in 2020 and will observe a CAGR of more than 5.4% up to 2029 driven by the increased use of composite materials and increase in demand for the product in adhesives and sealants, polymers, and composites, and paints and coatings.
• What is the size of the Asia Pacific reactive diluents industry?
The Asia Pacific held more than 47% of the reactive diluents market revenue share in 2020 and will witness expansion as the rising of various end-use industries, including construction, automotive, electrical & electronics, and wind energy, and the technological development of reactive diluents accelerates in countries, including China, Japan, India, and Australia.
• What are the upcoming trends in the reactive diluents market, globally?
The upcoming trends are likely rising demand for reactive diluent from the automotive, building & construction, and marine industries boosting market expansion during the projection period
• What is the CAGR of the reactive diluents market?
The global reactive diluents market registered a CAGR of 5.4% from 2022 to 2029. Based on type, the aliphatic type of reactive diluent segment is expected to have the biggest market segment was the highest revenue contributor to the market.
• Which are the top companies to hold the market share in the reactive diluents market?
Key players profiled in the report include Hexion, Huntsman Corporation, Kukdo Chemica, Aditya Birla Chemicals, Evonik Industries, R. Coats Inks and Resin Pvt. Ltd, Adeka Corporation, Mercury Synthetic Resins, Grasim Industries Ltd., Cargill, Olin Corporation, ASH Chem, Admark Polycoats Pvt Ltd, Champion Adva Mat Private Limited, Hindusthan Speciality Chemicals Limited, Dhingra Plastic, And Plasticisers Private Limited
• What is the leading application of the reactive diluents market?
The paints and coatings category application segment is also a major driver segment of the global reactive diluents market.
• Which is the largest regional market for reactive diluents market?
Asia Pacific is accounted for the highest share of the global reactive diluents market.
Reactive diluents Market Segment Analysis
The global reactive diluents market is segmented based on type, end-user, application, and region. By type, the market is classified into aliphatic, aromatic, and cycloaliphatic. By end-user, it is divided into construction, automotive, electrical & electronics, wind energy, and others. By application, it is divided into paints & coatings, composites, adhesives & sealants, and others (electrical casting, electrical encapsulation, and fibers).
By type, the aliphatic type of reactive diluent had the highest market share of 47.0 percent in 2018 and is expected to grow at the fastest rate of 5.1 percent over the projected period. The extensive use of this category across end-user sectors ranging from the automotive to the construction industries has resulted in its high market share. Because this sort of reactive diluent has a high impact strength and is regarded as an effective diluent, it is widely used in a variety of sectors. In addition, when compared to other types of reactive diluents, the segment's growth rate is aided by its simple manufacturing process and lower raw material costs. During the forecast period, the aromatic type is expected to grow at a significant rate. It is estimated to account for almost 32.0 percent of the market by 2029, with a CAGR of 5.4 percent over the forecast period. Its increasing popularity among end-user industries, such as the construction industry, is attributed to characteristics such as effective chemical resistance. Because of the aforementioned characteristics, it is suitable for application in a variety of end-user sectors, and the expansion of these industries is increasing demand.
By end-user, automobile and construction sectors are two examples of end-user industries that are constantly growing. The growth of the aforementioned end-user sectors is driving up demand for coatings and paintings to protect against the elements while also improving aesthetic appeal. The expansion of the reactive diluent market is aided by the increase in demand for coatings and paintings.
By application, the paints and coatings category led the global market with a share of about 40% in 2019 and is expected to continue dominating the market over the forecast period. In an emerging country, this growth is attributable to increased residential and commercial activities. Furthermore, the rising demand for environmentally friendly and solvent-free anti-corrosive coatings, as well as UV curable coatings and inks, would drive the worldwide reactive diluent market share throughout the projection period.
[caption id="attachment_8087" align="alignnone" width="680"]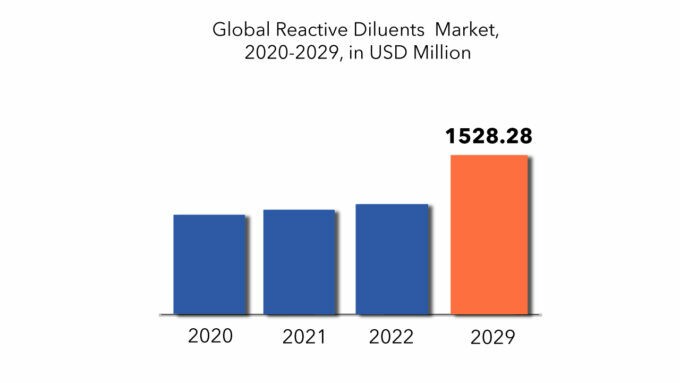
Reactive diluents Market Players
The reactive diluents market key players include Hexion, Huntsman Corporation, Kukdo Chemica, Aditya Birla Chemicals, Evonik Industries, R. Coats Inks and Resin Pvt. Ltd, Adeka Corporation, Mercury Synthetic Resins, Grasim Industries Ltd., Cargill, Olin Corporation, ASH Chem, Admark Polycoats Pvt Ltd, Champion Adva Mat Private Limited, Hindusthan Speciality Chemicals Limited, Dhingra Plastic, And Plasticisers Private Limited. To increase their market position, these businesses have implemented a variety of growth tactics. These companies are using expansion, new product development, mergers and acquisitions, and collaboration as important growth strategies to improve their product portfolio and geographical presence in order to meet the rising demand for reactive diluents from emerging economies. Industry News:- In December 2021: The Bodo Möller Chemie Group, a market leader in reactive diluents, announced that it is strengthening its partnership with Imerys, a French mining company which is a global pioneer in mineral-based speciality solutions for industry.
- In February 2020, Huntsman launched a snap cure VITROX RTM 00410 resin. This new resin will help in the high-volume manufacturing of lightweight and cost-effective composite parts. This new development will help the company meet the customer needs in the composites industry.
Who Should Buy? Or Key stakeholders
- Structural analysis
- Product industries.
- Leading companies.
- Institutional & retail players.
- Investment research firms
- Others
Reactive diluents Market Regional Analysis
The reactive diluents market by region includes North America, Asia-Pacific (APAC), Europe, South America, and Middle East & Africa (MEA).- North America: includes the US, Canada, Mexico
- Asia Pacific: includes China, Japan, South Korea, India, Australia, ASEAN and Rest of APAC
- Europe: includes UK, Germany, France, Italy, Spain, Russia, and Rest of Europe
- South America: includes Brazil, Argentina and Rest of South America
- Middle East & Africa: includes Turkey, UAE, Saudi Arabia, South Africa, and Rest of MEA
The Asia Pacific is accounted for the highest share of the global reactive diluents market. During the projection period, Asia-Pacific is expected to be the largest and fastest-growing market for reactive diluents, with China, Japan, India, and Australia being the prominent nations with promising growth prospects. The rise of various end-use industries, including construction, automotive, electrical & electronics, and wind-energy, is driving the market, which is producing massive demand for reactive diluents and a big number of reactive diluents manufacturers in the Asia-Pacific region. During the projected period, North America and Europe are expected to offer significant growth prospects.
With a market share of more than 43% in 2019, APAC dominated the reactive diluents market, followed by North America and Europe. The APAC area's growth is linked to expanding transportation, urbanization, and population, as well as a substantial industrial base throughout the region. Furthermore, the rising renewable energy sector, especially solar and wind energy, in emerging economies of APAC, including China, India, and South Korea, would boost the expansion of the reactive diluent market business in APAC during the projection period, owing to the abundance of sunshine.
[caption id="attachment_8088" align="alignnone" width="680"]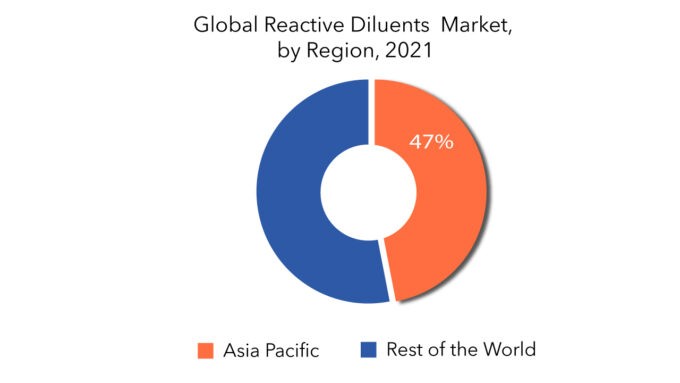
Key Market Segments: Reactive Diluent Market
Global Reactive Diluents Market By Type, 2020-2029, (USD Million), (Kilotons)- Aliphatic
- Aromatic
- Cycloaliphatic
- Construction
- Automotive
- Electrical & Electronics
- Wind-Energy
- Others
- Paints & Coatings
- Composites
- Adhesives & Sealants
- Others (Electrical Casting, Electrical Encapsulation, And Fibres)
- North America
- Europe
- Asia Pacific
- South America
- Middle East And Africa
Key Question Answered
- What is the current size of the reactive diluents market?
- What are the key factors influencing the growth of reactive diluents?
- What are the major applications for reactive diluents?
- Who are the major key players in the reactive diluents market?
- Which region will provide more business opportunities for the reactive diluents’ future?
- Which segment holds the maximum share of the reactive diluents market?
- EINFÜHRUNG
- MARKTDEFINITION
- MARKTSEGMENTIERUNG
- FORSCHUNGSZEITPLAN
- ANNAHMEN UND EINSCHRÄNKUNGEN
- FORSCHUNGSMETHODIK
- DATENMINING
- Sekundärforschung
- PRIMÄRFORSCHUNG
- RAT VON FACHEXPERTEN
- QUALITÄTSPRÜFUNGEN
- ABSCHLIESSENDE ÜBERPRÜFUNG
- DATENTRIANGULATION
- Bottom-Up-Ansatz
- TOP-DOWN-ANSATZ
- FORSCHUNGSABLAUF
- DATENQUELLEN
- DATENMINING
- ZUSAMMENFASSUNG
- MARKTÜBERSICHT
- GLOBALER MARKTAUSBLICK FÜR REAKTIVE VERDÜNNER
- MARKTTREIBER
- Marktbeschränkungen
- Marktchancen
- AUSWIRKUNGEN VON COVID-19 AUF DEN WELTWEITEN MARKT FÜR REAKTIVE VERDÜNNER
- GLOBALER MARKTAUSBLICK FÜR REAKTIVE VERDÜNNER
- GLOBALER MARKT FÜR REAKTIVE VERDÜNNER NACH TYP, (MIO. USD) (KILOTONS)
- ALIPHATISCH
- AROMATISCH
- CYCLOALIPHATISCH
- GLOBALER MARKT FÜR REAKTIVE VERDÜNNER NACH ENDVERWENDER (MIO. USD) (KILOTONS)
- KONSTRUKTION
- AUTOMOBIL
- ELEKTRIK & ELEKTRONIK
- WINDENERGIE
- ANDERE
- GLOBALER MARKT FÜR REAKTIVE VERDÜNNER NACH ANWENDUNG (MIO. USD) (KILOTON)
- FARBEN & BESCHICHTUNGEN
- Verbundwerkstoffe
- ADHESIVES & SEALANTS
- OTHERS (ELECTRICAL CASTING, ELECTRICAL ENCAPSULATION, AND FIBRES)
- GLOBAL REACTIVE DILUENTS MARKET BY REGION, (USD MILLION) (KILOTONS)
- INTRODUCTION
- ASIA-PACIFIC
- CHINA
- INDIA
- JAPAN
- SOUTH KOREA
- AUSTRALIA
- SOUTH-EAST ASIA
- REST OF ASIA-PACIFIC
- NORTH AMERICA
- UNITED STATES
- CANADA
- MEXICO
- EUROPE
- GERMANY
- UNITED KINGDOM
- FRANCE
- ITALY
- SPAIN
- RUSSIA
- REST OF EUROPE
- SOUTH AMERICA
- BRAZIL
- ARGENTINA
- COLOMBIA
- REST OF SOUTH AMERICA
- MIDDLE EAST AND AFRICA
- UAE
- SAUDI ARABIA
- SOUTH AFRICA
- REST OF MIDDLE EAST AND AFRICA
- COMPANY PROFILES* (BUSINESS OVERVIEW, COMPANY SNAPSHOT, TYPES OFFERED, RECENT DEVELOPMENTS)
- HEXION
- HUNTSMAN CORPORATION
- KUKDO CHEMICAL
- ADITYA BIRLA CHEMICALS
- EVONIK INDUSTRIES
- COATS INKS AND RESIN PVT. LTD
- ADEKA CORPORATION
- MERCURY SYNTHETIC RESINS
- GRASIM INDUSTRIES LTD.
- CARGILL
- OLIN CORPORATION
- ASH CHEM
- ADMARK POLYCOATS PVT LTD
- CHAMPION ADVA MAT PRIVATE LIMITED
- HINDUSTHAN SPECIALITY CHEMICALS LIMITED,
- DHINGRA PLASTIC AND PLASTISCISERS PRIVATE LIMITED (BUSINESS OVERVIEW, COMPANY SNAPSHOT, TYPES OFFERED, RECENT DEVELOPMENTS) *THE COMPANY LIST IS INDICATIVE
LIST OF TABLES
TABLE 1 GLOBAL REACTIVE DILUENTS MARKET BY TYPE (USD MILLIONS) 2020-2029
TABLE 2 GLOBAL REACTIVE DILUENTS MARKET BY TYPE (KILOTONS) 2020-2029
TABLE 3 GLOBAL REACTIVE DILUENTS MARKET BY END-USER (USD MILLIONS) 2020-2029
TABLE 4 GLOBAL REACTIVE DILUENTS MARKET BY END-USER (KILOTONS) 2020-2029
TABLE 5 GLOBAL REACTIVE DILUENTS MARKET BY APPLICATION (USD MILLIONS) 2020-2029
TABLE 6 GLOBAL REACTIVE DILUENTS MARKET BY APPLICATION (KILOTONS) 2020-2029
TABLE 7 GLOBAL REACTIVE DILUENTS MARKET BY REGION (USD MILLIONS) 2020-2029
TABLE 8 GLOBAL REACTIVE DILUENTS MARKET BY REGION (KILOTONS) 2020-2029
TABLE 9 NORTH AMERICA REACTIVE DILUENTS MARKET BY COUNTRY (USD MILLIONS) 2020-2029
TABLE 10 NORTH AMERICA REACTIVE DILUENTS MARKET BY COUNTRY (KILOTONS) 2020-2029
TABLE 11 US REACTIVE DILUENTS MARKET BY TYPE (USD MILLIONS) 2020-2029
TABLE 12 US REACTIVE DILUENTS MARKET BY TYPE (KILOTONS) 2020-2029
TABLE 13 US REACTIVE DILUENTS MARKET BY END-USER (USD MILLIONS) 2020-2029
TABLE 14 US REACTIVE DILUENTS MARKET BY END-USER (KILOTONS) 2020-2029
TABLE 15 US REACTIVE DILUENTS MARKET BY APPLICATION (USD MILLIONS) 2020-2029
TABLE 16 US REACTIVE DILUENTS MARKET BY APPLICATION (KILOTONS) 2020-2029
TABLE 17 CANADA REACTIVE DILUENTS MARKET BY TYPE (USD MILLIONS) 2020-2029
TABLE 18 CANADA REACTIVE DILUENTS MARKET BY TYPE (KILOTONS) 2020-2029
TABLE 19 CANADA REACTIVE DILUENTS MARKET BY END-USER (USD MILLIONS) 2020-2029
TABLE 20 CANADA REACTIVE DILUENTS MARKET BY END-USER (KILOTONS) 2020-2029
TABLE 21 CANADA REACTIVE DILUENTS MARKET BY APPLICATION (USD MILLIONS) 2020-2029
TABLE 22 CANADA REACTIVE DILUENTS MARKET BY APPLICATION (KILOTONS) 2020-2029
TABLE 23 MEXICO REACTIVE DILUENTS MARKET BY TYPE (USD MILLIONS) 2020-2029
TABLE 24 MEXICO REACTIVE DILUENTS MARKET BY TYPE (KILOTONS) 2020-2029
TABLE 25 MEXICO REACTIVE DILUENTS MARKET BY END-USER (USD MILLIONS) 2020-2029
TABLE 26 MEXICO REACTIVE DILUENTS MARKET BY END-USER (KILOTONS) 2020-2029
TABLE 27 MEXICO REACTIVE DILUENTS MARKET BY APPLICATION (USD MILLIONS) 2020-2029
TABLE 28 MEXICO REACTIVE DILUENTS MARKET BY APPLICATION (KILOTONS) 2020-2029
TABLE 29 SOUTH AMERICA REACTIVE DILUENTS MARKET BY COUNTRY (USD MILLIONS) 2020-2029
TABLE 30 SOUTH AMERICA REACTIVE DILUENTS MARKET BY COUNTRY (KILOTONS) 2020-2029
TABLE 31 BRAZIL REACTIVE DILUENTS MARKET BY TYPE (USD MILLIONS) 2020-2029
TABLE 32 BRAZIL REACTIVE DILUENTS MARKET BY TYPE (KILOTONS) 2020-2029
TABLE 33 BRAZIL REACTIVE DILUENTS MARKET BY END-USER (USD MILLIONS) 2020-2029
TABLE 34 BRAZIL REACTIVE DILUENTS MARKET BY END-USER (KILOTONS) 2020-2029
TABLE 35 BRAZIL REACTIVE DILUENTS MARKET BY APPLICATION (USD MILLIONS) 2020-2029
TABLE 36 BRAZIL REACTIVE DILUENTS MARKET BY APPLICATION (KILOTONS) 2020-2029
TABLE 37 ARGENTINA REACTIVE DILUENTS MARKET BY TYPE (USD MILLIONS) 2020-2029
TABLE 38 ARGENTINA REACTIVE DILUENTS MARKET BY TYPE (KILOTONS) 2020-2029
TABLE 39 ARGENTINA REACTIVE DILUENTS MARKET BY END-USER (USD MILLIONS) 2020-2029
TABLE 40 ARGENTINA REACTIVE DILUENTS MARKET BY END-USER (KILOTONS) 2020-2029
TABLE 41 ARGENTINA REACTIVE DILUENTS MARKET BY APPLICATION (USD MILLIONS) 2020-2029
TABLE 42 ARGENTINA REACTIVE DILUENTS MARKET BY APPLICATION (KILOTONS) 2020-2029
TABLE 43 COLOMBIA REACTIVE DILUENTS MARKET BY TYPE (USD MILLIONS) 2020-2029
TABLE 44 COLOMBIA REACTIVE DILUENTS MARKET BY TYPE (KILOTONS) 2020-2029
TABLE 45 COLOMBIA REACTIVE DILUENTS MARKET BY END-USER (USD MILLIONS) 2020-2029
TABLE 46 COLOMBIA REACTIVE DILUENTS MARKET BY END-USER (KILOTONS) 2020-2029
TABLE 47 COLOMBIA REACTIVE DILUENTS MARKET BY APPLICATION (USD MILLIONS) 2020-2029
TABLE 48 COLOMBIA REACTIVE DILUENTS MARKET BY APPLICATION (KILOTONS) 2020-2029
TABLE 49 REST OF SOUTH AMERICA REACTIVE DILUENTS MARKET BY TYPE (USD MILLIONS) 2020-2029
TABLE 50 REST OF SOUTH AMERICA REACTIVE DILUENTS MARKET BY TYPE (KILOTONS) 2020-2029
TABLE 51 REST OF SOUTH AMERICA REACTIVE DILUENTS MARKET BY END-USER (USD MILLIONS) 2020-2029
TABLE 52 REST OF SOUTH AMERICA REACTIVE DILUENTS MARKET BY END-USER (KILOTONS) 2020-2029
TABLE 53 REST OF SOUTH AMERICA REACTIVE DILUENTS MARKET BY APPLICATION (USD MILLIONS) 2020-2029
TABLE 54 REST OF SOUTH AMERICA REACTIVE DILUENTS MARKET BY APPLICATION (KILOTONS) 2020-2029
TABLE 55 ASIA-PACIFIC REACTIVE DILUENTS MARKET BY COUNTRY (USD MILLIONS) 2020-2029
TABLE 56 ASIA-PACIFIC REACTIVE DILUENTS MARKET BY COUNTRY (KILOTONS) 2020-2029
TABLE 57 INDIA REACTIVE DILUENTS MARKET BY TYPE (USD MILLIONS) 2020-2029
TABLE 58 INDIA REACTIVE DILUENTS MARKET BY TYPE (KILOTONS) 2020-2029
TABLE 59 INDIA REACTIVE DILUENTS MARKET BY END-USER (USD MILLIONS) 2020-2029
TABLE 60 INDIA REACTIVE DILUENTS MARKET BY END-USER (KILOTONS) 2020-2029
TABLE 61 INDIA REACTIVE DILUENTS MARKET BY APPLICATION (USD MILLIONS) 2020-2029
TABLE 62 INDIA REACTIVE DILUENTS MARKET BY APPLICATION (KILOTONS) 2020-2029
TABLE 63 CHINA REACTIVE DILUENTS MARKET BY TYPE (USD MILLIONS) 2020-2029
TABLE 64 CHINA REACTIVE DILUENTS MARKET BY TYPE (KILOTONS) 2020-2029
TABLE 65 CHINA REACTIVE DILUENTS MARKET BY END-USER (USD MILLIONS) 2020-2029
TABLE 66 CHINA REACTIVE DILUENTS MARKET BY END-USER (KILOTONS) 2020-2029
TABLE 67 CHINA REACTIVE DILUENTS MARKET BY APPLICATION (USD MILLIONS) 2020-2029
TABLE 68 CHINA REACTIVE DILUENTS MARKET BY APPLICATION (KILOTONS) 2020-2029
TABLE 69 JAPAN REACTIVE DILUENTS MARKET BY TYPE (USD MILLIONS) 2020-2029
TABLE 70 JAPAN REACTIVE DILUENTS MARKET BY TYPE (KILOTONS) 2020-2029
TABLE 71 JAPAN REACTIVE DILUENTS MARKET BY END-USER (USD MILLIONS) 2020-2029
TABLE 72 JAPAN REACTIVE DILUENTS MARKET BY END-USER (KILOTONS) 2020-2029
TABLE 73 JAPAN REACTIVE DILUENTS MARKET BY APPLICATION (USD MILLIONS) 2020-2029
TABLE 74 JAPAN REACTIVE DILUENTS MARKET BY APPLICATION (KILOTONS) 2020-2029
TABLE 75 SOUTH KOREA REACTIVE DILUENTS MARKET BY TYPE (USD MILLIONS) 2020-2029
TABLE 76 SOUTH KOREA REACTIVE DILUENTS MARKET BY TYPE (KILOTONS) 2020-2029
TABLE 77 SOUTH KOREA REACTIVE DILUENTS MARKET BY END-USER (USD MILLIONS) 2020-2029
TABLE 78 SOUTH KOREA REACTIVE DILUENTS MARKET BY END-USER (KILOTONS) 2020-2029
TABLE 79 SOUTH KOREA REACTIVE DILUENTS MARKET BY APPLICATION (USD MILLIONS) 2020-2029
TABLE 80 SOUTH KOREA REACTIVE DILUENTS MARKET BY APPLICATION (KILOTONS) 2020-2029
TABLE 81 AUSTRALIA REACTIVE DILUENTS MARKET BY TYPE (USD MILLIONS) 2020-2029
TABLE 82 AUSTRALIA REACTIVE DILUENTS MARKET BY TYPE (KILOTONS) 2020-2029
TABLE 83 AUSTRALIA REACTIVE DILUENTS MARKET BY END-USER (USD MILLIONS) 2020-2029
TABLE 84 AUSTRALIA REACTIVE DILUENTS MARKET BY END-USER (KILOTONS) 2020-2029
TABLE 85 AUSTRALIA REACTIVE DILUENTS MARKET BY APPLICATION (USD MILLIONS) 2020-2029
TABLE 86 AUSTRALIA REACTIVE DILUENTS MARKET BY APPLICATION (KILOTONS) 2020-2029
TABLE 87 SOUTH-EAST ASIA REACTIVE DILUENTS MARKET BY TYPE (USD MILLIONS) 2020-2029
TABLE 88 SOUTH-EAST ASIA REACTIVE DILUENTS MARKET BY TYPE (KILOTONS) 2020-2029
TABLE 89 SOUTH-EAST ASIA REACTIVE DILUENTS MARKET BY END-USER (USD MILLIONS) 2020-2029
TABLE 90 SOUTH-EAST ASIA REACTIVE DILUENTS MARKET BY END-USER (KILOTONS) 2020-2029
TABLE 91 SOUTH-EAST ASIA REACTIVE DILUENTS MARKET BY APPLICATION (USD MILLIONS) 2020-2029
TABLE 92 SOUTH-EAST ASIA REACTIVE DILUENTS MARKET BY APPLICATION (KILOTONS) 2020-2029
TABLE 93 REST OF ASIA PACIFIC REACTIVE DILUENTS MARKET BY TYPE (USD MILLIONS) 2020-2029
TABLE 94 REST OF ASIA PACIFIC REACTIVE DILUENTS MARKET BY TYPE (KILOTONS) 2020-2029
TABLE 95 REST OF ASIA PACIFIC REACTIVE DILUENTS MARKET BY END-USER (USD MILLIONS) 2020-2029
TABLE 96 REST OF ASIA PACIFIC REACTIVE DILUENTS MARKET BY END-USER (KILOTONS) 2020-2029
TABLE 97 REST OF ASIA PACIFIC REACTIVE DILUENTS MARKET BY APPLICATION (USD MILLIONS) 2020-2029
TABLE 98 REST OF ASIA PACIFIC REACTIVE DILUENTS MARKET BY APPLICATION (KILOTONS) 2020-2029
TABLE 99 EUROPE REACTIVE DILUENTS MARKET BY COUNTRY (USD MILLIONS) 2020-2029
TABLE 100 EUROPE REACTIVE DILUENTS MARKET BY COUNTRY (KILOTONS) 2020-2029
TABLE 101 GERMANY REACTIVE DILUENTS MARKET BY TYPE (USD MILLIONS) 2020-2029
TABLE 102 GERMANY REACTIVE DILUENTS MARKET BY TYPE (KILOTONS) 2020-2029
TABLE 103 GERMANY REACTIVE DILUENTS MARKET BY END-USER (USD MILLIONS) 2020-2029
TABLE 104 GERMANY REACTIVE DILUENTS MARKET BY END-USER (KILOTONS) 2020-2029
TABLE 105 GERMANY REACTIVE DILUENTS MARKET BY APPLICATION (USD MILLIONS) 2020-2029
TABLE 106 GERMANY REACTIVE DILUENTS MARKET BY APPLICATION (KILOTONS) 2020-2029
TABLE 107 UK REACTIVE DILUENTS MARKET BY TYPE (USD MILLIONS) 2020-2029
TABLE 108 UK REACTIVE DILUENTS MARKET BY TYPE (KILOTONS) 2020-2029
TABLE 109 UK REACTIVE DILUENTS MARKET BY END-USER (USD MILLIONS) 2020-2029
TABLE 110 UK REACTIVE DILUENTS MARKET BY END-USER (KILOTONS) 2020-2029
TABLE 111 UK REACTIVE DILUENTS MARKET BY APPLICATION (USD MILLIONS) 2020-2029
TABLE 112 UK REACTIVE DILUENTS MARKET BY APPLICATION (KILOTONS) 2020-2029
TABLE 113 FRANCE REACTIVE DILUENTS MARKET BY TYPE (USD MILLIONS) 2020-2029
TABLE 114 FRANCE REACTIVE DILUENTS MARKET BY TYPE (KILOTONS) 2020-2029
TABLE 115 FRANCE REACTIVE DILUENTS MARKET BY END-USER (USD MILLIONS) 2020-2029
TABLE 116 FRANCE REACTIVE DILUENTS MARKET BY END-USER (KILOTONS) 2020-2029
TABLE 117 FRANCE REACTIVE DILUENTS MARKET BY APPLICATION (USD MILLIONS) 2020-2029
TABLE 118 FRANCE REACTIVE DILUENTS MARKET BY APPLICATION (KILOTONS) 2020-2029
TABLE 119 ITALY REACTIVE DILUENTS MARKET BY TYPE (USD MILLIONS) 2020-2029
TABLE 120 ITALY REACTIVE DILUENTS MARKET BY TYPE (KILOTONS) 2020-2029
TABLE 121 ITALY REACTIVE DILUENTS MARKET BY END-USER (USD MILLIONS) 2020-2029
TABLE 122 ITALY REACTIVE DILUENTS MARKET BY END-USER (KILOTONS) 2020-2029
TABLE 123 ITALY REACTIVE DILUENTS MARKET BY APPLICATION (USD MILLIONS) 2020-2029
TABLE 124 ITALY REACTIVE DILUENTS MARKET BY APPLICATION (KILOTONS) 2020-2029
TABLE 125 SPAIN REACTIVE DILUENTS MARKET BY TYPE (USD MILLIONS) 2020-2029
TABLE 126 SPAIN REACTIVE DILUENTS MARKET BY TYPE (KILOTONS) 2020-2029
TABLE 127 SPAIN REACTIVE DILUENTS MARKET BY END-USER (USD MILLIONS) 2020-2029
TABLE 128 SPAIN REACTIVE DILUENTS MARKET BY END-USER (KILOTONS) 2020-2029
TABLE 129 SPAIN REACTIVE DILUENTS MARKET BY APPLICATION (USD MILLIONS) 2020-2029
TABLE 130 SPAIN REACTIVE DILUENTS MARKET BY APPLICATION (KILOTONS) 2020-2029
TABLE 131 RUSSIA REACTIVE DILUENTS MARKET BY TYPE (USD MILLIONS) 2020-2029
TABLE 132 RUSSIA REACTIVE DILUENTS MARKET BY TYPE (KILOTONS) 2020-2029
TABLE 133 RUSSIA REACTIVE DILUENTS MARKET BY END-USER (USD MILLIONS) 2020-2029
TABLE 134 RUSSIA REACTIVE DILUENTS MARKET BY END-USER (KILOTONS) 2020-2029
TABLE 135 RUSSIA REACTIVE DILUENTS MARKET BY APPLICATION (USD MILLIONS) 2020-2029
TABLE 136 RUSSIA REACTIVE DILUENTS MARKET BY APPLICATION (KILOTONS) 2020-2029
TABLE 137 REST OF EUROPE REACTIVE DILUENTS MARKET BY TYPE (USD MILLIONS) 2020-2029
TABLE 138 REST OF EUROPE REACTIVE DILUENTS MARKET BY TYPE (KILOTONS) 2020-2029
TABLE 139 REST OF EUROPE REACTIVE DILUENTS MARKET BY END-USER (USD MILLIONS) 2020-2029
TABLE 140 REST OF EUROPE REACTIVE DILUENTS MARKET BY END-USER (KILOTONS) 2020-2029
TABLE 141 REST OF EUROPE REACTIVE DILUENTS MARKET BY APPLICATION (USD MILLIONS) 2020-2029
TABLE 142 REST OF EUROPE REACTIVE DILUENTS MARKET BY APPLICATION (KILOTONS) 2020-2029
TABLE 143 MIDDLE EAST AND AFRICA REACTIVE DILUENTS MARKET BY COUNTRY (USD MILLIONS) 2020-2029
TABLE 144 MIDDLE EAST AND AFRICA REACTIVE DILUENTS MARKET BY COUNTRY (KILOTONS) 2020-2029
TABLE 145 UAE REACTIVE DILUENTS MARKET BY TYPE (USD MILLIONS) 2020-2029
TABLE 146 UAE REACTIVE DILUENTS MARKET BY TYPE (KILOTONS) 2020-2029
TABLE 147 UAE REACTIVE DILUENTS MARKET BY END-USER (USD MILLIONS) 2020-2029
TABLE 148 UAE REACTIVE DILUENTS MARKET BY END-USER (KILOTONS) 2020-2029
TABLE 149 UAE REACTIVE DILUENTS MARKET BY APPLICATION (USD MILLIONS) 2020-2029
TABLE 150 UAE REACTIVE DILUENTS MARKET BY APPLICATION (KILOTONS) 2020-2029
TABLE 151 SAUDI ARABIA REACTIVE DILUENTS MARKET BY TYPE (USD MILLIONS) 2020-2029
TABLE 152 SAUDI ARABIA REACTIVE DILUENTS MARKET BY TYPE (KILOTONS) 2020-2029
TABLE 153 SAUDI ARABIA REACTIVE DILUENTS MARKET BY END-USER (USD MILLIONS) 2020-2029
TABLE 154 SAUDI ARABIA REACTIVE DILUENTS MARKET BY END-USER (KILOTONS) 2020-2029
TABLE 155 SAUDI ARABIA REACTIVE DILUENTS MARKET BY APPLICATION (USD MILLIONS) 2020-2029
TABLE 156 SAUDI ARABIA REACTIVE DILUENTS MARKET BY APPLICATION (KILOTONS) 2020-2029
TABLE 157 SOUTH AFRICA REACTIVE DILUENTS MARKET BY TYPE (USD MILLIONS) 2020-2029
TABLE 158 SOUTH AFRICA REACTIVE DILUENTS MARKET BY TYPE (KILOTONS) 2020-2029
TABLE 159 SOUTH AFRICA REACTIVE DILUENTS MARKET BY END-USER (USD MILLIONS) 2020-2029
TABLE 160 SOUTH AFRICA REACTIVE DILUENTS MARKET BY END-USER (KILOTONS) 2020-2029
TABLE 161 SOUTH AFRICA REACTIVE DILUENTS MARKET BY APPLICATION (USD MILLIONS) 2020-2029
TABLE 162 SOUTH AFRICA REACTIVE DILUENTS MARKET BY APPLICATION (KILOTONS) 2020-2029
TABLE 163 REST OF MIDDLE EAST AND AFRICA REACTIVE DILUENTS MARKET BY TYPE (USD MILLIONS) 2020-2029
TABLE 164 REST OF MIDDLE EAST AND AFRICA REACTIVE DILUENTS MARKET BY TYPE (KILOTONS) 2020-2029
TABLE 165 REST OF MIDDLE EAST AND AFRICA REACTIVE DILUENTS MARKET BY END-USER (USD MILLIONS) 2020-2029
TABLE 166 REST OF MIDDLE EAST AND AFRICA REACTIVE DILUENTS MARKET BY END-USER (KILOTONS) 2020-2029
TABLE 167 REST OF MIDDLE EAST AND AFRICA REACTIVE DILUENTS MARKET BY APPLICATION (USD MILLIONS) 2020-2029
TABLE 168 REST OF MIDDLE EAST AND AFRICA REACTIVE DILUENTS MARKET BY APPLICATION (KILOTONS) 2020-2029
LIST OF FIGURES
FIGURE 1 MARKET DYNAMICS
FIGURE 2 MARKET SEGMENTATION
FIGURE 3 REPORT TIMELINES: YEARS CONSIDERED
FIGURE 4 DATA TRIANGULATION
FIGURE 5 BOTTOM-UP APPROACH
FIGURE 6 TOP-DOWN APPROACH
FIGURE 7 RESEARCH FLOW
FIGURE 8 GLOBAL REACTIVE DILUENTS MARKET BY TYPE (USD MILLIONS) 2020-2029
FIGURE 9 GLOBAL REACTIVE DILUENTS MARKET BY END-USER (USD MILLIONS) 2020-2029
FIGURE 10 GLOBAL REACTIVE DILUENTS MARKET BY APPLICATION (USD MILLIONS) 2020-2029
FIGURE 11 GLOBAL REACTIVE DILUENTS MARKET BY REGION (USD MILLIONS) 2020-2029
FIGURE 12 PORTER’S FIVE FORCES MODEL
FIGURE 13 NORTH AMERICA REACTIVE DILUENTS MARKET SNAPSHOT
FIGURE 14 EUROPE REACTIVE DILUENTS MARKET SNAPSHOT
FIGURE 15 ASIA PACIFIC REACTIVE DILUENTS MARKET SNAPSHOT
FIGURE 16 SOUTH AMERICA REACTIVE DILUENTS MARKET SNAPSHOT
FIGURE 17 MIDDLE EAST & AFRICA REACTIVE DILUENTS MARKET SNAPSHOT
FIGURE 18 HEXION: COMPANY SNAPSHOT
FIGURE 19 HUNTSMAN CORPORATION: COMPANY SNAPSHOT
FIGURE 20 KUKDO CHEMICAL: COMPANY SNAPSHOT
FIGURE 21 ADITYA BIRLA CHEMICALS: COMPANY SNAPSHOT
FIGURE 22 EVONIK INDUSTRIES: COMPANY SNAPSHOT
FIGURE 23 R. COATS INKS AND RESIN PVT. LTD: COMPANY SNAPSHOT
FIGURE 24 ADEKA CORPORATIONS: COMPANY SNAPSHOT
FIGURE 25 MERCURY SYNTHETIC RESINS: COMPANY SNAPSHOT
FIGURE 26 GRASIM INDUSTRIES LTD.: COMPANY SNAPSHOT
FIGURE 27 CARGILL: COMPANY SNAPSHOT
FIGURE 28 OLIN CORPORATIONS: COMPANY SNAPSHOT
FIGURE 29 ASH CHEM: COMPANY SNAPSHOT
FIGURE 30 ADMARK POLYCOATS PVT LTD: COMPANY SNAPSHOT
FIGURE 31 CHAMPION ADVA MAT PRIVATE LIMITED: COMPANY SNAPSHOT
FIGURE 32 HINDUSTHAN SPECIALITY CHEMICALS LIMITED: COMPANY SNAPSHOT
FIGURE 33 DHINGRA PLASTIC AND PLASTISCISERS PRIVATE LIMITED: COMPANY SNAPSHOT
DOWNLOAD FREE SAMPLE REPORT
License Type
SPEAK WITH OUR ANALYST
Want to know more about the report or any specific requirement?
WANT TO CUSTOMIZE THE REPORT?
Our Clients Speak
We asked them to research ‘ Equipment market’ all over the world, and their whole arrangement was helpful to us. thehealthanalytics.com insightful analysis and reports contributed to our current analysis and in creating a future strategy. Besides, the te
Yosuke Mitsui
Senior Associate Construction Equipment Sales & Marketing
We asked them to research ‘Equipment market’ all over the world, and their whole arrangement was helpful to us. thehealthanalytics.com insightful analysis and reports contributed to our current analysis and in creating a future strategy. Besides, the te


