

Base Year Value ()
x.x %
x.x %
CAGR ()
x.x %
x.x %
Forecast Year Value ()
x.x %
x.x %
Historical Data Period
Largest Region
Forecast Period
Mercado de tintes para papel por tipo (tintes azufrados, tintes directos, tintes básicos y tintes ácidos), forma (polvo y líquido), aplicación (embalaje y cartón, papel estucado, escritura e impresión, pañuelos de papel, papel laminado decorativo) y región (Asia-Pacífico, América del Norte, Europa, América del Sur, Oriente Medio y África): pronóstico global de 2022 a 2029
Instant access to hundreds of data points and trends
- Market estimates from 2014-2029
- Competitive analysis, industry segmentation, financial benchmarks
- Incorporates SWOT, Porter's Five Forces and risk management frameworks
- PDF report or online database with Word, Excel and PowerPoint export options
- 100% money back guarantee
Descripción general del mercado de tintes para papel
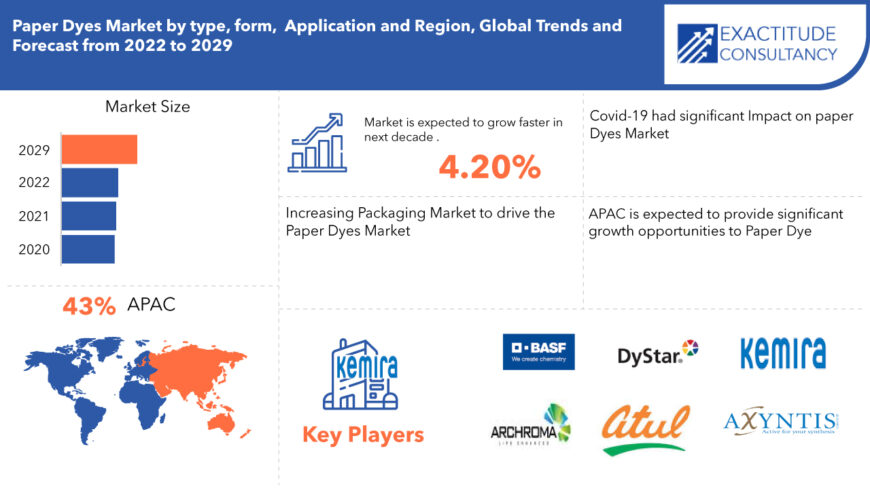
El tamaño del mercado global de tintes de papel es de USD 1.03 mil millones en 2020 y se espera que crezca hasta USD 1.47 mil millones para 2029, a una tasa de crecimiento anual compuesta (CAGR) del 4,20%.
Los tintes para papel son colorantes naturales que se utilizan para alterar la apariencia del papel. Los pigmentos de color que son solubles en un medio de aplicación se conocen como tintes para papel. El consumo de colores para papel se ve influenciado por la creciente preocupación de las personas por la higiene. Los tintes para papel incluyen tintes de azufre, tintes directos, tintes básicos y tintes ácidos, entre otros. Los tintes para papel vienen en dos formas diferentes: en polvo y líquidos. Los tintes para papel se utilizan en una variedad de aplicaciones, incluidos los envases y el cartón, el papel estucado, la escritura y la impresión y los pañuelos de papel. Los tintes para papel vienen en dos variedades: orgánicos y sintéticos.
El creciente mercado de los envases es uno de los factores clave que impulsan el mercado de los tintes para papel. Según Invest India, el sector mundial de los envases crecería a una tasa anual compuesta del 2,8 por ciento, alcanzando la notable cifra de 1,05 billones de dólares en 2024, superando así la barrera de los billones de dólares. Se prevé que el 35,7 por ciento del total provenga de la categoría de papel y cartón para envases.
| ATRIBUTO | DETALLES |
| Periodo de estudio | 2020-2029 |
| Año base | 2021 |
| Año estimado | 2022 |
| Año pronosticado | 2022-2029 |
| Periodo histórico | 2018-2020 |
| Unidad | Valor (millones de USD) Volumen (kilotones) |
| Segmentación | Por tipo, por forma, por aplicación, por región |
| Por tipo |
|
| Por formulario |
|
| Por aplicación |
|
| Por región |
|
Según la organización COMEXPOSIUM, se prevé que la demanda de envases de cartón corrugado alcance los 170 millones de toneladas en 2023, mientras que se espera que la demanda de envases flexibles de papel y plástico alcance los 33,5 millones de toneladas en 2022. Esto está impulsando el crecimiento del mercado de tintes para papel durante el período de pronóstico de 2022-2027.
Una de las principales dificultades del mercado de los tintes para papel son las estrictas normas que rigen la fabricación y el comercio de tintes a escala mundial. REACH (Registro, Evaluación, Autorización y Restricción de Sustancias Químicas), por ejemplo, es una normativa de la Unión Europea (UE) que supervisa la producción y el uso de sustancias químicas. Los tintes, en particular los azoicos, deben estar libres de componentes cancerígenos, mutagénicos o tóxicos y no deben ser peligrosos para el medio ambiente para poder fabricarse y distribuirse en Europa.
Estas restricciones son buenas para la salud de las personas y el medio ambiente, pero tienden a limitar los procedimientos de fabricación de algunos productos químicos, como los tintes. En consecuencia, dichas restricciones pueden ser una limitación durante el período previsto de 2022 a 2027.
[título id="attachment_10196" align="aligncenter" width="870"]
Frequently Asked Questions
• Who are the key participants in the market for paper dyes?
The Key Players in Paper Dyes Market are BASF, Archroma, dystar, Atul Ltd., Synthesia, KEMIRA OYJ, Axyntis Group, Vipul Organics, Keystone Aniline, Standard Colors.
• What is the study period of this market?
The Paper Dyes Market is studied from 2020 – 2029
• What is the Size of global paper dyes market?
The paper dyes market size had crossed USD 1.03 Billion in 2020 and is expected to grow till USD 1.47 Billion by 2029.
• What is the CAGR of paper dyes market?
The global paper dyes market registered a CAGR of 4.20% from 2022 to 2029.
• Which is the largest regional market for paper dyes market?
The Largest Regional market for paper dyes is APAC having a market share of 43%.
Paper Dyes Market Segment Analysis
The Paper Dyes market is segmented by type, form, and Application.
On the basis of type, global Paper Dyes market is segmented into Sulphur Dyes, Direct Dyes, Basic Dyes, and Acid Dyes. In the Paper-dyes Market, Direct Dyes had the greatest share of 42 percent by type segment. Direct dyes are water-soluble dyes that are generally of the azo class and are used to color cotton and paper directly in alkaline or neutral solutions. Direct dyes have high fastness qualities that improve after treatment, and they have an advantage over other dyes in that they may be applied directly to the substrate, allowing them to be used in a wide range of applications. Acidic dyes, which are anionic dyes with one or more sulfonic acid substituents or other acid groups, basic dyes, which are cationic dyes generated from coal and tar, and Sulphur dyes, which resist washing, are among the various types of paper dyes.
On the basis of form, global Paper Dyes market is segmented into Powder and Liquid. In the Paper Dyes Market, Liquid Dyes had the greatest share of 57 percent by form segment. Liquid dyes are dyes that are dissolved in water and have a high dyestuff concentration. As a result, liquid dyes are more convenient to employ in paper since powder dyes must first be dissolved in a solvent before being added to the dyebath. Writing and printing paper, coated paper, tissues and toweling, packaging and board papers, and so on are all common uses for liquid dyes. According to the International Energy Agency (IEA), worldwide pulp and paper output would grow at a rate of 1.5 percent each year through 2030.
On the basis of Application, global Paper Dyes market is segmented into Packaging & Board, Coated Paper, Writing & Printing, Tissues, Decorative Laminated Paper.
[caption id="attachment_10206" align="alignleft" width="680"]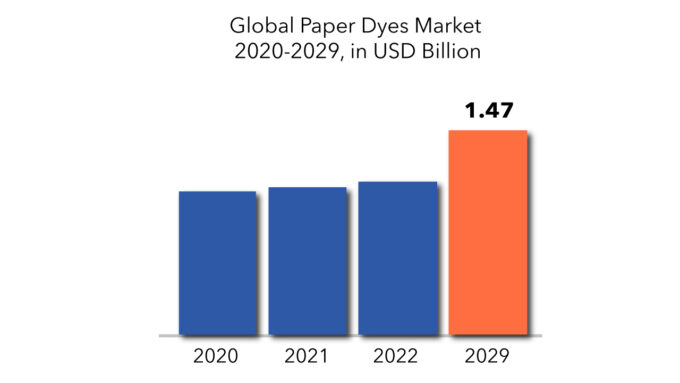
Paper Dyes Market Players
The Key Players in Paper Dyes Market are BASF, Archroma, dystar, Atul Ltd., Synthesia, KEMIRA OYJ, Axyntis Group, Vipul Organics, Keystone Aniline, Standard Colors.
Diverse product portfolios, strategically located R&D facilities, persistent research operations, and technical developments have helped these organizations enhance their market position. To enhance their market share, they are focusing on a variety of organic and inorganic growth initiatives, such as expansions, partnerships, and acquisitions.
Who Should Buy? Or Key stakeholders
- Industry and consulting firms
- State and national regulatory authorities
- Investors
- Suppliers and Distributors
- Research Institutes
- Others
Paper Dyes Market Regional Analysis
Geographically, Paper Dyes market is segmented into North America, Europe, Asia Pacific, and Rest of the world.
- North America: includes the US, Canada, Mexico
- Europe: includes UK, Germany, France, Italy, Spain, Russia, and Rest of Europe
- Asia Pacific: includes China, Japan, South Korea, India, Australia, ASEAN and Rest of APAC
Asia Pacific is predicted to have the biggest market share, due to the increased production of dyestuffs for paper consumption in the Asia Pacific area, increasing awareness of the benefits of paper between packaging and cardboard is likely to enhance the Asia Pacific region's growth in the paper dyes market during the forecast period. The Asia-Pacific area is a vital site for paper dye makers, since the global economic recession has prompted many established companies to create manufacturing facilities in the region, resulting in increased sales.
Key Market Segments: Paper Dyes Market
Paper Dyes Market by Type, 2020-2029, (USD Millions), (Kilotons)- Sulphur Dyes
- Direct Dyes
- Basic Dyes
- Acid Dyes
- Powder
- Liquid
- Packaging & Board
- Coated Paper
- Writing & Printing
- Tissues
- Decorative Laminated Paper
- North America
- Europe
- APAC
- MEA
- Latin America
[video width="1920" height="1080" mp4="https://gwsdigital.com/exactitudeconsultancy/wp-content/uploads/2022/07/Paper-Dyes-Market-.mp4" poster="https://gwsdigital.com/exactitudeconsultancy/wp-content/uploads/2022/02/exactitude-1-3.jpg"][/video]
Key Question Answered
- What is the current market size of this high growth market?
- What is the overall growth rate?
- What are the key growth areas, applications, end uses and types?
- Key reasons for growth
- Challenges for growth
- What technological developments are happening in this area?
- Introducción
- Definición de mercado
- Segmentación del mercado
- Cronología de la investigación
- Supuestos y limitaciones
- Metodología de la investigación
- Minería de datos
- Investigación secundaria
- Investigación primaria
- Asesoramiento de expertos en la materia
- Controles de calidad
- Revisión final
- Triangulación de datos
- Enfoque de abajo hacia arriba
- Enfoque de arriba hacia abajo
- Flujo de investigación
- Fuentes de datos
- Minería de datos
- Resumen ejecutivo
- Descripción general del mercado
- Perspectivas del mercado mundial de tintes para papel
- Factores impulsores del mercado
- Restricciones del mercado
- Oportunidades de mercado
- Impacto de Covid-19 en el mercado de tintes para papel
- Modelo de las cinco fuerzas de Porter
- Amenaza de nuevos participantes
- Amenaza de sustitutos
- Poder de negociación de los proveedores
- Poder de negociación de los clientes
- Grado de competencia
- Análisis de la cadena de valor de la industria
- Perspectivas del mercado mundial de tintes para papel
- Mercado mundial de tintes para papel por tipo (millones de USD) (kilotones)
- Tintes de azufre
- Tintes directos
- Tintes básicos
- Colorantes ácidos
- Mercado mundial de tintes para papel por formato (millones de USD) (kilotones)
- Polvo
- Líquido
- Mercado mundial de tintes para papel por usuarios finales (millones de USD) (kilotones)
- Embalaje y cartón
- Papel cuché
- Escritura e impresión
- Tejidos
- Papel laminado decorativo
- Mercado mundial de tintes para papel por región
- América del norte
- A NOSOTROS
- Canadá
- México
- Sudamerica
- Brasil
- Argentina
- Colombia
- Resto de Sudamérica
- Europa
- Alemania
- Reino Unido
- Francia
- Italia
- España
- Rusia
- Resto de Europa
- Asia Pacífico
- India
- Porcelana
- Japón
- Corea del Sur
- Australia
- Sudeste asiático
- Resto de Asia Pacífico
- Oriente Medio y África
- Emiratos Árabes Unidos
- Arabia Saudita
- Sudáfrica
- Resto de Oriente Medio y África
- América del norte
- Perfiles de empresas* (descripción general de la empresa, descripción general de la empresa, productos ofrecidos, desarrollos recientes)
- BASF
- Arqueroma
- Distar
- Compañía Limitada.
- Síntesis
- KEMIRA OYJ
- Grupo Axyntis
- Productos orgánicos Vipul
- Anilina Keystone
- Colores estándar *El listado de empresas es orientativo
LISTA DE TABLAS
TABLE 1 GLOBAL PAPER DYES MARKET BY TYPE (USD MILLIONS) 2020-2029
TABLE 2 GLOBAL PAPER DYES MARKET BY TYPE (KILOTONS) 2020-2029
TABLE 3 GLOBAL PAPER DYES MARKET BY FORM (USD MILLIONS) 2020-2029
TABLE 4 GLOBAL PAPER DYES MARKET BY FORM (KILOTONS) 2020-2029
TABLE 5 GLOBAL PAPER DYES MARKET BY END USER (USD MILLIONS) 2020-2029
TABLE 6 GLOBAL PAPER DYES MARKET BY END USER (KILOTONS) 2020-2029
TABLE 7 GLOBAL PAPER DYES MARKET BY REGION (USD MILLIONS) 2020-2029
TABLE 8 GLOBAL PAPER DYES MARKET BY REGION (KILOTONS) 2020-2029
TABLE 9 US PAPER DYES MARKET BY TYPE (USD MILLIONS) 2020-2029
TABLE 10 US PAPER DYES MARKET BY TYPE (KILOTONS) 2020-2029
TABLE 11 US PAPER DYES MARKET BY FORM (USD MILLIONS) 2020-2029
TABLE 12 US PAPER DYES MARKET BY FORM (KILOTONS) 2020-2029
TABLE 13 US PAPER DYES MARKET BY END USER (USD MILLIONS) 2020-2029
TABLE 14 US PAPER DYES MARKET BY END USER (KILOTONS) 2020-2029
TABLE 15 CANADA PAPER DYES MARKET BY TYPE (USD MILLIONS) 2020-2029
TABLE 16 CANADA PAPER DYES MARKET BY TYPE (KILOTONS) 2020-2029
TABLE 17 CANADA PAPER DYES MARKET BY FORM (USD MILLIONS) 2020-2029
TABLE 18 CANADA PAPER DYES MARKET BY FORM (KILOTONS) 2020-2029
TABLE 19 CANADA PAPER DYES MARKET BY END USER (USD MILLIONS) 2020-2029
TABLE 20 CANADA PAPER DYES MARKET BY END USER (KILOTONS) 2020-2029
TABLE 21 MEXICO PAPER DYES MARKET BY TYPE (USD MILLIONS) 2020-2029
TABLE 22 MEXICO PAPER DYES MARKET BY TYPE (KILOTONS) 2020-2029
TABLE 23 MEXICO PAPER DYES MARKET BY FORM (USD MILLIONS) 2020-2029
TABLE 24 MEXICO PAPER DYES MARKET BY FORM (KILOTONS) 2020-2029
TABLE 25 MEXICO PAPER DYES MARKET BY END USER (USD MILLIONS) 2020-2029
TABLE 26 MEXICO PAPER DYES MARKET BY END USER (KILOTONS) 2020-2029
TABLE 27 BRAZIL PAPER DYES MARKET BY TYPE (USD MILLIONS) 2020-2029
TABLE 28 BRAZIL PAPER DYES MARKET BY TYPE (KILOTONS) 2020-2029
TABLE 29 BRAZIL PAPER DYES MARKET BY FORM (USD MILLIONS) 2020-2029
TABLE 30 BRAZIL PAPER DYES MARKET BY FORM (KILOTONS) 2020-2029
TABLE 31 BRAZIL PAPER DYES MARKET BY END USER (USD MILLIONS) 2020-2029
TABLE 32 BRAZIL PAPER DYES MARKET BY END USER (KILOTONS) 2020-2029
TABLE 33 ARGENTINA PAPER DYES MARKET BY TYPE (USD MILLIONS) 2020-2029
TABLE 34 ARGENTINA PAPER DYES MARKET BY TYPE (KILOTONS) 2020-2029
TABLE 35 ARGENTINA PAPER DYES MARKET BY FORM (USD MILLIONS) 2020-2029
TABLE 36 ARGENTINA PAPER DYES MARKET BY FORM (KILOTONS) 2020-2029
TABLE 37 ARGENTINA PAPER DYES MARKET BY END USER (USD MILLIONS) 2020-2029
TABLE 38 ARGENTINA PAPER DYES MARKET BY END USER (KILOTONS) 2020-2029
TABLE 39 COLOMBIA PAPER DYES MARKET BY TYPE (USD MILLIONS) 2020-2029
TABLE 40 COLOMBIA PAPER DYES MARKET BY TYPE (KILOTONS) 2020-2029
TABLE 41 COLOMBIA PAPER DYES MARKET BY FORM (USD MILLIONS) 2020-2029
TABLE 42 COLOMBIA PAPER DYES MARKET BY FORM (KILOTONS) 2020-2029
TABLE 43 COLOMBIA PAPER DYES MARKET BY END USER (USD MILLIONS) 2020-2029
TABLE 44 COLOMBIA PAPER DYES MARKET BY END USER (KILOTONS) 2020-2029
TABLE 45 REST OF SOUTH AMERICA PAPER DYES MARKET BY TYPE (USD MILLIONS) 2020-2029
TABLE 46 REST OF SOUTH AMERICA PAPER DYES MARKET BY TYPE (KILOTONS) 2020-2029
TABLE 47 REST OF SOUTH AMERICA PAPER DYES MARKET BY FORM (USD MILLIONS) 2020-2029
TABLE 48 REST OF SOUTH AMERICA PAPER DYES MARKET BY FORM (KILOTONS) 2020-2029
TABLE 49 REST OF SOUTH AMERICA PAPER DYES MARKET BY END USER (USD MILLIONS) 2020-2029
TABLE 50 REST OF SOUTH AMERICA PAPER DYES MARKET BY END USER (KILOTONS) 2020-2029
TABLE 51 INDIA PAPER DYES MARKET BY TYPE (USD MILLIONS) 2020-2029
TABLE 52 INDIA PAPER DYES MARKET BY TYPE (KILOTONS) 2020-2029
TABLE 53 INDIA PAPER DYES MARKET BY FORM (USD MILLIONS) 2020-2029
TABLE 54 INDIA PAPER DYES MARKET BY FORM (KILOTONS) 2020-2029
TABLE 55 INDIA PAPER DYES MARKET BY END USER (USD MILLIONS) 2020-2029
TABLE 56 INDIA PAPER DYES MARKET BY END USER (KILOTONS) 2020-2029
TABLE 57 CHINA PAPER DYES MARKET BY TYPE (USD MILLIONS) 2020-2029
TABLE 58 CHINA PAPER DYES MARKET BY TYPE (KILOTONS) 2020-2029
TABLE 59 CHINA PAPER DYES MARKET BY FORM (USD MILLIONS) 2020-2029
TABLE 60 CHINA PAPER DYES MARKET BY FORM (KILOTONS) 2020-2029
TABLE 61 CHINA PAPER DYES MARKET BY END USER (USD MILLIONS) 2020-2029
TABLE 62 CHINA PAPER DYES MARKET BY END USER (KILOTONS) 2020-2029
TABLE 63 JAPAN PAPER DYES MARKET BY TYPE (USD MILLIONS) 2020-2029
TABLE 64 JAPAN PAPER DYES MARKET BY TYPE (KILOTONS) 2020-2029
TABLE 65 JAPAN PAPER DYES MARKET BY FORM (USD MILLIONS) 2020-2029
TABLE 66 JAPAN PAPER DYES MARKET BY FORM (KILOTONS) 2020-2029
TABLE 67 JAPAN PAPER DYES MARKET BY END USER (USD MILLIONS) 2020-2029
TABLE 68 JAPAN PAPER DYES MARKET BY END USER (KILOTONS) 2020-2029
TABLE 69 SOUTH KOREA PAPER DYES MARKET BY TYPE (USD MILLIONS) 2020-2029
TABLE 70 SOUTH KOREA PAPER DYES MARKET BY TYPE (KILOTONS) 2020-2029
TABLE 71 SOUTH KOREA PAPER DYES MARKET BY FORM (USD MILLIONS) 2020-2029
TABLE 72 SOUTH KOREA PAPER DYES MARKET BY FORM (KILOTONS) 2020-2029
TABLE 73 SOUTH KOREA PAPER DYES MARKET BY END USER (USD MILLIONS) 2020-2029
TABLE 74 SOUTH KOREA PAPER DYES MARKET BY END USER (KILOTONS) 2020-2029
TABLE 75 AUSTRALIA PAPER DYES MARKET BY TYPE (USD MILLIONS) 2020-2029
TABLE 76 AUSTRALIA PAPER DYES MARKET BY TYPE (KILOTONS) 2020-2029
TABLE 77 AUSTRALIA PAPER DYES MARKET BY FORM (USD MILLIONS) 2020-2029
TABLE 78 AUSTRALIA PAPER DYES MARKET BY FORM (KILOTONS) 2020-2029
TABLE 79 AUSTRALIA PAPER DYES MARKET BY END USER (USD MILLIONS) 2020-2029
TABLE 80 AUSTRALIA PAPER DYES MARKET BY END USER (KILOTONS) 2020-2029
TABLE 81 SOUTH-EAST ASIA PAPER DYES MARKET BY TYPE (USD MILLIONS) 2020-2029
TABLE 82 SOUTH-EAST ASIA PAPER DYES MARKET BY TYPE (KILOTONS) 2020-2029
TABLE 83 SOUTH-EAST ASIA PAPER DYES MARKET BY FORM (USD MILLIONS) 2020-2029
TABLE 84 SOUTH-EAST ASIA PAPER DYES MARKET BY FORM (KILOTONS) 2020-2029
TABLE 85 SOUTH-EAST ASIA PAPER DYES MARKET BY END USER (USD MILLIONS) 2020-2029
TABLE 86 SOUTH-EAST ASIA PAPER DYES MARKET BY END USER (KILOTONS) 2020-2029
TABLE 87 REST OF ASIA PACIFIC PAPER DYES MARKET BY TYPE (USD MILLIONS) 2020-2029
TABLE 88 REST OF ASIA PACIFIC PAPER DYES MARKET BY TYPE (KILOTONS) 2020-2029
TABLE 89 REST OF ASIA PACIFIC PAPER DYES MARKET BY FORM (USD MILLIONS) 2020-2029
TABLE 90 REST OF ASIA PACIFIC PAPER DYES MARKET BY FORM (KILOTONS) 2020-2029
TABLE 91 REST OF ASIA PACIFIC PAPER DYES MARKET BY END USER (USD MILLIONS) 2020-2029
TABLE 92 REST OF ASIA PACIFIC PAPER DYES MARKET BY END USER (KILOTONS) 2020-2029
TABLE 93 GERMANY PAPER DYES MARKET BY TYPE (USD MILLIONS) 2020-2029
TABLE 94 GERMANY PAPER DYES MARKET BY TYPE (KILOTONS) 2020-2029
TABLE 95 GERMANY PAPER DYES MARKET BY FORM (USD MILLIONS) 2020-2029
TABLE 96 GERMANY PAPER DYES MARKET BY FORM (KILOTONS) 2020-2029
TABLE 97 GERMANY PAPER DYES MARKET BY END USER (USD MILLIONS) 2020-2029
TABLE 98 GERMANY PAPER DYES MARKET BY END USER (KILOTONS) 2020-2029
TABLE 99 UK PAPER DYES MARKET BY TYPE (USD MILLIONS) 2020-2029
TABLE 100 UK PAPER DYES MARKET BY TYPE (KILOTONS) 2020-2029
TABLE 101 UK PAPER DYES MARKET BY FORM (USD MILLIONS) 2020-2029
TABLE 102 UK PAPER DYES MARKET BY FORM (KILOTONS) 2020-2029
TABLE 103 UK PAPER DYES MARKET BY END USER (USD MILLIONS) 2020-2029
TABLE 104 UK PAPER DYES MARKET BY END USER (KILOTONS) 2020-2029
TABLE 105 FRANCE PAPER DYES MARKET BY TYPE (USD MILLIONS) 2020-2029
TABLE 106 FRANCE PAPER DYES MARKET BY TYPE (KILOTONS) 2020-2029
TABLE 107 FRANCE PAPER DYES MARKET BY FORM (USD MILLIONS) 2020-2029
TABLE 108 FRANCE PAPER DYES MARKET BY FORM (KILOTONS) 2020-2029
TABLE 109 FRANCE PAPER DYES MARKET BY END USER (USD MILLIONS) 2020-2029
TABLE 110 FRANCE PAPER DYES MARKET BY END USER (KILOTONS) 2020-2029
TABLE 111 ITALY PAPER DYES MARKET BY TYPE (USD MILLIONS) 2020-2029
TABLE 112 ITALY PAPER DYES MARKET BY TYPE (KILOTONS) 2020-2029
TABLE 113 ITALY PAPER DYES MARKET BY FORM (USD MILLIONS) 2020-2029
TABLE 114 ITALY PAPER DYES MARKET BY FORM (KILOTONS) 2020-2029
TABLE 115 ITALY PAPER DYES MARKET BY END USER (USD MILLIONS) 2020-2029
TABLE 116 ITALY PAPER DYES MARKET BY END USER (KILOTONS) 2020-2029
TABLE 117 SPAIN PAPER DYES MARKET BY TYPE (USD MILLIONS) 2020-2029
TABLE 118 SPAIN PAPER DYES MARKET BY TYPE (KILOTONS) 2020-2029
TABLE 119 SPAIN PAPER DYES MARKET BY FORM (USD MILLIONS) 2020-2029
TABLE 120 SPAIN PAPER DYES MARKET BY FORM (KILOTONS) 2020-2029
TABLE 121 SPAIN PAPER DYES MARKET BY END USER (USD MILLIONS) 2020-2029
TABLE 122 SPAIN PAPER DYES MARKET BY END USER (KILOTONS) 2020-2029
TABLE 123 RUSSIA PAPER DYES MARKET BY TYPE (USD MILLIONS) 2020-2029
TABLE 124 RUSSIA PAPER DYES MARKET BY TYPE (KILOTONS) 2020-2029
TABLE 125 RUSSIA PAPER DYES MARKET BY FORM (USD MILLIONS) 2020-2029
TABLE 126 RUSSIA PAPER DYES MARKET BY FORM (KILOTONS) 2020-2029
TABLE 127 RUSSIA PAPER DYES MARKET BY END USER (USD MILLIONS) 2020-2029
TABLE 128 RUSSIA PAPER DYES MARKET BY END USER (KILOTONS) 2020-2029
TABLE 129 REST OF EUROPE PAPER DYES MARKET BY TYPE (USD MILLIONS) 2020-2029
TABLE 130 REST OF EUROPE PAPER DYES MARKET BY TYPE (KILOTONS) 2020-2029
TABLE 131 REST OF EUROPE PAPER DYES MARKET BY FORM (USD MILLIONS) 2020-2029
TABLE 132 REST OF EUROPE PAPER DYES MARKET BY FORM (KILOTONS) 2020-2029
TABLE 133 REST OF EUROPE PAPER DYES MARKET BY END USER (USD MILLIONS) 2020-2029
TABLE 134 REST OF EUROPE PAPER DYES MARKET BY END USER (KILOTONS) 2020-2029
TABLE 135 UAE PAPER DYES MARKET BY TYPE (USD MILLIONS) 2020-2029
TABLE 136 UAE PAPER DYES MARKET BY TYPE (KILOTONS) 2020-2029
TABLE 137 UAE PAPER DYES MARKET BY FORM (USD MILLIONS) 2020-2029
TABLE 138 UAE PAPER DYES MARKET BY FORM (KILOTONS) 2020-2029
TABLE 139 UAE PAPER DYES MARKET BY END USER (USD MILLIONS) 2020-2029
TABLE 140 UAE PAPER DYES MARKET BY END USER (KILOTONS) 2020-2029
TABLE 141 SAUDI ARABIA PAPER DYES MARKET BY TYPE (USD MILLIONS) 2020-2029
TABLE 142 SAUDI ARABIA PAPER DYES MARKET BY TYPE (KILOTONS) 2020-2029
TABLE 143 SAUDI ARABIA PAPER DYES MARKET BY FORM (USD MILLIONS) 2020-2029
TABLE 144 SAUDI ARABIA PAPER DYES MARKET BY FORM (KILOTONS) 2020-2029
TABLE 145 SAUDI ARABIA PAPER DYES MARKET BY END USER (USD MILLIONS) 2020-2029
TABLE 146 SAUDI ARABIA PAPER DYES MARKET BY END USER (KILOTONS) 2020-2029
TABLE 147 SOUTH AFRICA PAPER DYES MARKET BY TYPE (USD MILLIONS) 2020-2029
TABLE 148 SOUTH AFRICA PAPER DYES MARKET BY TYPE (KILOTONS) 2020-2029
TABLE 149 SOUTH AFRICA PAPER DYES MARKET BY FORM (USD MILLIONS) 2020-2029
TABLE 150 SOUTH AFRICA PAPER DYES MARKET BY FORM (KILOTONS) 2020-2029
TABLE 151 SOUTH AFRICA PAPER DYES MARKET BY END USER (USD MILLIONS) 2020-2029
TABLE 152 SOUTH AFRICA PAPER DYES MARKET BY END USER (KILOTONS) 2020-2029
TABLE 153 REST OF MIDDLE EAST AND AFRICA PAPER DYES MARKET BY TYPE (USD MILLIONS) 2020-2029
TABLE 154 REST OF MIDDLE EAST AND AFRICA PAPER DYES MARKET BY TYPE (KILOTONS) 2020-2029
TABLE 155 REST OF MIDDLE EAST AND AFRICA PAPER DYES MARKET BY FORM (USD MILLIONS) 2020-2029
TABLE 156 REST OF MIDDLE EAST AND AFRICA PAPER DYES MARKET BY FORM (KILOTONS) 2020-2029
TABLE 157 REST OF MIDDLE EAST AND AFRICA PAPER DYES MARKET BY END USER (USD MILLIONS) 2020-2029
TABLE 158 REST OF MIDDLE EAST AND AFRICA PAPER DYES MARKET BY END USER (KILOTONS) 2020-2029
LIST OF FIGURES
FIGURE 1 MARKET DYNAMICS
FIGURE 2 MARKET SEGMENTATION
FIGURE 3 REPORT TIMELINES: YEARS CONSIDERED
FIGURE 4 DATA TRIANGULATION
FIGURE 5 BOTTOM-UP APPROACH
FIGURE 6 TOP-DOWN APPROACH
FIGURE 7 RESEARCH FLOW
FIGURE 8 GLOBAL PAPER DYES MARKET BY TYPE, USD MILLION, 2020-2029
FIGURE 9 GLOBAL PAPER DYES MARKET BY FORM, USD MILLION, 2020-2029
FIGURE 10 GLOBAL PAPER DYES MARKET BY END USER, USD MILLION, 2020-2029
FIGURE 11 GLOBAL PAPER DYES MARKET BY REGION, USD MILLION, 2020-2029
FIGURE 12 PORTER’S FIVE FORCES MODEL
FIGURE 13 NORTH AMERICA PAPER DYES MARKET SNAPSHOT
FIGURE 14 EUROPE PAPER DYES MARKET SNAPSHOT
FIGURE 15 ASIA PACIFIC PAPER DYES MARKET SNAPSHOT
FIGURE 16 SOUTH AMERICA PAPER DYES MARKET SNAPSHOT
FIGURE 17 MIDDLE EAST & AFRICA PAPER DYES MARKET SNAPSHOT
FIGURE 18 BASF COMPANY SNAPSHOT
FIGURE 19 ARCHROMA COMPANY SNAPSHOT
FIGURE 20 DYSTAR COMPANY SNAPSHOT
FIGURE 21 ATUL LTD. COMPANY SNAPSHOT
FIGURE 22 SYNTHESIA COMPANY SNAPSHOT
FIGURE 23 KEMIRA OYJ COMPANY SNAPSHOT
FIGURE 24 AXYNTIS GROUP COMPANY SNAPSHOT
FIGURE 25 VIPUL ORGANICS COMPANY SNAPSHOT
FIGURE 26 KEYSTONE ANILINE COMPANY SNAPSHOT
FIGURE 27 STANDARD COLORS COMPANY SNAPSHOT
DOWNLOAD FREE SAMPLE REPORT
License Type
SPEAK WITH OUR ANALYST
Want to know more about the report or any specific requirement?
WANT TO CUSTOMIZE THE REPORT?
Our Clients Speak
We asked them to research ‘ Equipment market’ all over the world, and their whole arrangement was helpful to us. thehealthanalytics.com insightful analysis and reports contributed to our current analysis and in creating a future strategy. Besides, the te
Yosuke Mitsui
Senior Associate Construction Equipment Sales & Marketing
We asked them to research ‘Equipment market’ all over the world, and their whole arrangement was helpful to us. thehealthanalytics.com insightful analysis and reports contributed to our current analysis and in creating a future strategy. Besides, the te


