

Base Year Value ()
x.x %
x.x %
CAGR ()
x.x %
x.x %
Forecast Year Value ()
x.x %
x.x %
Historical Data Period
Largest Region
Forecast Period
Mercado de aparatos ortopédicos y soportes por producto (rodilla, tobillo, cadera, columna, hombro, cuello, codo, mano, muñeca), tipo (blando, rígido, con bisagras), aplicación (ligamento [LCA, LCL], preventivo, artrosis), canal de distribución (farmacias, clínicas ortopédicas, farmacias y minoristas, plataformas de comercio electrónico) y región (Asia-Pacífico, América del Norte, Europa, América del Sur, Oriente Medio y África): pronóstico global de 2022 a 2029
Instant access to hundreds of data points and trends
- Market estimates from 2014-2029
- Competitive analysis, industry segmentation, financial benchmarks
- Incorporates SWOT, Porter's Five Forces and risk management frameworks
- PDF report or online database with Word, Excel and PowerPoint export options
- 100% money back guarantee
Descripción general del mercado de aparatos y soportes ortopédicos
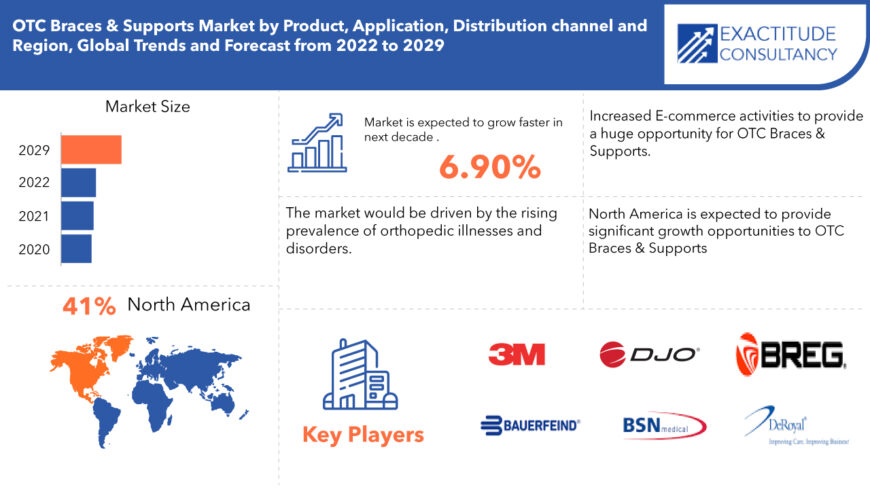
El tamaño del mercado global de aparatos y soportes ortopédicos es de USD 3,19 mil millones en 2020 y se espera que crezca hasta USD 5,18 mil millones para 2029, a una tasa de crecimiento anual compuesta (CAGR) del 6,20%.
Los aparatos ortopédicos son dispositivos médicos que se utilizan para alinear, corregir la posición, sostener , estabilizar y proteger varias partes del cuerpo (especialmente los músculos, las articulaciones y los huesos) mientras se curan de lesiones o daños. Con el aumento de la prevalencia de la obesidad y los problemas de estilo de vida que la acompañan, se prevé que la frecuencia de enfermedades y trastornos ortopédicos aumente aún más en los próximos años, ya que las personas obesas tienen un mayor riesgo de sufrir lesiones ortopédicas y musculoesqueléticas, así como diabetes. Los aparatos y soportes ortopédicos ofrecen varias ventajas sobre los productos tradicionales, incluido un menor costo, una mayor eficacia, más comodidad para el paciente y facilidad de uso. Las empresas clave están creando rápidamente soluciones personalizadas para el tratamiento de diversas dolencias ortopédicas, así como para satisfacer las demandas insatisfechas del mercado como resultado de estos beneficios.
| ATRIBUTO | DETALLES |
| Periodo de estudio | 2020-2029 |
| Año base | 2021 |
| Año estimado | 2022 |
| Año pronosticado | 2022-2029 |
| Periodo histórico | 2018-2020 |
| Unidad | Valor (Millones de USD) (miles de unidades) |
| Segmentación | Por producto, Por tipo, Por aplicación, Por canal de distribución, Por región |
| Por producto |
|
| Por tipo |
|
| Por aplicación |
|
| POR Canal de distribución |
|
| Por región |
|
Los aparatos ortopédicos son cada vez más populares entre los pacientes, tanto en las economías establecidas como en las emergentes, debido a su bajo costo y su fácil disponibilidad. Las lesiones musculoesqueléticas, como esguinces, lesiones de ligamentos y fracturas, son comunes en los deportes y las actividades físicas asociadas. Como resultado, la prevalencia de estas enfermedades está impulsada por la creciente participación pública en dichas actividades. Para enfermedades como la artritis reumatoide, la osteoporosis, la gota y las fracturas, los aparatos ortopédicos y los soportes se están considerando rápidamente como una alternativa clínica viable a la cirugía ortopédica. Varios grupos deportivos públicos y privados y expertos médicos están celebrando conferencias, talleres y simposios para aumentar el conocimiento público sobre el cuidado clínico de las lesiones ortopédicas.
Los médicos y cirujanos ortopédicos consideran que los elementos de soporte y órtesis son vitales desde el punto de vista clínico en diversas circunstancias para tratar adecuadamente las dolencias y enfermedades ortopédicas. Los pacientes no reúnen los requisitos para utilizar elementos de soporte en algunas situaciones (según la gravedad de la afección y sus efectos secundarios, así como la fisiología y la edad del paciente).
Las principales instituciones de usuarios finales (como hospitales, centros quirúrgicos y clínicas ortopédicas) en países desarrollados como Estados Unidos, Alemania, el Reino Unido y Japón están adoptando progresivamente aparatos ortopédicos innovadores. Por otra parte, las instalaciones de usuarios finales en mercados emergentes y en desarrollo dudan en aceptar nuevos productos debido a la falta de conocimiento y de precios. Estos individuos también prefieren los artículos tradicionales/bien establecidos con evidencia clínica documentada que respalde su función terapéutica/diagnóstica.
Dado que requieren modificaciones o ajustes del producto en función de los atributos del paciente, ciertos aparatos ortopédicos solo pueden usarse bajo la supervisión de médicos o técnicos ortopédicos. Sin embargo, dado que su uso no requiere supervisión, los comerciantes y los sitios web de comercio electrónico ofrecen cada vez más diversos aparatos ortopédicos (como tobilleras, muñequeras/manos, hombreras, coderas y faciales). Los pacientes suelen utilizar estos productos para evitar lesiones.
Los principales fabricantes de productos están lanzando campañas estratégicas para aumentar el reconocimiento de la marca y la exposición del producto entre los usuarios finales clave (como médicos, pacientes y fisioterapeutas) en los principales mercados de atención médica de todo el mundo.
[título id="attachment_10388" align="aligncenter" width="870"]
Frequently Asked Questions
Within the orthopaedic braces and supports market, which product segment is projected to gain the most traction?
During the projection period, the knee braces and supports sector is predicted to develop at the fastest rate.
What are the leading market companies' strategy for breaking into emerging markets?
Product launches, collaborations, and partnerships, as well as acquisitions, are among the top growth methods used by the leading competitors in this industry.
What are the primary issues that are predicted to limit the orthopaedic braces and supports market's growth?
The increasing adoption of pain medicines, restricted patient qualification for bracing-mediated orthopaedic therapy, and poor scientific data to support the therapeutic efficacy of orthopaedic braces are the primary issues predicted to impede market growth to some extent in the next years.
Which is the largest regional market for orthopaedic braces and supports market?
The Largest Regional market for orthodontic supplies is APAC having a market share of 39%.
What is the Size of global orthopaedic braces and supports market?
The orthopaedic braces and supports market size had crossed USD 3.19 Billion in 2020 and is expected to grow till USD 5.18 Billion by 2029.
What is the CAGR of orthopaedic braces and supports market?
The global orthopaedic braces and supports market registered a CAGR of 6.20% from 2022 to 2029.
Orthopedic Braces & Supports Market Segment Analysis
The Orthopedic Braces & Supports market is segmented by Product, type, Application, Procedure and Distribution Channel On the basis of Product, global Orthopedic Braces & Supports market is segmented into Knee, Ankle, Hip, Spine, Shoulder, Neck, Elbow, Hand, Wrist. The knee braces and supports segment is expected to grow at the fastest rate during the forecast period, owing to the numerous benefits provided by these products, including medial and lateral support, reduced knee rotation, limited injury during motion, and protection from post-surgical injury risk.
On the basis of type, global Orthopedic Braces & Supports market is segmented into Soft, Rigid, Hinged. the soft braces and supports sector are predicted to develop at the fastest rate. The expanding availability of improved goods, increasing acceptance and patient choice for orthopedic braces in post-operative and preventative care, and the supportive reimbursement environment for target products across mature countries are all contributing to market growth.
On the basis of Application, global Orthopedic Braces & Supports market is segmented into Ligament (ACL, LCL), Preventive, OA. The ligament injury sector is predicted to have the biggest market share. The expanding public engagement in sports and athletic activities (combined with the rising frequency of sports-related injuries), the rising number of accidents globally, and the growing availability of medical reimbursement for ligament injuries all contribute to this segment's size.
On the basis of Distribution Channel, global Orthopedic Braces & Supports market is segmented into Pharmacies, Orthopedic Clinics, Pharmacies & Retailers, E-commerce platforms. hospitals and surgical centers are predicted to be the largest distribution channel category .The rising number of orthopedic surgical procedures that necessitate post-operative patient rehabilitation, as well as favorable reimbursement for customized braces and supports (coupled with the increasing availability of insurance coverage for the surgical treatment of orthopedic disorders such as ligament injury, bone deformity, scoliosis, and osteoporosis) across major countries, are driving market growth.
[caption id="attachment_10387" align="alignleft" width="680"]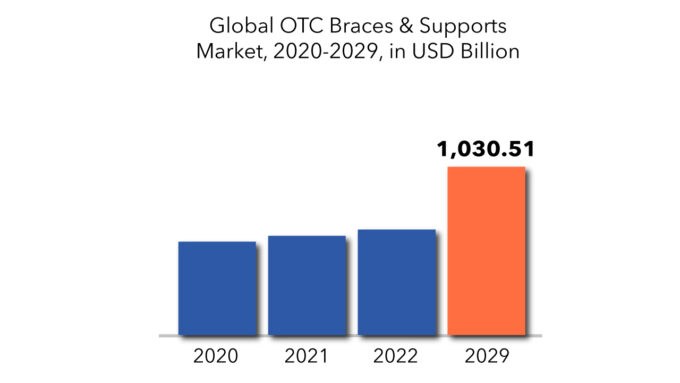
Orthopedic Braces & Supports Market Players
The Key Players in Orthopedic Braces & Supports Market are DJO Finance LLC, Ossur HF, Breg, Inc., Bauerfeind AG, and Essity.Market players used several growth strategies such as launches and enhancements, agreements and partnerships, and acquisitions to strengthen their product portfolios and maintain a competitive position in the analytical instrumentation market, according to an analysis of market developments between 2019 and 2022. Product launches were the most often used growth strategy by market participants among these business strategies.
DJO LLC (US) was the industry leader in orthopedic braces and supports. DJO LLC's leadership position may be attributable to its vast product line of orthopedic braces and supports, as well as its global reach. They are a global orthopedic device manufacturer. The company sells orthopedic braces and supports for a variety of uses, including ligament injuries, preventative care, and post-operative rehabilitation. The corporation has a substantial presence in nations such as the United States, Mexico, Germany, the United Kingdom, France, Belgium, and Sweden. DJO is primarily focused on producing technologically new goods in order to further improve its market position.
Who Should Buy? Or Key Stakeholders
- Industry and consulting firms
- State and national regulatory authorities
- Investors
- Suppliers and Distributors
- Research Institutes
Orthopedic Braces & Supports Market Regional Analysis
Geographically, Orthopedic Braces & Supports market is segmented into North America, Europe, Asia Pacific, and Rest of the world.- North America: includes the US, Canada, Mexico
- Europe: includes UK, Germany, France, Italy, Spain, Russia, and Rest of Europe
- Asia Pacific: includes China, Japan, South Korea, India, Australia, ASEAN and Rest of APAC
The Asia Pacific area is forecasted to be the fastest-growing region. The expanding elderly and obese population (combined with the considerable incidence of orthopedic and diabetes-related disorders in this age group) and increasing healthcare expenditure in APAC nations are driving demand for orthopedic braces and supports. To preserve their market position, top product makers are adopting strategic activities such as product commercialization, owing to the region's significant growth potential.
[caption id="attachment_10389" align="alignleft" width="680"]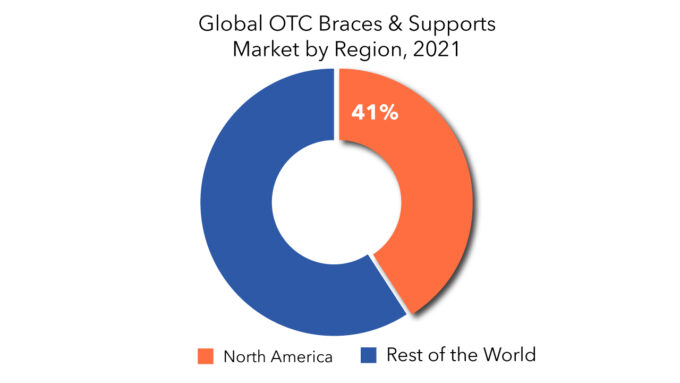
Key Market Segments: Orthopedic Braces & Supports Market
Orthopedic Braces & Supports Market by Product, 2020-2029, (USD Millions)- Knee
- Ankle
- Hip
- Spine
- Shoulder
- Neck
- Elbow
- Hand
- Wrist
- Soft
- Rigid
- Hinged
- Ligament (ACL, LCL)
- Preventive
- OA
- Pharmacies
- Orthopaedic Clinics
- Pharmacies & Retailers
- E-Commerce Platforms
- North America
- Europe
- APAC
- MEA
- Latin America
Key Question Answered
- What is the current market size of this high growth market?
- What is the overall growth rate?
- What are the key growth areas, applications, end uses and types?
- Key reasons for growth
- Challenges for growth
- What technological developments are happening in this area?
- Introducción
- Definición de mercado
- Segmentación del mercado
- Cronología de la investigación
- Supuestos y limitaciones
- Metodología de la investigación
- Minería de datos
- Investigación secundaria
- Investigación primaria
- Asesoramiento de expertos en la materia
- Controles de calidad
- Revisión final
- Triangulación de datos
- Enfoque de abajo hacia arriba
- Enfoque de arriba hacia abajo
- Flujo de investigación
- Fuentes de datos
- Minería de datos
- Resumen ejecutivo
- Descripción general del mercado
- Perspectivas del mercado de aparatos ortopédicos y soportes
- Factores impulsores del mercado
- Restricciones del mercado
- Market Opportunities
- Impact of Covid-19 On Orthopaedic Braces & Supports Market
- Porter’s five forces model
- Threat from new entrants
- Threat from substitutes
- Bargaining power of suppliers
- Bargaining power of customers
- Degree of competition
- Industry value chain Analysis
- Perspectivas del mercado de aparatos ortopédicos y soportes
- Orthopaedic Braces & Supports Market by Product
- Knee
- Ankle
- Hip
- Spine
- Shoulder
- Neck
- Elbow
- Hand
- Wrist
- Orthopaedic Braces & Supports Market by Type
- Soft
- Rigid
- Hinged
- Orthopaedic Braces & Supports Market by Application
- Ligament (ACL, LCL)
- Preventive
- Oa
- Orthopaedic Braces & Supports Market by Distribution channel
- Pharmacies
- Orthopaedic clinics
- Pharmacies & retailers
- E-commerce platforms
- Orthopaedic Braces & Supports Market by Region
- North America
- US
- Canada
- Mexico
- South America
- Brazil
- Argentina
- Colombia
- Rest Of South America
- Europe
- Germany
- UK
- France
- Italy
- Spain
- Russia
- Rest Of Europe
- Asia Pacific
- India
- China
- Japan
- South Korea
- Australia
- South-East Asia
- Rest Of Asia Pacific
- Middle East and Africa
- UAE
- Saudi Arabia
- South Africa
- Rest Of Middle East and Africa
- North America
- Company Profiles* (Business Overview, Company Snapshot, APPLICATIONs Offered, Recent Developments)
- DJO Finance LLC
- Ossur HF
- Breg, Inc.
- Bauerfeind AG
- Essity
*The Company List Is Indicative
LIST OF TABLES
TABLE 1 GLOBAL ORTHOPAEDIC BRACES & SUPPORTS MARKET BY PRODUCT (USD MILLIONS) 2020-2029
TABLE 2 GLOBAL ORTHOPAEDIC BRACES & SUPPORTS MARKET BY TYPE (USD MILLIONS) 2020-2029
TABLE 3 GLOBAL ORTHOPAEDIC BRACES & SUPPORTS MARKET BY APPLICATION (USD MILLIONS) 2020-2029
TABLE 4 GLOBAL ORTHOPAEDIC BRACES & SUPPORTS MARKET BY DISTRIBUTION CHANNEL (USD MILLIONS) 2020-2029
TABLE 5 GLOBAL ORTHOPAEDIC BRACES & SUPPORTS MARKET BY REGION (USD MILLIONS) 2020-2029
TABLE 6 US ORTHOPAEDIC BRACES & SUPPORTS MARKET BY PRODUCT (USD MILLIONS) 2020-2029
TABLE 7 US ORTHOPAEDIC BRACES & SUPPORTS MARKET BY TYPE (USD MILLIONS) 2020-2029
TABLE 8 US ORTHOPAEDIC BRACES & SUPPORTS MARKET BY APPLICATION (USD MILLIONS) 2020-2029
TABLE 9 US ORTHOPAEDIC BRACES & SUPPORTS MARKET BY DISTRIBUTION CHANNEL (USD MILLIONS) 2020-2029
TABLE 10 CANADA ORTHOPAEDIC BRACES & SUPPORTS MARKET BY PRODUCT (USD MILLIONS) 2020-2029
TABLE 11 CANADA ORTHOPAEDIC BRACES & SUPPORTS MARKET BY TYPE (USD MILLIONS) 2020-2029
TABLE 12 CANADA ORTHOPAEDIC BRACES & SUPPORTS MARKET BY APPLICATION (USD MILLIONS) 2020-2029
TABLE 13 CANADA ORTHOPAEDIC BRACES & SUPPORTS MARKET BY DISTRIBUTION CHANNEL (USD MILLIONS) 2020-2029
TABLE 14 MEXICO ORTHOPAEDIC BRACES & SUPPORTS MARKET BY PRODUCT (USD MILLIONS) 2020-2029
TABLE 15 MEXICO ORTHOPAEDIC BRACES & SUPPORTS MARKET BY TYPE (USD MILLIONS) 2020-2029
TABLE 16 MEXICO ORTHOPAEDIC BRACES & SUPPORTS MARKET BY APPLICATION (USD MILLIONS) 2020-2029
TABLE 17 MEXICO ORTHOPAEDIC BRACES & SUPPORTS MARKET BY DISTRIBUTION CHANNEL (USD MILLIONS) 2020-2029
TABLE 18 BRAZIL ORTHOPAEDIC BRACES & SUPPORTS MARKET BY PRODUCT (USD MILLIONS) 2020-2029
TABLE 19 BRAZIL ORTHOPAEDIC BRACES & SUPPORTS MARKET BY TYPE (USD MILLIONS) 2020-2029
TABLE 20 BRAZIL ORTHOPAEDIC BRACES & SUPPORTS MARKET BY APPLICATION (USD MILLIONS) 2020-2029
TABLE 21 BRAZIL ORTHOPAEDIC BRACES & SUPPORTS MARKET BY DISTRIBUTION CHANNEL (USD MILLIONS) 2020-2029
TABLE 22 ARGENTINA ORTHOPAEDIC BRACES & SUPPORTS MARKET BY PRODUCT (USD MILLIONS) 2020-2029
TABLE 23 ARGENTINA ORTHOPAEDIC BRACES & SUPPORTS MARKET BY TYPE (USD MILLIONS) 2020-2029
TABLE 24 ARGENTINA ORTHOPAEDIC BRACES & SUPPORTS MARKET BY APPLICATION (USD MILLIONS) 2020-2029
TABLE 25 ARGENTINA ORTHOPAEDIC BRACES & SUPPORTS MARKET BY DISTRIBUTION CHANNEL (USD MILLIONS) 2020-2029
TABLE 26 COLOMBIA ORTHOPAEDIC BRACES & SUPPORTS MARKET BY PRODUCT (USD MILLIONS) 2020-2029
TABLE 27 COLOMBIA ORTHOPAEDIC BRACES & SUPPORTS MARKET BY TYPE (USD MILLIONS) 2020-2029
TABLE 28 COLOMBIA ORTHOPAEDIC BRACES & SUPPORTS MARKET BY APPLICATION (USD MILLIONS) 2020-2029
TABLE 29 COLOMBIA ORTHOPAEDIC BRACES & SUPPORTS MARKET BY DISTRIBUTION CHANNEL (USD MILLIONS) 2020-2029
TABLE 30 REST OF SOUTH AMERICA ORTHOPAEDIC BRACES & SUPPORTS MARKET BY PRODUCT (USD MILLIONS) 2020-2029
TABLE 31 REST OF SOUTH AMERICA ORTHOPAEDIC BRACES & SUPPORTS MARKET BY TYPE (USD MILLIONS) 2020-2029
TABLE 32 REST OF SOUTH AMERICA ORTHOPAEDIC BRACES & SUPPORTS MARKET BY APPLICATION (USD MILLIONS) 2020-2029
TABLE 33 REST OF SOUTH AMERICA ORTHOPAEDIC BRACES & SUPPORTS MARKET BY DISTRIBUTION CHANNEL (USD MILLIONS) 2020-2029
TABLE 34 INDIA ORTHOPAEDIC BRACES & SUPPORTS MARKET BY PRODUCT (USD MILLIONS) 2020-2029
TABLE 35 INDIA ORTHOPAEDIC BRACES & SUPPORTS MARKET BY TYPE (USD MILLIONS) 2020-2029
TABLE 36 INDIA ORTHOPAEDIC BRACES & SUPPORTS MARKET BY APPLICATION (USD MILLIONS) 2020-2029
TABLE 37 INDIA ORTHOPAEDIC BRACES & SUPPORTS MARKET BY DISTRIBUTION CHANNEL (USD MILLIONS) 2020-2029
TABLE 38 CHINA ORTHOPAEDIC BRACES & SUPPORTS MARKET BY PRODUCT (USD MILLIONS) 2020-2029
TABLE 39 CHINA ORTHOPAEDIC BRACES & SUPPORTS MARKET BY TYPE (USD MILLIONS) 2020-2029
TABLE 40 CHINA ORTHOPAEDIC BRACES & SUPPORTS MARKET BY APPLICATION (USD MILLIONS) 2020-2029
TABLE 41 CHINA ORTHOPAEDIC BRACES & SUPPORTS MARKET BY DISTRIBUTION CHANNEL (USD MILLIONS) 2020-2029
TABLE 42 JAPAN ORTHOPAEDIC BRACES & SUPPORTS MARKET BY PRODUCT (USD MILLIONS) 2020-2029
TABLE 43 JAPAN ORTHOPAEDIC BRACES & SUPPORTS MARKET BY TYPE (USD MILLIONS) 2020-2029
TABLE 44 JAPAN ORTHOPAEDIC BRACES & SUPPORTS MARKET BY APPLICATION (USD MILLIONS) 2020-2029
TABLE 45 JAPAN ORTHOPAEDIC BRACES & SUPPORTS MARKET BY DISTRIBUTION CHANNEL (USD MILLIONS) 2020-2029
TABLE 46 SOUTH KOREA ORTHOPAEDIC BRACES & SUPPORTS MARKET BY PRODUCT (USD MILLIONS) 2020-2029
TABLE 47 SOUTH KOREA ORTHOPAEDIC BRACES & SUPPORTS MARKET BY TYPE (USD MILLIONS) 2020-2029
TABLE 48 SOUTH KOREA ORTHOPAEDIC BRACES & SUPPORTS MARKET BY APPLICATION (USD MILLIONS) 2020-2029
TABLE 49 SOUTH KOREA ORTHOPAEDIC BRACES & SUPPORTS MARKET BY DISTRIBUTION CHANNEL (USD MILLIONS) 2020-2029
TABLE 50 AUSTRALIA ORTHOPAEDIC BRACES & SUPPORTS MARKET BY PRODUCT (USD MILLIONS) 2020-2029
TABLE 51 AUSTRALIA ORTHOPAEDIC BRACES & SUPPORTS MARKET BY TYPE (USD MILLIONS) 2020-2029
TABLE 52 AUSTRALIA ORTHOPAEDIC BRACES & SUPPORTS MARKET BY APPLICATION (USD MILLIONS) 2020-2029
TABLE 53 AUSTRALIA ORTHOPAEDIC BRACES & SUPPORTS MARKET BY DISTRIBUTION CHANNEL (USD MILLIONS) 2020-2029
TABLE 54 SOUTH-EAST ASIA ORTHOPAEDIC BRACES & SUPPORTS MARKET BY PRODUCT (USD MILLIONS) 2020-2029
TABLE 55 SOUTH-EAST ASIA ORTHOPAEDIC BRACES & SUPPORTS MARKET BY TYPE (USD MILLIONS) 2020-2029
TABLE 56 SOUTH-EAST ASIA ORTHOPAEDIC BRACES & SUPPORTS MARKET BY APPLICATION (USD MILLIONS) 2020-2029
TABLE 57 SOUTH-EAST ASIA ORTHOPAEDIC BRACES & SUPPORTS MARKET BY DISTRIBUTION CHANNEL (USD MILLIONS) 2020-2029
TABLE 58 REST OF ASIA PACIFIC ORTHOPAEDIC BRACES & SUPPORTS MARKET BY PRODUCT (USD MILLIONS) 2020-2029
TABLE 59 REST OF ASIA PACIFIC ORTHOPAEDIC BRACES & SUPPORTS MARKET BY TYPE (USD MILLIONS) 2020-2029
TABLE 60 REST OF ASIA PACIFIC ORTHOPAEDIC BRACES & SUPPORTS MARKET BY APPLICATION (USD MILLIONS) 2020-2029
TABLE 61 REST OF ASIA PACIFIC ORTHOPAEDIC BRACES & SUPPORTS MARKET BY DISTRIBUTION CHANNEL (USD MILLIONS) 2020-2029
TABLE 62 GERMANY ORTHOPAEDIC BRACES & SUPPORTS MARKET BY PRODUCT (USD MILLIONS) 2020-2029
TABLE 63 GERMANY ORTHOPAEDIC BRACES & SUPPORTS MARKET BY TYPE (USD MILLIONS) 2020-2029
TABLE 64 GERMANY ORTHOPAEDIC BRACES & SUPPORTS MARKET BY APPLICATION (USD MILLIONS) 2020-2029
TABLE 65 GERMANY ORTHOPAEDIC BRACES & SUPPORTS MARKET BY DISTRIBUTION CHANNEL (USD MILLIONS) 2020-2029
TABLE 66 UK ORTHOPAEDIC BRACES & SUPPORTS MARKET BY PRODUCT (USD MILLIONS) 2020-2029
TABLE 67 UK ORTHOPAEDIC BRACES & SUPPORTS MARKET BY TYPE (USD MILLIONS) 2020-2029
TABLE 68 UK ORTHOPAEDIC BRACES & SUPPORTS MARKET BY APPLICATION (USD MILLIONS) 2020-2029
TABLE 69 UK ORTHOPAEDIC BRACES & SUPPORTS MARKET BY DISTRIBUTION CHANNEL (USD MILLIONS) 2020-2029
TABLE 70 FRANCE ORTHOPAEDIC BRACES & SUPPORTS MARKET BY PRODUCT (USD MILLIONS) 2020-2029
TABLE 71 FRANCE ORTHOPAEDIC BRACES & SUPPORTS MARKET BY TYPE (USD MILLIONS) 2020-2029
TABLE 72 FRANCE ORTHOPAEDIC BRACES & SUPPORTS MARKET BY APPLICATION (USD MILLIONS) 2020-2029
TABLE 73 FRANCE ORTHOPAEDIC BRACES & SUPPORTS MARKET BY DISTRIBUTION CHANNEL (USD MILLIONS) 2020-2029
TABLE 74 ITALY ORTHOPAEDIC BRACES & SUPPORTS MARKET BY PRODUCT (USD MILLIONS) 2020-2029
TABLE 75 ITALY ORTHOPAEDIC BRACES & SUPPORTS MARKET BY TYPE (USD MILLIONS) 2020-2029
TABLE 76 ITALY ORTHOPAEDIC BRACES & SUPPORTS MARKET BY APPLICATION (USD MILLIONS) 2020-2029
TABLE 77 ITALY ORTHOPAEDIC BRACES & SUPPORTS MARKET BY DISTRIBUTION CHANNEL (USD MILLIONS) 2020-2029
TABLE 78 SPAIN ORTHOPAEDIC BRACES & SUPPORTS MARKET BY PRODUCT (USD MILLIONS) 2020-2029
TABLE 79 SPAIN ORTHOPAEDIC BRACES & SUPPORTS MARKET BY TYPE (USD MILLIONS) 2020-2029
TABLE 80 SPAIN ORTHOPAEDIC BRACES & SUPPORTS MARKET BY APPLICATION (USD MILLIONS) 2020-2029
TABLE 81 SPAIN ORTHOPAEDIC BRACES & SUPPORTS MARKET BY DISTRIBUTION CHANNEL (USD MILLIONS) 2020-2029
TABLE 82 RUSSIA ORTHOPAEDIC BRACES & SUPPORTS MARKET BY PRODUCT (USD MILLIONS) 2020-2029
TABLE 83 RUSSIA ORTHOPAEDIC BRACES & SUPPORTS MARKET BY TYPE (USD MILLIONS) 2020-2029
TABLE 84 RUSSIA ORTHOPAEDIC BRACES & SUPPORTS MARKET BY APPLICATION (USD MILLIONS) 2020-2029
TABLE 85 RUSSIA ORTHOPAEDIC BRACES & SUPPORTS MARKET BY DISTRIBUTION CHANNEL (USD MILLIONS) 2020-2029
TABLE 86 REST OF EUROPE ORTHOPAEDIC BRACES & SUPPORTS MARKET BY PRODUCT (USD MILLIONS) 2020-2029
TABLE 87 REST OF EUROPE ORTHOPAEDIC BRACES & SUPPORTS MARKET BY TYPE (USD MILLIONS) 2020-2029
TABLE 88 REST OF EUROPE ORTHOPAEDIC BRACES & SUPPORTS MARKET BY APPLICATION (USD MILLIONS) 2020-2029
TABLE 89 REST OF EUROPE ORTHOPAEDIC BRACES & SUPPORTS MARKET BY DISTRIBUTION CHANNEL (USD MILLIONS) 2020-2029
TABLE 90 UAE ORTHOPAEDIC BRACES & SUPPORTS MARKET BY PRODUCT (USD MILLIONS) 2020-2029
TABLE 91 UAE ORTHOPAEDIC BRACES & SUPPORTS MARKET BY TYPE (USD MILLIONS) 2020-2029
TABLE 92 UAE ORTHOPAEDIC BRACES & SUPPORTS MARKET BY APPLICATION (USD MILLIONS) 2020-2029
TABLE 93 UAE ORTHOPAEDIC BRACES & SUPPORTS MARKET BY DISTRIBUTION CHANNEL (USD MILLIONS) 2020-2029
TABLE 94 SAUDI ARABIA ORTHOPAEDIC BRACES & SUPPORTS MARKET BY PRODUCT (USD MILLIONS) 2020-2029
TABLE 95 SAUDI ARABIA ORTHOPAEDIC BRACES & SUPPORTS MARKET BY TYPE (USD MILLIONS) 2020-2029
TABLE 96 SAUDI ARABIA ORTHOPAEDIC BRACES & SUPPORTS MARKET BY APPLICATION (USD MILLIONS) 2020-2029
TABLE 97 SAUDI ARABIA ORTHOPAEDIC BRACES & SUPPORTS MARKET BY DISTRIBUTION CHANNEL (USD MILLIONS) 2020-2029
TABLE 98 SOUTH AFRICA ORTHOPAEDIC BRACES & SUPPORTS MARKET BY PRODUCT (USD MILLIONS) 2020-2029
TABLE 99 SOUTH AFRICA ORTHOPAEDIC BRACES & SUPPORTS MARKET BY TYPE (USD MILLIONS) 2020-2029
TABLE 100 SOUTH AFRICA ORTHOPAEDIC BRACES & SUPPORTS MARKET BY APPLICATION (USD MILLIONS) 2020-2029
TABLE 101 SOUTH AFRICA ORTHOPAEDIC BRACES & SUPPORTS MARKET BY DISTRIBUTION CHANNEL (USD MILLIONS) 2020-2029
TABLE 102 REST OF MIDDLE EAST AND AFRICA ORTHOPAEDIC BRACES & SUPPORTS MARKET BY PRODUCT (USD MILLIONS) 2020-2029
TABLE 103 REST OF MIDDLE EAST AND AFRICA ORTHOPAEDIC BRACES & SUPPORTS MARKET BY TYPE (USD MILLIONS) 2020-2029
TABLE 104 REST OF MIDDLE EAST AND AFRICA ORTHOPAEDIC BRACES & SUPPORTS MARKET BY APPLICATION (USD MILLIONS) 2020-2029
TABLE 105 REST OF MIDDLE EAST AND AFRICA ORTHOPAEDIC BRACES & SUPPORTS MARKET BY DISTRIBUTION CHANNEL (USD MILLIONS) 2020-2029
LIST OF FIGURES
FIGURE 1 MARKET DYNAMICS
FIGURE 2 MARKET SEGMENTATION
FIGURE 3 REPORT TIMELINES: YEARS CONSIDERED
FIGURE 4 DATA TRIANGULATION
FIGURE 5 BOTTOM-UP APPROACH
FIGURE 6 TOP-DOWN APPROACH
FIGURE 7 RESEARCH FLOW
FIGURE 8 ORTHOPAEDIC BRACES & SUPPORTS MARKET BY PRODUCT, USD MILLION, 2020-2029
FIGURE 9 ORTHOPAEDIC BRACES & SUPPORTS MARKET BY TYPE, USD MILLION, 2020-2029
FIGURE 10 ORTHOPAEDIC BRACES & SUPPORTS MARKET BY APPLICATION, USD MILLION, 2020-2029
FIGURE 11 ORTHOPAEDIC BRACES & SUPPORTS MARKET BY DISTRIBUTION CHANNEL, USD MILLION, 2020-2029
FIGURE 12 ORTHOPAEDIC BRACES & SUPPORTS MARKET BY REGION, USD MILLION, 2020-2029
FIGURE 13 PORTER’S FIVE FORCES MODEL
FIGURE 14 NORTH AMERICA ORTHOPAEDIC BRACES & SUPPORTS MARKET SNAPSHOT
FIGURE 15 EUROPE ORTHOPAEDIC BRACES & SUPPORTS MARKET SNAPSHOT
FIGURE 16 ASIA PACIFIC ORTHOPAEDIC BRACES & SUPPORTS MARKET SNAPSHOT
FIGURE 17 SOUTH AMERICA ORTHOPAEDIC BRACES & SUPPORTS MARKET SNAPSHOT
FIGURE 18 MIDDLE EAST & AFRICA ORTHOPAEDIC BRACES & SUPPORTS MARKET SNAPSHOT
FIGURE 19 DJO FINANCE LLC COMPANY SNAPSHOT
FIGURE 20 OSSUR HF COMPANY SNAPSHOT
FIGURE 21 BREG, INC. COMPANY SNAPSHOT
FIGURE 22 BAUERFEIND AG COMPANY SNAPSHOT
FIGURE 23 ESSITY. COMPANY SNAPSHOT
DOWNLOAD FREE SAMPLE REPORT
License Type
SPEAK WITH OUR ANALYST
Want to know more about the report or any specific requirement?
WANT TO CUSTOMIZE THE REPORT?
Our Clients Speak
We asked them to research ‘ Equipment market’ all over the world, and their whole arrangement was helpful to us. thehealthanalytics.com insightful analysis and reports contributed to our current analysis and in creating a future strategy. Besides, the te
Yosuke Mitsui
Senior Associate Construction Equipment Sales & Marketing
We asked them to research ‘Equipment market’ all over the world, and their whole arrangement was helpful to us. thehealthanalytics.com insightful analysis and reports contributed to our current analysis and in creating a future strategy. Besides, the te


