

Base Year Value ()
x.x %
x.x %
CAGR ()
x.x %
x.x %
Forecast Year Value ()
x.x %
x.x %
Historical Data Period
Largest Region
Forecast Period
Mercado de diagnóstico de cáncer por producto (consumibles e instrumentos), aplicación (cáncer de mama, cáncer de pulmón, cáncer de sangre, cáncer colorrectal, cáncer de piel, cáncer de ovario, cáncer de próstata, cáncer de riñón, cáncer de hígado, cáncer de páncreas, cáncer de cuello uterino y otros), uso final (hospitales y clínicas, laboratorios de diagnóstico, centros de diagnóstico e institutos de investigación) y por región (América del Norte, América Latina, Europa, Asia Pacífico y Oriente Medio y África), tendencias globales y pronóstico de 2022 a 2029
Instant access to hundreds of data points and trends
- Market estimates from 2014-2029
- Competitive analysis, industry segmentation, financial benchmarks
- Incorporates SWOT, Porter's Five Forces and risk management frameworks
- PDF report or online database with Word, Excel and PowerPoint export options
- 100% money back guarantee
Descripción general del mercado de diagnóstico del cáncer
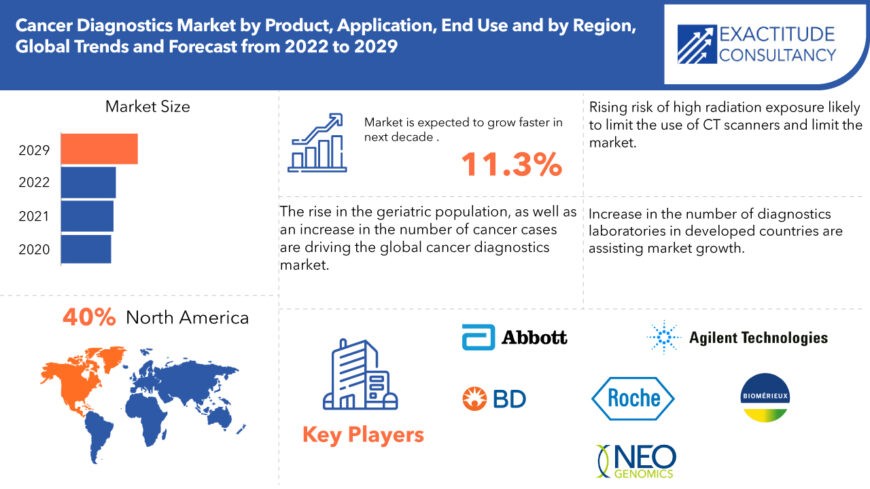
El tamaño del mercado de diagnóstico de cáncer se valoró en USD 16,87 mil millones en 2020 y se proyecta que alcance los USD 44,22 mil millones para 2029, creciendo a una CAGR del 11,3% entre 2022 y 2029.
Los métodos actuales de diagnóstico y tratamiento del cáncer presentan graves defectos. Desde hace una década, han surgido nuevas nanoplataformas que proporcionan funciones diagnósticas y terapéuticas simultáneas para el cáncer, denominadas agentes teranósticos o simplemente teranósticos, como resultado del aumento del conocimiento y el avance tecnológico en la biología del cáncer, la ciencia de los materiales y, en particular, la nanomedicina. Estos nanodispositivos innovadores pueden dirigirse a varios marcadores del cáncer y matar células cancerosas de manera sinérgica, superando la heterogeneidad del cáncer y las dificultades de resistencia adaptativa. Además, los medicamentos teranósticos contra el cáncer pueden ser dirigidos por los resultados de las imágenes de diagnóstico, lo que da como resultado un mejor tratamiento del cáncer. Los teranósticos ideales deberían tener un tamaño compacto y una química de superficie para una absorción celular eficiente, imágenes ultrasensibles de muchos marcadores específicos del tumor , una capacidad deseable de focalización del cáncer y una alta carga y liberación controlada de medicamentos contra el cáncer, en diseños particulares. En la mayoría de los diseños se requieren otros medicamentos contra el cáncer, además de la quimioterapia. Se requieren avances en la ciencia y la ingeniería de los materiales, en particular la producción de nanocompuestos, para satisfacer estas necesidades multifuncionales de los teranósticos.
Los avances en el diagnóstico y el tratamiento del cáncer han dado lugar a un gran aumento de las tasas de supervivencia, en particular entre los niños con cáncer, lo que ha dado lugar a un cambio de paradigma en la atención hacia la supervivencia a largo plazo y las cuestiones relacionadas con la calidad de vida. Si bien las funciones cardíaca, pulmonar, renal y hepática se evalúan de forma rutinaria antes, durante y después del tratamiento, no se hace lo mismo con el sistema reproductivo. A medida que más niñas y mujeres sobreviven al cáncer, es más importante que nunca predecir los efectos del cáncer y su tratamiento en el ovario y ofrecer opciones para proteger la función reproductiva y sexual de esta población en el futuro.
| ATRIBUTO | DETALLES |
| Periodo de estudio | 2020-2029 |
| Año base | 2021 |
| Año estimado | 2022 |
| Año pronosticado | 2022-2029 |
| Periodo histórico | 2018-2020 |
| Unit | Value (USD Billion) |
| Segmentation | By Product, By Application, By End Use, Region |
| By Product |
|
| By Application |
|
| By End Use |
|
| By Region |
|
The cancer diagnostics market would grow due to an increase in the incidence and prevalence of various types of cancer, such as breast cancer and lung cancer, over the forecast period. Furthermore, during the projection period, the cancer diagnostics sector will benefit from a surge in technical breakthroughs that aid in improved imaging of cancerous cells, improvements in equipment to detect the kind of cancer, and an increase in the efficiency of the results. Increased government activities and other private organisations aimed at raising awareness about early cancer detection and prevention are expected to drive market expansion in the future years. Furthermore, in the coming years, the market is likely to be driven by an increase in the number of diagnostics laboratories in developed countries. During the forecast period, a sharp increase in emphasis on health and safety laws, as well as a surge in popularity of yoga and other health-related practises, will provide a growth opportunity.
Government rules, a nationwide lockdown, and a spike in infection rates across countries all had a significant financial impact on neurology hospitals and clinics. Several hospitals and clinics have seen a decrease in patient visits as a result of COVID-19, resulting in reduced client engagement. Furthermore, the COVID-19 situation has caused numerous cancer tests to be delayed. There is a scarcity of medical care for disorders other than COVID-19 around the world, which has had a negative impact on the cancer diagnostics business. At the same time, limited healthcare staff availability around the world is another aspect that has a negative impact on the cancer diagnostics market.
Increased understanding of certain cancer biomarkers is creating a huge commercial opportunity for treating cancer patients through improving detection. The identification of prospective cancer biomarkers has been made possible by technological advances in the field of biotechnology, and some of these biomarkers have been marketed.
Sin embargo, el aumento de las inversiones de capital y la baja relación costo-beneficio de los biomarcadores, la creciente escasez de helio y el creciente riesgo de exposición a altas radiaciones que probablemente limiten el uso de los escáneres de TC se encuentran entre los principales factores que obstruyen el crecimiento del mercado, mientras que las directrices regulatorias cada vez más estrictas y la creciente adopción de sistemas de diagnóstico por imágenes renovados desafiarán aún más el crecimiento del mercado en el período de pronóstico. Debido al aumento de los costos, las menores tasas de reembolso y las limitaciones presupuestarias, muchos hospitales en las naciones más pobres no pueden invertir en tecnología de diagnóstico por imágenes. Sin embargo, debido a la creciente demanda de operaciones de diagnóstico por imágenes en estos países, los hospitales que no pueden permitirse comprar nuevos equipos de diagnóstico por imágenes optan por utilizar sistemas de segunda mano. Los sistemas renovados son menos costosos que los sistemas nuevos, ya que cuestan entre el 40% y el 60% del precio de compra original.
[título id="attachment_10932" align="aligncenter" width="870"]
Frequently Asked Questions
• What is the worth of global cancer diagnostics market?
The cancer diagnostics market size was valued at USD 16.87 billion in 2020 and is projected to reach USD 44.22 billion by 2029, growing at a CAGR of 11.3% from 2022 to 2029 due to an increase in the incidence and prevalence of various types of cancer.
• What is the size of the North America cancer diagnostics industry?
North America held more than 40% of the cancer diagnostics market revenue share in 2021. Technological breakthroughs in diagnostic tests, rising healthcare spending, and more patient knowledge about early cancer diagnosis are some of the major reasons driving diagnostics adoption in the region.
• What are the upcoming trends of cancer diagnostics market, globally?
Cancer research organizations, as well as public and commercial entities, are substantially investing in research initiatives in order to bring better diagnostic tools to market that can diagnose the disease long before symptoms occur.
• What is the CAGR of cancer diagnostics market?
The global cancer diagnostics market registered a CAGR of 11.3% from 2022 to 2029. The consumables segment is the major revenue contributor in the market.
• Which are the top companies to hold the market share in cancer diagnostics market?
Key players profiled in the report include Abbott, Agilent Technologies, Inc., BD, bioMérieux SA, NeoGenomics Laboratories, Inc., Telerad Tech, F. Hoffmann-La Roche Ltd and others are dominating the market share.
• What is the leading application of cancer diagnostics market?
The breast cancer segment is the largest application in the cancer diagnostics market.
• Which is the largest regional market for cancer diagnostics market?
North America is the largest market for cancer diagnostics market.
Cancer Diagnostics Market Segment Analysis
On the basis of product, the consumables segment is the major revenue contributor, and is projected to grow significantly during the forecast period. Increased adoption of consumables for cancer diagnostics, an increase in cancer prevalence, an increase in R&D investment, an increase in the geriatric population, the introduction of technologically advanced products, and an increase in the launch of new & advanced kits and reagents are all driving the segment's growth.
Due to the rise in breast cancer occurrence around the world and an increase in the population of women aged 50 to 74, the breast cancer segment is the largest stakeholder in the cancer diagnostics market, depending on application. In the next years, an increase in the number of efforts conducted by various groups will help the industry gain traction.
The hospitals & clinics segment, based on end use, is the largest shareholder in the cancer diagnostics market, owing to an increase in the number of patients visiting hospitals, an increase in the number of in-house diagnostic procedures performed in hospitals, and an increase in awareness about early diagnosis, all of which are major driving factors for this market.
[caption id="attachment_10937" align="alignleft" width="680"]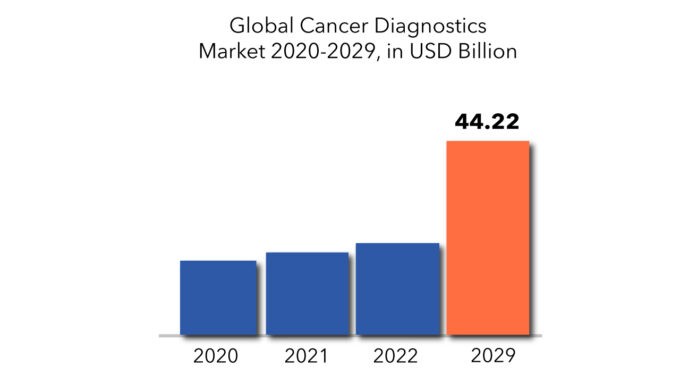
Cancer Diagnostics Market Players
The major players covered in the cancer diagnostics market report are Abbott, Agilent Technologies, Inc., BD, BioMérieux SA, NeoGenomics Laboratories, Inc., Telerad Tech, F. Hoffmann-La Roche Ltd, GENERAL ELECTRIC COMPANY, Hologic Inc., Illumina, Inc., QIAGEN, BioGenex, Siemens Healthcare GmbH, BioNTech Diagnostics GmbH, Thermo Fisher Scientific Inc. and Koninklijke Philips N.V. among other domestic and global players.
- Abbott is a globally diversified healthcare company with a central purpose to help people live their healthiest possible lives. We offer a broad portfolio of market-leading products that align with favourable long-term healthcare trends in both developed and developing markets.
- Agilent Technologies, Inc. is an American analytical instrumentation development and manufacturing company that offers its products and services to markets worldwide. Its global headquarters is located in Santa Clara, California. Agilent was established in 1999 as a spin-off from Hewlett-Packard.
- NeoGenomics is a premier cancer diagnostic, pharma services, and information services company serving oncologists, pathologists, pharmaceutical companies, and academic centres in their pursuit of providing better futures for people living with cancer.
Who Should Buy? Or Key Stakeholders
- Healthcare Industry
- Hospitals and Clinics
- Medical Laboratories
- Pharmaceutical Industry
- Scientific Research and Development
- Investors
- Manufacturing companies
- End user companies
- Others
Cancer Diagnostics Market Regional Analysis
The global cancer diagnostics market by region includes North America, Asia-Pacific (APAC), Europe, South America, and Middle East & Africa (MEA).
- North America: includes the US, Canada, Mexico
- Asia Pacific: includes China, Japan, South Korea, India, Australia, ASEAN and Rest of APAC
- Europe: includes UK, Germany, France, Italy, Spain, Russia, and Rest of Europe
- South America: includes Brazil, Argentina and Rest of South America
- Middle East & Africa: includes Turkey, UAE, Saudi Arabia, South Africa, and Rest of MEA
North America is predicted to play a significant role in the growth of the cancer diagnostics industry. The emergence of COVID-19 had a negative impact on the market examined in the region. According to the Union for International Cancer Controls (UICC), cancer diagnosis rates in the United States dropped significantly during the epidemic. According to the survey's findings, the number of newly diagnosed metastatic non-small cell lung cancer patients decreased by just over 30% from February to March 2020. Colorectal cancer (14 percent), acute myeloid leukaemia (14 percent), breast cancer (8.4%), and ovarian cancer (14 percent) also saw declines (8.6 percent). Such occurrences point to a decrease in cancer diagnosis rates during the pandemic era.
[caption id="attachment_10938" align="alignnone" width="680"]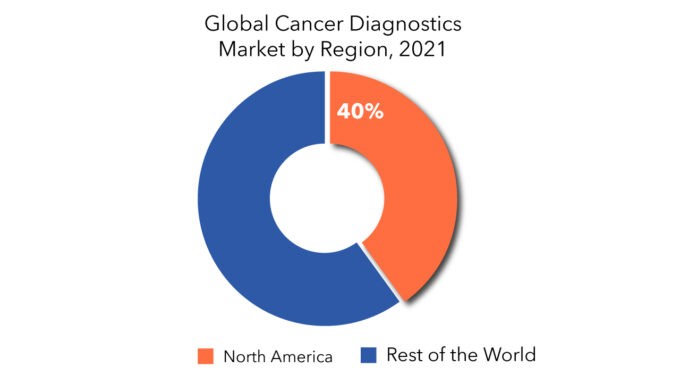
Key Market Segments: Cancer Diagnostics Market
Cancer Diagnostics Market By Product, 2020-2029, (USD Million)- Consumables
- Instruments
- Breast Cancer
- Lung Cancer
- Blood Cancer
- Colorectal Cancer
- Skin Cancer
- Ovarian Cancer
- Prostate Cancer
- Kidney Cancer
- Liver Cancer
- Pancreatic Cancer
- Cervical Cancer
- Hospitals & Clinics
- Diagnostic Laboratories
- Diagnostic Centres
- Research Institutes
- North America
- Europe
- Asia Pacific
- South America
- Middle East and Africa
Key Question Answered
- What are the growth opportunities related to the adoption of cancer diagnostics across major regions in the future?
- What are the new trends and advancements in the cancer diagnostics market?
- Which product categories are expected to have highest growth rate in the cancer diagnostics market?
- Which are the key factors driving the cancer diagnostics market?
- What will the market growth rate, growth momentum or acceleration the market carries during the forecast period?
- Introducción
- Definición de mercado
- Segmentación del mercado
- Cronología de la investigación
- Supuestos y limitaciones
- Metodología de la investigación
- Minería de datos
- Investigación secundaria
- Investigación primaria
- Asesoramiento de expertos en la materia
- Controles de calidad
- Revisión final
- Triangulación de datos
- Enfoque de abajo hacia arriba
- Enfoque de arriba hacia abajo
- Flujo de investigación
- Fuentes de datos
- Minería de datos
- Resumen ejecutivo
- Descripción general del mercado
- Perspectivas del mercado mundial de diagnóstico del cáncer
- Factores impulsores del mercado
- Restricciones del mercado
- Oportunidades de mercado
- Impacto de la COVID-19 en el mercado mundial de diagnóstico del cáncer
- Perspectivas del mercado mundial de diagnóstico del cáncer
- Mercado mundial de diagnóstico del cáncer por producto (millones de USD)
- Consumibles
- Instrumentos
- Mercado mundial de diagnóstico del cáncer por aplicación (millones de USD)
- Cáncer de mama
- Cáncer de pulmón
- Cáncer de sangre
- Cáncer colorrectal
- Cáncer de piel
- Cáncer de ovario
- Cáncer de próstata
- Cáncer de riñón
- Cáncer de hígado
- Cáncer de páncreas
- Cáncer de cuello uterino
- Mercado mundial de diagnóstico del cáncer por uso final (millones de USD)
- Hospitales y clínicas
- Laboratorios de diagnóstico
- Centros de diagnóstico
- Institutos de investigación
- Mercado mundial de diagnóstico del cáncer por región (millones de USD)
- Introducción
- Asia-Pacífico
- Porcelana
- India
- Japón
- Corea del Sur
- Australia
- Sudeste asiático
- Resto de Asia-Pacífico
- América del norte
- Estados Unidos
- Canadá
- México
- Europa
- Alemania
- Reino Unido
- Francia
- Italia
- España
- Rusia
- Resto de Europa
- Sudamerica
- Brasil
- Argentina
- Colombia
- Resto de Sudamérica
- Oriente Medio y África
- Emiratos Árabes Unidos
- Arabia Saudita
- Sudáfrica
- Resto de Oriente Medio y África
- Perfiles de empresas* (descripción general de la empresa, descripción general de la empresa, aplicaciones ofrecidas, desarrollos recientes)
- Abad
- Tecnologías Agilent, Inc.
- BD
- BioMérieux SA
- Laboratorios NeoGenomics, Inc.
- Tecnología Telerad
- Hoffmann-La Roche Ltd
- Compañía hologica inc.
- Ilumina, Inc.
- QIAGEN
- BioGenex
- Siemens Healthcare GmbH
- BioNTech Diagnostics GmbH
- Otros *El listado de empresas es orientativo
LISTA DE TABLAS
TABLE 1 GLOBAL CANCER DIAGNOSTICS MARKET BY PRODUCT (USD MILLIONS) 2020-2029
TABLE 2 GLOBAL CANCER DIAGNOSTICS MARKET BY APPLICATION (USD MILLIONS) 2020-2029
TABLE 3 GLOBAL CANCER DIAGNOSTICS MARKET BY END USE (USD MILLIONS) 2020-2029
TABLE 4 GLOBAL CANCER DIAGNOSTICS MARKET BY REGION (USD MILLIONS) 2020-2029
TABLE 5 US CANCER DIAGNOSTICS MARKET BY PRODUCT (USD MILLIONS) 2020-2029
TABLE 6 US CANCER DIAGNOSTICS MARKET BY APPLICATION (USD MILLIONS) 2020-2029
TABLE 7 US CANCER DIAGNOSTICS MARKET BY END USE (USD MILLIONS) 2020-2029
TABLE 8 CANADA CANCER DIAGNOSTICS MARKET BY PRODUCT (USD MILLIONS) 2020-2029
TABLE 9 CANADA CANCER DIAGNOSTICS MARKET BY APPLICATION (USD MILLIONS) 2020-2029
TABLE 10 CANADA CANCER DIAGNOSTICS MARKET BY END USE (USD MILLIONS) 2020-2029
TABLE 11 MEXICO CANCER DIAGNOSTICS MARKET BY PRODUCT (USD MILLIONS) 2020-2029
TABLE 12 MEXICO CANCER DIAGNOSTICS MARKET BY APPLICATION (USD MILLIONS) 2020-2029
TABLE 13 MEXICO CANCER DIAGNOSTICS MARKET BY END USE (USD MILLIONS) 2020-2029
TABLE 14 BRAZIL CANCER DIAGNOSTICS MARKET BY PRODUCT (USD MILLIONS) 2020-2029
TABLE 15 BRAZIL CANCER DIAGNOSTICS MARKET BY APPLICATION (USD MILLIONS) 2020-2029
TABLE 16 BRAZIL CANCER DIAGNOSTICS MARKET BY END USE (USD MILLIONS) 2020-2029
TABLE 17 ARGENTINA CANCER DIAGNOSTICS MARKET BY PRODUCT (USD MILLIONS) 2020-2029
TABLE 18 ARGENTINA CANCER DIAGNOSTICS MARKET BY APPLICATION (USD MILLIONS) 2020-2029
TABLE 19 ARGENTINA CANCER DIAGNOSTICS MARKET BY END USE (USD MILLIONS) 2020-2029
TABLE 20 COLOMBIA CANCER DIAGNOSTICS MARKET BY PRODUCT (USD MILLIONS) 2020-2029
TABLE 21 COLOMBIA CANCER DIAGNOSTICS MARKET BY APPLICATION (USD MILLIONS) 2020-2029
TABLE 22 COLOMBIA CANCER DIAGNOSTICS MARKET BY END USE (USD MILLIONS) 2020-2029
TABLE 23 REST OF SOUTH AMERICA CANCER DIAGNOSTICS MARKET BY PRODUCT (USD MILLIONS) 2020-2029
TABLE 24 REST OF SOUTH AMERICA CANCER DIAGNOSTICS MARKET BY APPLICATION (USD MILLIONS) 2020-2029
TABLE 25 REST OF SOUTH AMERICA CANCER DIAGNOSTICS MARKET BY END USE (USD MILLIONS) 2020-2029
TABLE 26 INDIA CANCER DIAGNOSTICS MARKET BY PRODUCT (USD MILLIONS) 2020-2029
TABLE 27 INDIA CANCER DIAGNOSTICS MARKET BY APPLICATION (USD MILLIONS) 2020-2029
TABLE 28 INDIA CANCER DIAGNOSTICS MARKET BY END USE (USD MILLIONS) 2020-2029
TABLE 29 CHINA CANCER DIAGNOSTICS MARKET BY PRODUCT (USD MILLIONS) 2020-2029
TABLE 30 CHINA CANCER DIAGNOSTICS MARKET BY APPLICATION (USD MILLIONS) 2020-2029
TABLE 31 CHINA CANCER DIAGNOSTICS MARKET BY END USE (USD MILLIONS) 2020-2029
TABLE 32 JAPAN CANCER DIAGNOSTICS MARKET BY PRODUCT (USD MILLIONS) 2020-2029
TABLE 33 JAPAN CANCER DIAGNOSTICS MARKET BY APPLICATION (USD MILLIONS) 2020-2029
TABLE 34 JAPAN CANCER DIAGNOSTICS MARKET BY END USE (USD MILLIONS) 2020-2029
TABLE 35 SOUTH KOREA CANCER DIAGNOSTICS MARKET BY PRODUCT (USD MILLIONS) 2020-2029
TABLE 36 SOUTH KOREA CANCER DIAGNOSTICS MARKET BY APPLICATION (USD MILLIONS) 2020-2029
TABLE 37 SOUTH KOREA CANCER DIAGNOSTICS MARKET BY END USE (USD MILLIONS) 2020-2029
TABLE 38 AUSTRALIA CANCER DIAGNOSTICS MARKET BY PRODUCT (USD MILLIONS) 2020-2029
TABLE 39 AUSTRALIA CANCER DIAGNOSTICS MARKET BY APPLICATION (USD MILLIONS) 2020-2029
TABLE 40 AUSTRALIA CANCER DIAGNOSTICS MARKET BY END USE (USD MILLIONS) 2020-2029
TABLE 41 SOUTH-EAST ASIA CANCER DIAGNOSTICS MARKET BY PRODUCT (USD MILLIONS) 2020-2029
TABLE 42 SOUTH-EAST ASIA CANCER DIAGNOSTICS MARKET BY APPLICATION (USD MILLIONS) 2020-2029
TABLE 43 SOUTH-EAST ASIA CANCER DIAGNOSTICS MARKET BY END USE (USD MILLIONS) 2020-2029
TABLE 44 REST OF ASIA PACIFIC CANCER DIAGNOSTICS MARKET BY PRODUCT (USD MILLIONS) 2020-2029
TABLE 45 REST OF ASIA PACIFIC CANCER DIAGNOSTICS MARKET BY APPLICATION (USD MILLIONS) 2020-2029
TABLE 46 REST OF ASIA PACIFIC CANCER DIAGNOSTICS MARKET BY END USE (USD MILLIONS) 2020-2029
TABLE 47 GERMANY CANCER DIAGNOSTICS MARKET BY PRODUCT (USD MILLIONS) 2020-2029
TABLE 48 GERMANY CANCER DIAGNOSTICS MARKET BY APPLICATION (USD MILLIONS) 2020-2029
TABLE 49 GERMANY CANCER DIAGNOSTICS MARKET BY END USE (USD MILLIONS) 2020-2029
TABLE 50 UK CANCER DIAGNOSTICS MARKET BY PRODUCT (USD MILLIONS) 2020-2029
TABLE 51 UK CANCER DIAGNOSTICS MARKET BY APPLICATION (USD MILLIONS) 2020-2029
TABLE 52 UK CANCER DIAGNOSTICS MARKET BY END USE (USD MILLIONS) 2020-2029
TABLE 53 FRANCE CANCER DIAGNOSTICS MARKET BY PRODUCT (USD MILLIONS) 2020-2029
TABLE 54 FRANCE CANCER DIAGNOSTICS MARKET BY APPLICATION (USD MILLIONS) 2020-2029
TABLE 55 FRANCE CANCER DIAGNOSTICS MARKET BY END USE (USD MILLIONS) 2020-2029
TABLE 56 ITALY CANCER DIAGNOSTICS MARKET BY PRODUCT (USD MILLIONS) 2020-2029
TABLE 57 ITALY CANCER DIAGNOSTICS MARKET BY APPLICATION (USD MILLIONS) 2020-2029
TABLE 58 ITALY CANCER DIAGNOSTICS MARKET BY END USE (USD MILLIONS) 2020-2029
TABLE 59 SPAIN CANCER DIAGNOSTICS MARKET BY PRODUCT (USD MILLIONS) 2020-2029
TABLE 60 SPAIN CANCER DIAGNOSTICS MARKET BY APPLICATION (USD MILLIONS) 2020-2029
TABLE 61 SPAIN CANCER DIAGNOSTICS MARKET BY END USE (USD MILLIONS) 2020-2029
TABLE 62 RUSSIA CANCER DIAGNOSTICS MARKET BY PRODUCT (USD MILLIONS) 2020-2029
TABLE 63 RUSSIA CANCER DIAGNOSTICS MARKET BY APPLICATION (USD MILLIONS) 2020-2029
TABLE 64 RUSSIA CANCER DIAGNOSTICS MARKET BY END USE (USD MILLIONS) 2020-2029
TABLE 65 REST OF EUROPE CANCER DIAGNOSTICS MARKET BY PRODUCT (USD MILLIONS) 2020-2029
TABLE 66 REST OF EUROPE CANCER DIAGNOSTICS MARKET BY APPLICATION (USD MILLIONS) 2020-2029
TABLE 67 REST OF EUROPE CANCER DIAGNOSTICS MARKET BY END USE (USD MILLIONS) 2020-2029
TABLE 68 UAE CANCER DIAGNOSTICS MARKET BY PRODUCT (USD MILLIONS) 2020-2029
TABLE 69 UAE CANCER DIAGNOSTICS MARKET BY APPLICATION (USD MILLIONS) 2020-2029
TABLE 70 UAE CANCER DIAGNOSTICS MARKET BY END USE (USD MILLIONS) 2020-2029
TABLE 71 SAUDI ARABIA CANCER DIAGNOSTICS MARKET BY PRODUCT (USD MILLIONS) 2020-2029
TABLE 72 SAUDI ARABIA CANCER DIAGNOSTICS MARKET BY APPLICATION (USD MILLIONS) 2020-2029
TABLE 73 SAUDI ARABIA CANCER DIAGNOSTICS MARKET BY END USE (USD MILLIONS) 2020-2029
TABLE 74 SOUTH AFRICA CANCER DIAGNOSTICS MARKET BY PRODUCT (USD MILLIONS) 2020-2029
TABLE 75 SOUTH AFRICA CANCER DIAGNOSTICS MARKET BY APPLICATION (USD MILLIONS) 2020-2029
TABLE 76 SOUTH AFRICA CANCER DIAGNOSTICS MARKET BY END USE (USD MILLIONS) 2020-2029
TABLE 77 REST OF MIDDLE EAST AND AFRICA CANCER DIAGNOSTICS MARKET BY PRODUCT (USD MILLIONS) 2020-2029
TABLE 78 REST OF MIDDLE EAST AND AFRICA CANCER DIAGNOSTICS MARKET BY APPLICATION (USD MILLIONS) 2020-2029
TABLE 79 REST OF MIDDLE EAST AND AFRICA CANCER DIAGNOSTICS MARKET BY END USE (USD MILLIONS) 2020-2029
LIST OF FIGURES
FIGURE 1 MARKET DYNAMICS
FIGURE 2 MARKET SEGMENTATION
FIGURE 3 REPORT TIMELINES: YEARS CONSIDERED
FIGURE 4 DATA TRIANGULATION
FIGURE 5 BOTTOM-UP APPROACH
FIGURE 6 TOP-DOWN APPROACH
FIGURE 7 RESEARCH FLOW
FIGURE 8 GLOBAL CANCER DIAGNOSTICS MARKETBY PRODUCT, USD MILLION, 2020-2029
FIGURE 10 GLOBAL CANCER DIAGNOSTICS MARKETBY APPLICATION, USD MILLION, 2020-2029
FIGURE 11 GLOBAL CANCER DIAGNOSTICS MARKETBY END USE, USD MILLION, 2020-2029
FIGURE 12 GLOBAL CANCER DIAGNOSTICS MARKETBY REGION, USD MILLION, 2020-2029
FIGURE 13 PORTER’S FIVE FORCES MODEL
FIGURE 14 GLOBAL CANCER DIAGNOSTICS MARKETBY PRODUCT, 2020
FIGURE 15 GLOBAL CANCER DIAGNOSTICS MARKETBY APPLICATION 2020
FIGURE 16 GLOBAL CANCER DIAGNOSTICS MARKETBY END USE 2020
FIGURE 17 CANCER DIAGNOSTICS MARKETBY REGION 2020
FIGURE 18 MARKET SHARE ANALYSIS
FIGURE 19 ABBOTT: COMPANY SNAPSHOT
FIGURE 20 AGILENT TECHNOLOGIES, INC.: COMPANY SNAPSHOT
FIGURE 21 BD: COMPANY SNAPSHOT
FIGURE 22 BIOMÉRIEUX SA: COMPANY SNAPSHOT
FIGURE 23 NEOGENOMICS LABORATORIES, INC.: COMPANY SNAPSHOT
FIGURE 24 TELERAD TECH: COMPANY SNAPSHOT
FIGURE 25 F. HOFFMANN-LA ROCHE LTD: COMPANY SNAPSHOT
FIGURE 26 HOLOGIC INC.: COMPANY SNAPSHOT
FIGURE 27 ILLUMINA, INC.: COMPANY SNAPSHOT
FIGURE 28 QIAGEN: COMPANY SNAPSHOT
FIGURE 29 BIOGENEX: COMPANY SNAPSHOT
DOWNLOAD FREE SAMPLE REPORT
License Type
SPEAK WITH OUR ANALYST
Want to know more about the report or any specific requirement?
WANT TO CUSTOMIZE THE REPORT?
Our Clients Speak
We asked them to research ‘ Equipment market’ all over the world, and their whole arrangement was helpful to us. thehealthanalytics.com insightful analysis and reports contributed to our current analysis and in creating a future strategy. Besides, the te
Yosuke Mitsui
Senior Associate Construction Equipment Sales & Marketing
We asked them to research ‘Equipment market’ all over the world, and their whole arrangement was helpful to us. thehealthanalytics.com insightful analysis and reports contributed to our current analysis and in creating a future strategy. Besides, the te


