

Base Year Value ()
x.x %
x.x %
CAGR ()
x.x %
x.x %
Forecast Year Value ()
x.x %
x.x %
Historical Data Period
Largest Region
Forecast Period
Mercado de plataformas de desarrollo de múltiples experiencias por componente (plataforma, servicios), tipo de implementación (local, nube), tamaño de la organización (pequeña empresa, mediana empresa, gran empresa), uso final (TI y telecomunicaciones, BFSI, comercio minorista, atención médica, fabricación, viajes y hotelería, medios y entretenimiento, sector público, otros) y por región Tendencias globales y pronóstico de 2023 a 2029
Instant access to hundreds of data points and trends
- Market estimates from 2014-2029
- Competitive analysis, industry segmentation, financial benchmarks
- Incorporates SWOT, Porter's Five Forces and risk management frameworks
- PDF report or online database with Word, Excel and PowerPoint export options
- 100% money back guarantee
Descripción general del mercado de plataformas de desarrollo de experiencias múltiples
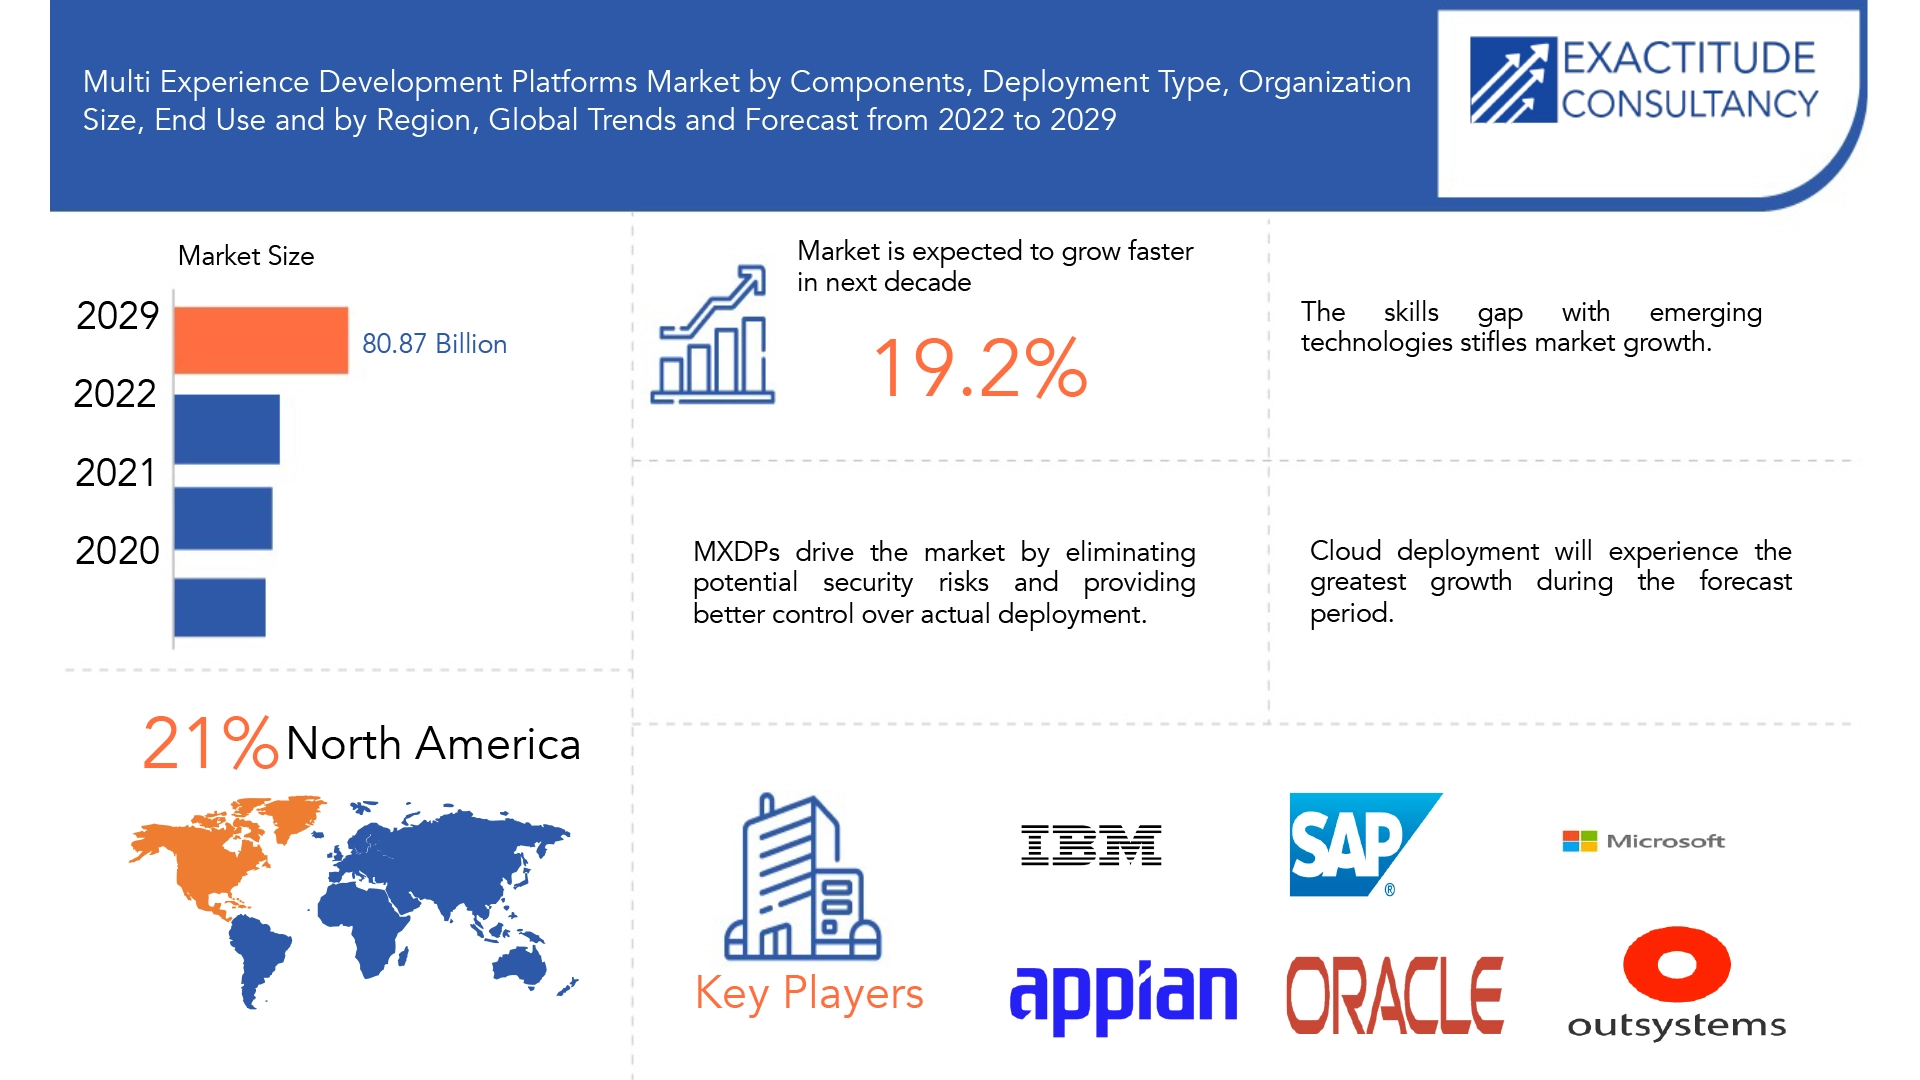
Se espera que el mercado global de plataformas de desarrollo de múltiples experiencias crezca a una tasa compuesta anual del 19,2 % entre 2022 y 2029, desde USD 7770 millones en 2020.
Las plataformas de desarrollo de experiencias múltiples son varias combinaciones de modalidades (como tacto, gestos y voz), dispositivos y aplicaciones con las que los usuarios pueden interactuar en su recorrido digital a través de varios puntos de contacto. MXDP implica el desarrollo de aplicaciones que se basan en varias modalidades específicas de puntos de contacto. En otras palabras, las MXDP son plataformas de desarrollo de aplicaciones que se utilizan para crear experiencias de chat, voz, realidad aumentada y wearables, así como aplicaciones móviles y web.
La adopción de MXDP tiene numerosas ventajas, en particular para el sector BFSI. Acelera el tiempo de comercialización de las aplicaciones móviles, es muy segura y le brinda más control sobre la implementación real. MXDP es una plataforma que permite el desarrollo rápido de aplicaciones web y móviles, así como funciones de llamadas de voz, realidad aumentada, chat y experiencias basadas en dispositivos portátiles. Se adhiere al modelo de crear una vez, implementar tantas veces como sea necesario y en todos los dispositivos, lo que facilita el aumento de las ventas y la provisión de excelentes experiencias al cliente. La tasa de adopción de low-code y MXDP para centrarse en facilitar los procesos operativos e impulsar el crecimiento del mercado aumenta día a día.
| ATRIBUTO | DETALLES |
| Periodo de estudio | 2020-2029 |
| Año base | 2021 |
| Año estimado | 2022 |
| Año pronosticado | 2022-2029 |
| Periodo histórico | 2018-2020 |
| Unidad | Valor (miles de millones de USD) |
| Segmentación | Por componente, por pantalla, por aplicación, por región. |
| Por componente |
|
| Por tipo de implementación |
|
| Por tamaño de la organización |
|
| Por uso final |
|
| Por región |
|
Un MXDP es un conjunto integrado y bien pensado de herramientas de desarrollo front-end y capacidades de "back-end para front-end" (BFF). Permite un enfoque de desarrollo distribuido y escalable (en términos de equipos y arquitectura) para crear aplicaciones diseñadas específicamente para distintos puntos de contacto digitales y modalidades de interacción.
Beneficios de las plataformas de desarrollo multiexperiencia:
Garantiza que la experiencia del usuario sea consistente en todos los puntos de contacto, incluidos los móviles, los inmersivos, los web y los conversacionales. Reduce la carga de trabajo asociada con el mantenimiento del sistema y del software. Es útil para el análisis de monitoreo de back-end, que rastrea detalles sobre eventos inesperados y otros datos. Esta plataforma permite a las empresas crear una única aplicación que pueda ejecutarse en varios dispositivos.
Las plataformas para el desarrollo de experiencias múltiples se construyen con una variedad de tecnologías:
Chatbots : los chatbots son un tipo de software que permite a las personas obtener información de las máquinas de manera natural o conversacional, a través de texto o voz. Las compañías automotrices, por ejemplo, usan chatbots como Kian de Kia para responder preguntas de los clientes y aumentar las tasas de conversión.
Realidad virtual (RV) : el término "realidad virtual" se refiere a un mundo visual creado por una computadora. Las personas pueden usar la realidad virtual para interactuar con objetos inanimados y realizar secuencias de actividades. En esta realidad, una persona puede interactuar con objetos y realizar una serie de acciones. Por ejemplo, Playstation VR es un casco de realidad virtual que permite a los usuarios asumir el papel de un personaje en un mundo de juego.
Realidad aumentada (RA) : los dispositivos de realidad aumentada (RA) aumentan la imagen del entorno del mundo real con datos generados por computadora. Qwake Technologies, por ejemplo, creó un casco de buceo antihumo para bomberos que les permite entrar y salir de situaciones peligrosas más rápido mientras mantienen una buena visión.
Dispositivos vestibles : los dispositivos vestibles son dispositivos tecnológicos inteligentes que se llevan sobre el cuerpo y que permiten a los usuarios interactuar con aplicaciones de teléfonos inteligentes. Entre ellos se incluyen los auriculares Bluetooth y los relojes inteligentes.
Los desafíos de MXDP incluyen la necesidad de que un equipo técnico modifique las herramientas de desarrollo y las prácticas de DevOps existentes para aprovechar al máximo un MXDP y desarrollar aplicaciones multiexperiencia con una inversión limitada. Debido a que la plataforma depende de múltiples puntos de contacto, existe el riesgo de quedar atrapado en un proveedor.
[título id="attachment_13810" align="aligncenter" width="1920"]
Frequently Asked Questions
• What is the worth of global Multi Experience Development Platforms market?
The Multi Experience Development Platforms market size had crossed USD 7.77 Billion in 2020 and will observe a CAGR of more than 19.2% up to 2029 driven by the increasing adoption of cloud deployment technology.
• What are the upcoming trends of Multi Experience Development Platforms market, globally?
The upcoming trend in Multi Experience Development Platforms market is an opportunity in enterprise applications is an opportunity for market growth.
• What is the CAGR of Multi Experience Development Platforms market?
The global Multi Experience Development Platforms market registered a CAGR of 19.2% from 2022 to 2029. The deployment type segment was the highest revenue contributor to the market.
• Which are the top companies to hold the market share in Multi Experience Development Platforms market?
Key players profiled in the report include IBM Corporation, Microsoft Corporation, and Oracle Corporation are the forerunners in the Multiexperience Development Platforms Market. Companies such as Siemens AG, Salesforce.com, Inc., Appian Corporation, SAP SE, ServiceNow, Inc., Progress Software Corporation, and Pegasystems, Inc.
• Which is the largest regional market for Multi Experience Development Platforms market?
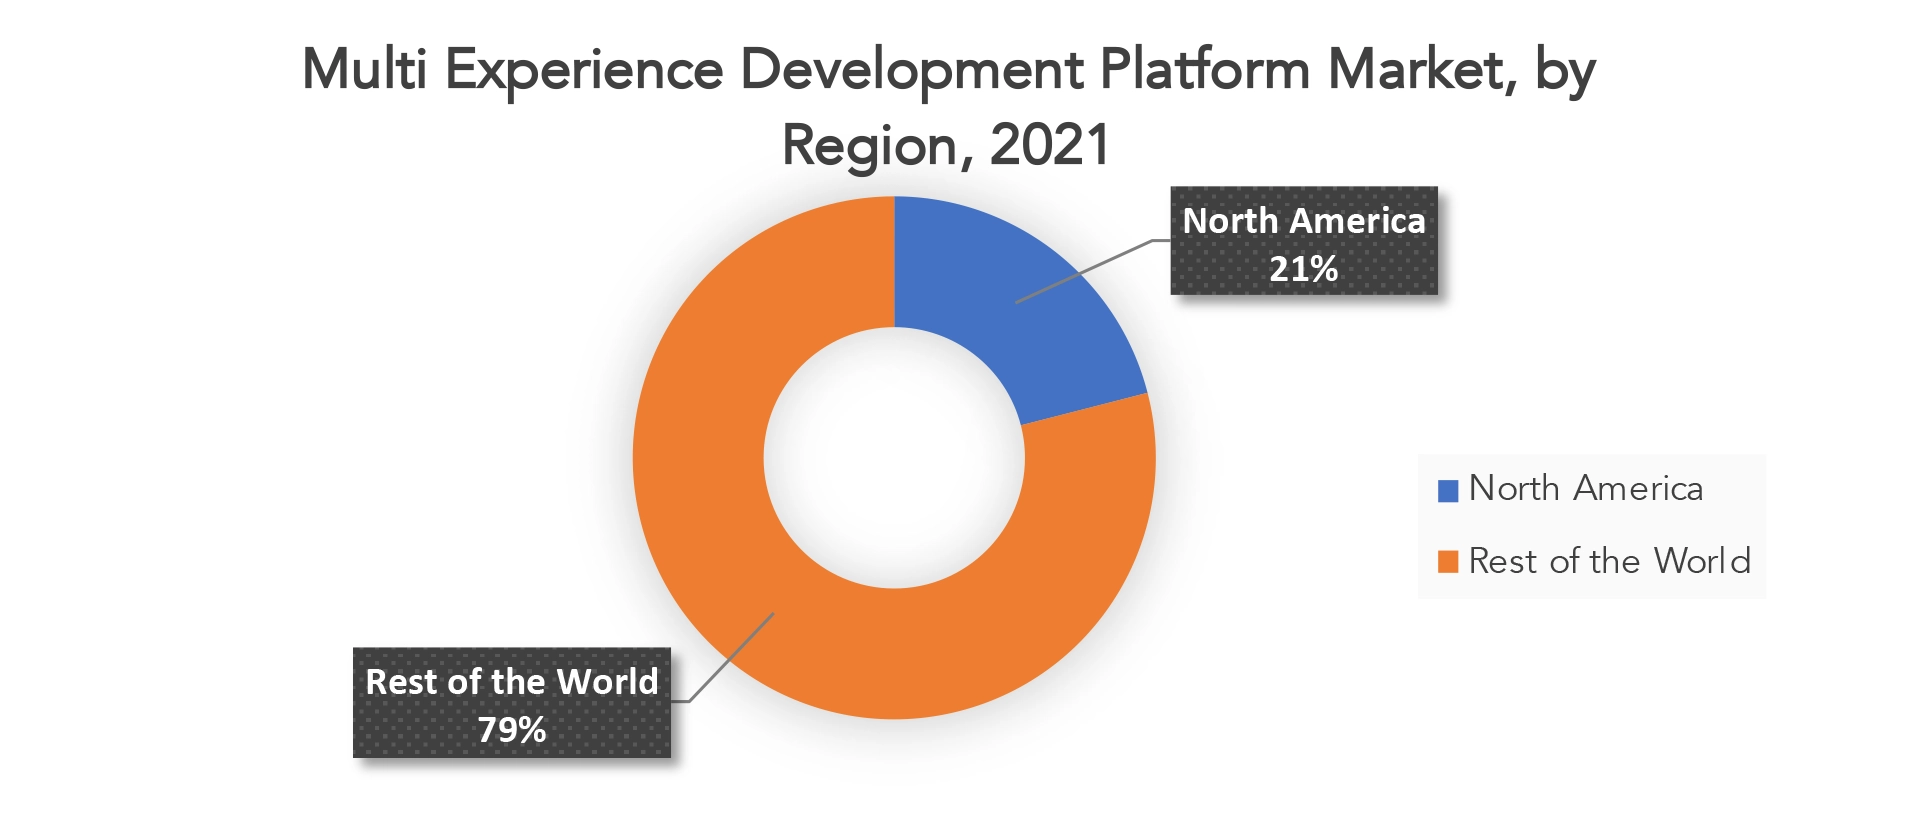
North America had the highest revenue share of almost 21% in 2021 and is expected to maintain this position throughout the projected period. The presence of significant firms like Oracle, Salesforce, Microsoft Corporation, IBM and Service Now contribute to the region's prominence.
Multi Experience Development Platforms Market Segment Analysis
The multi experience development platforms market is divided into two segments based on deployment type: on premise and cloud. The on premise sector had the highest revenue share in 2021, accounting for approximately 21% of the global MXDP market. The significant revenue share is largely due to large organizations’ investments in in-house platform implementation. Despite the popularity of the cloud deployment model, on premise deployment continues to meet the business needs of a wide range of enterprises. Furthermore, the increased need to protect sensitive data is fueling segment growth.
The cloud deployment segment is expected to grow at a 21% CAGR from 2020 to 2029. The growing popularity of cloud computing is likely to fuel segmental growth. Furthermore, the cloud deployment model's low investment cost, agility, and scalability are driving growth in the cloud segment. This is why both small and large businesses have embraced cloud computing.
The market is divided into platforms and services based on component. Platform components have the largest market share, accounting for more than 58%. Analytics, artificial intelligence, and machine learning are among the segments, as are web content management, product information management, digital asset management, and others. Organizations are increasingly using these platforms to develop, test, and deploy mobile, web, and wearable apps. Furthermore, increasing demand from various industries for multi-experience development platforms to develop apps with innovative technologies such as artificial intelligence and machine learning is expected to support segmental growth.
On the basis of component, the services segment is expected to grow the fastest in the market. Professional and managed services are included in this segment. The solution providers govern and control managed services throughout the solution's lifespan. The growing popularity of outsourcing services to solution providers to improve customer experiences and accelerate critical and transactional operations can be attributed to the growth of the services segment.
The market is divided into three categories based on organization size: small, medium, and large scale enterprises. Small and large enterprises are expected to grow the fastest, owing to increased adoption of MXDP by these sizes of businesses. The large scale enterprise segment currently holds the most market share.
End-use industries such as BFSI, IT and Telecom, retail, and healthcare, among others, are expected to drive overall market growth in both established and emerging economies. Multi-experience development platforms benefit organizations by promoting operational efficiencies and reducing app development time through the use of streamlined design processes and reusable code.
[caption id="attachment_13813" align="aligncenter" width="1920"]
Multi Experience Development Platforms Market Players
The major players operating in the global Multi Experience Development Platforms industry include IBM Corporation, Microsoft Corporation, and Oracle Corporation are the forerunners in the Multi experience Development Platforms Market. Companies such as Siemens AG, Salesforce.com, Inc., Appian Corporation, SAP SE, ServiceNow, Inc., Progress Software Corporation, and Pegasystems, Inc. The presence of established industry players and is characterised by mergers and acquisitions, joint ventures, capacity expansions, significant distribution, and branding decisions to improve market share and regional presence. They are also engaged in continuous R&D activities to develop new products and are focused on expanding the product portfolio. This is expected to increase competition and pose a threat to new market entrants.
Industry Developments: In August 2022, Outsystems announced that Sodexo Engage had deployed the OutSystems platform in 12 weeks to provide a robust and secure fully managed service to its public sector customers. The new platform not only tightly integrates with Sodexo Engage's systems, such as its CRM, payment gateways, and helpdesk, but it also directly links to the aggregators used to purchase vouchers. This contributes to process improvement, increasing efficiency and streamlining the entire process for customers and end users. In June 2021, Mendix executives coined the term ‘low-code operations’ or ‘low-codeOps’ to describe the ability of low-code development platforms to automate and reduce an enterprise's operational burden. Its overarching goal is to leverage low-proven code's ability to quickly launch digital solutions into the adjacent domains of IT maintenance and operations within large, hybrid environments.Who Should Buy? Or Key stakeholders
- Research and development
- Manufacturing
- End Use industries
- Poultry Farming
- Agriculture
- E-Commerce and Retail
- Healthcare
- Industrial and Manufacturing
Multi Experience Development Platforms Market Regional Analysis
Geographically, the Multi Experience Development Platforms market is segmented into North America, South America, Europe, APAC and MEA.
 Multi Experience Development Platforms market | Exactitude Consultancy[/caption]
- North America: includes the US, Canada, Mexico
- Europe: includes UK, Germany, France, Italy, Spain, Russia, and Rest of Europe
- Asia Pacific: includes China, Japan, South Korea, India, Australia, ASEAN and Rest of APAC
- South America: includes Brazil, Argentina and Rest of South America
- Middle East & Africa: includes Turkey, UAE, Saudi Arabia, South Africa, and Rest of MEA
Over the anticipated term, the North American region is expected to experience significant growth potential. The significant presence of well-known businesses in the area is a major element in the multi-experience development platforms (MXDP) market's explosive expansion in this area.
The greatest CAGR of 19.5% is anticipated for the Asia Pacific area between 2022 and 2029. Growth in the region is anticipated to be supported by expanding industry sectors like healthcare, IT and telecom, financial services, and others. Additionally, during the course of the projected period, the market's expansion will also be aided by the rising number of small and mid-size businesses in the regions.
[caption id="attachment_13814" align="aligncenter" width="1920"] Multi Experience Development Platforms market | Exactitude Consultancy[/caption] Key Market Segments: Multi Experience Development Platform Market
Multi Experience Development Platform Market By Component, 2020-2029, (Usd Billion)- Platform
- Web Content Management
- Digital Asset Management
- Product Information Management
- Analytics, Artificial Intelligence, And Machine Learning
- Others
- Services
- Professional Services
- Consulting
- Support And Maintenance
- Training
- Managed Services
- On-Premise
- Cloud
- Small Enterprise
- Medium Sized Enterprise
- Large Scale Enterprise
- It & Telecom
- Bfsi
- Retail
- Healthcare
- Manufacturing
- Travel & Hospitality
- Media & Entertainment
- Public Sector
- Others
- North America
- Europe
- Asia Pacific
- South America
- Middle East And Africa
Multi Experience Development Platforms Market Key Question Answered
- What is the current scenario of the global Multi Experience Development Platforms market?
- What are the emerging technologies for the development of Multi Experience Development Platforms devices?
- What are the historical size and the present size of the market segments and their future potential?
- What are the major catalysts for the market and their impact during the short, medium, and long terms?
- What are the evolving opportunities for the players in the market?
- Which are the key regions from the investment perspective?
- What are the key strategies being adopted by the major players to up their market shares?
- INTRODUCCIÓN
- DEFINICIÓN DE MERCADO
- SEGMENTACIÓN DEL MERCADO
- CRONOGRAMAS DE INVESTIGACIÓN
- SUPUESTOS Y LIMITACIONES
- METODOLOGÍA DE LA INVESTIGACIÓN
- MINERÍA DE DATOS
- INVESTIGACIÓN SECUNDARIA
- INVESTIGACIÓN PRIMARIA
- ASESORAMIENTO DE EXPERTOS EN LA MATERIA
- CONTROLES DE CALIDAD
- REVISIÓN FINAL
- TRIANGULACIÓN DE DATOS
- ENFOQUE DE ABAJO HACIA ARRIBA
- ENFOQUE DE ARRIBA HACIA ABAJO
- FLUJO DE INVESTIGACIÓN
- FUENTES DE DATOS
- MINERÍA DE DATOS
- RESUMEN EJECUTIVO
- PANORAMA DEL MERCADO
- PERSPECTIVA DEL MERCADO GLOBAL DE PLATAFORMAS DE DESARROLLO DE EXPERIENCIAS MÚLTIPLES
- IMPULSORES DEL MERCADO
- RESTRICCIONES DEL MERCADO
- OPORTUNIDADES DE MERCADO
- IMPACTO DEL COVID-19 EN EL MERCADO DE PLATAFORMAS DE DESARROLLO MULTIEXPERIENCIA
- MODELO DE LAS CINCO FUERZAS DE PORTER
- AMENAZA DE NUEVOS INGRESANTES
- AMENAZA DE SUSTITUTOS
- PODER DE NEGOCIACIÓN DE LOS PROVEEDORES
- PODER DE NEGOCIACIÓN DE LOS CLIENTES
- GRADO DE COMPETENCIA
- INDUSTRY VALUE CHAIN ANALYSIS
- PERSPECTIVA DEL MERCADO GLOBAL DE PLATAFORMAS DE DESARROLLO DE EXPERIENCIAS MÚLTIPLES
- GLOBAL MULTI EXPERIENCE DEVELOPMENT PLATFORMS MARKET BY DEPLOYMENT TYPE, 2020-2029, (USD BILLIONS)
- ON-PREMISE
- CLOUD
- GLOBAL MULTI EXPERIENCE DEVELOPMENT PLATFORMS MARKET BY COMPONENT, 2020-2029, (USD BILLION)
- PLATFORMS
- SERVICES
- GLOBAL MULTI EXPERIENCE DEVELOPMENT PLATFORMS MARKET BY ORGANIZATION SIZE, 2020-2029, (USD BILLIONS)
- SMALL ENTERPRISE
- MEDIUM SIZED ENTERPRISE
- LARGE SCALE ENTERPRISE
- GLOBAL MULTI EXPERIENCE DEVELOPMENT PLATFORMS MARKET BY END-USE, 2020-2029, (USD BILLIONS)
- FOOD AND BEVERAGES
- PERSONAL CARE
- HEALTHCARE
- LOGISTICS & SUPPLY CHAIN
- CONSUMER ELECTRONICS
- OTHERS
- GLOBAL MULTI EXPERIENCE DEVELOPMENT PLATFORMS MARKET BY REGION, 2020-2029, (USD BILLION)
- NORTH AMERICA
- US
- CANADA
- MEXICO
- SOUTH AMERICA
- BRAZIL
- ARGENTINA
- COLOMBIA
- REST OF SOUTH AMERICA
- EUROPE
- GERMANY
- UK
- FRANCE
- ITALY
- SPAIN
- RUSSIA
- REST OF EUROPE
- ASIA PACIFIC
- INDIA
- CHINA
- JAPAN
- SOUTH KOREA
- AUSTRALIA
- SOUTH-EAST ASIA
- REST OF ASIA PACIFIC
- MIDDLE EAST AND AFRICA
- UAE
- SAUDI ARABIA
- SOUTH AFRICA
- REST OF MIDDLE EAST AND AFRICA
- NORTH AMERICA
- COMPANY PROFILES*
(BUSINESS OVERVIEW, COMPANY SNAPSHOT, PRODUCTS OFFERED, RECENT DEVELOPMENTS)
10.1. APPIAN
10.2. GENEXUS
10.3. IBM
10.4. MENDIX
10.5. MICROSOFT CORPORATION
10.6. ORACLE
10.7. OUTSYSTEMS
10.8. PEGASYSTEMS
10.9. PROGRESS SOFTWARE CORPORATION
10.10. SALESFORCE *THE COMPANY LIST IS INDICATIVE
LIST OF TABLES
TABLE 1 GLOBAL MULTI EXPERIENCE DEVELOPMENT PLATFORMS MARKET BY DEPLOYMENT TYPE (USD BILLION) 2020-2029
TABLE 2 GLOBAL MULTI EXPERIENCE DEVELOPMENT PLATFORMS MARKET BY COMPONENT (USD BILLION) 2020-2029
TABLE 3 GLOBAL MULTI EXPERIENCE DEVELOPMENT PLATFORMS MARKET BY ORGANIZATION SIZE (USD BILLION) 2020-2029
TABLE 4 GLOBAL MULTI EXPERIENCE DEVELOPMENT PLATFORMS MARKET BY END USE (USD BILLION) 2020-2029
TABLE 5 GLOBAL MULTI EXPERIENCE DEVELOPMENT PLATFORMS MARKET BY REGION (USD BILLION) 2020-2029
TABLE 6 NORTH AMERICA MULTI EXPERIENCE DEVELOPMENT PLATFORMS MARKET BY DEPLOYMENT TYPE (USD BILLION) 2020-2029
TABLE 7 NORTH AMERICA MULTI EXPERIENCE DEVELOPMENT PLATFORMS MARKET BY COMPONENT (USD BILLION) 2020-2029
TABLE 8 NORTH AMERICA MULTI EXPERIENCE DEVELOPMENT PLATFORMS MARKET BY ORGANIZATION SIZE (USD BILLION) 2020-2029
TABLE 9 NORTH AMERICA MULTI EXPERIENCE DEVELOPMENT PLATFORMS MARKET BY END USE (USD BILLION) 2020-2029
TABLE 10 NORTH AMERICA MULTI EXPERIENCE DEVELOPMENT PLATFORMS MARKET BY COUNTRY (USD BILLION) 2020-2029
TABLE 11 US MULTI EXPERIENCE DEVELOPMENT PLATFORMS MARKET BY DEPLOYMENT TYPE (USD BILLION) 2020-2029
TABLE 12 US MULTI EXPERIENCE DEVELOPMENT PLATFORMS MARKET BY COMPONENT (USD BILLION) 2020-2029
TABLE 13 US MULTI EXPERIENCE DEVELOPMENT PLATFORMS MARKET BY ORGANIZATION SIZE (USD BILLION) 2020-2029
TABLE 14 US MULTI EXPERIENCE DEVELOPMENT PLATFORMS MARKET BY END USE (USD BILLION) 2020-2029
TABLE 15 CANADA MULTI EXPERIENCE DEVELOPMENT PLATFORMS MARKET BY DEPLOYMENT TYPE (USD BILLION) 2020-2029
TABLE 16 CANADA MULTI EXPERIENCE DEVELOPMENT PLATFORMS MARKET BY COMPONENT (USD BILLION) 2020-2029
TABLE 17 CANADA MULTI EXPERIENCE DEVELOPMENT PLATFORMS MARKET BY ORGANIZATION SIZE (USD BILLION) 2020-2029
TABLE 18 CANADA MULTI EXPERIENCE DEVELOPMENT PLATFORMS MARKET BY END USE (USD BILLION) 2020-2029
TABLE 19 MEXICO MULTI EXPERIENCE DEVELOPMENT PLATFORMS MARKET BY DEPLOYMENT TYPE (USD BILLION) 2020-2029
TABLE 20 MEXICO MULTI EXPERIENCE DEVELOPMENT PLATFORMS MARKET BY COMPONENT (USD BILLION) 2020-2029
TABLE 21 MEXICO MULTI EXPERIENCE DEVELOPMENT PLATFORMS MARKET BY ORGANIZATION SIZE (USD BILLION) 2020-2029
TABLE 22 MEXICO MULTI EXPERIENCE DEVELOPMENT PLATFORMS MARKET BY END USE (USD BILLION) 2020-2029
TABLE 23 SOUTH AMERICA MULTI EXPERIENCE DEVELOPMENT PLATFORMS MARKET BY DEPLOYMENT TYPE (USD BILLION) 2020-2029
TABLE 24 SOUTH AMERICA MULTI EXPERIENCE DEVELOPMENT PLATFORMS MARKET BY COMPONENT (USD BILLION) 2020-2029
TABLE 25 SOUTH AMERICA MULTI EXPERIENCE DEVELOPMENT PLATFORMS MARKET BY ORGANIZATION SIZE (USD BILLION) 2020-2029
TABLE 26 SOUTH AMERICA MULTI EXPERIENCE DEVELOPMENT PLATFORMS MARKET BY END USE (USD BILLION) 2020-2029
TABLE 27 SOUTH AMERICA MULTI EXPERIENCE DEVELOPMENT PLATFORMS MARKET BY COUNTRY (USD BILLION) 2020-2029
TABLE 28 BRAZIL MULTI EXPERIENCE DEVELOPMENT PLATFORMS MARKET BY DEPLOYMENT TYPE (USD BILLION) 2020-2029
TABLE 29 BRAZIL MULTI EXPERIENCE DEVELOPMENT PLATFORMS MARKET BY COMPONENT (USD BILLION) 2020-2029
TABLE 30 BRAZIL MULTI EXPERIENCE DEVELOPMENT PLATFORMS MARKET BY ORGANIZATION SIZE (USD BILLION) 2020-2029
TABLE 31 BRAZIL MULTI EXPERIENCE DEVELOPMENT PLATFORMS MARKET BY END USE (USD BILLION) 2020-2029
TABLE 32 ARGENTINA MULTI EXPERIENCE DEVELOPMENT PLATFORMS MARKET BY DEPLOYMENT TYPE (USD BILLION) 2020-2029
TABLE 33 ARGENTINA MULTI EXPERIENCE DEVELOPMENT PLATFORMS MARKET BY COMPONENT (USD BILLION) 2020-2029
TABLE 34 ARGENTINA MULTI EXPERIENCE DEVELOPMENT PLATFORMS MARKET BY ORGANIZATION SIZE (USD BILLION) 2020-2029
TABLE 35 ARGENTINA MULTI EXPERIENCE DEVELOPMENT PLATFORMS MARKET BY END USE (USD BILLION) 2020-2029
TABLE 36 COLUMBIA MULTI EXPERIENCE DEVELOPMENT PLATFORMS MARKET BY DEPLOYMENT TYPE (USD BILLION) 2020-2029
TABLE 37 COLUMBIA MULTI EXPERIENCE DEVELOPMENT PLATFORMS MARKET BY COMPONENT (USD BILLION) 2020-2029
TABLE 38 COLUMBIA MULTI EXPERIENCE DEVELOPMENT PLATFORMS MARKET BY ORGANIZATION SIZE (USD BILLION) 2020-2029
TABLE 39 COLUMBIA MULTI EXPERIENCE DEVELOPMENT PLATFORMS MARKET BY END USE (USD BILLION) 2020-2029
TABLE 40 REST OF SOUTH AMERICA MULTI EXPERIENCE DEVELOPMENT PLATFORMS MARKET BY DEPLOYMENT TYPE (USD BILLION) 2020-2029
TABLE 41 REST OF SOUTH AMERICA MULTI EXPERIENCE DEVELOPMENT PLATFORMS MARKET BY COMPONENT (USD BILLION) 2020-2029
TABLE 42 REST OF SOUTH AMERICA MULTI EXPERIENCE DEVELOPMENT PLATFORMS MARKET BY ORGANIZATION SIZE (USD BILLION) 2020-2029
TABLE 43 REST OF SOUTH AMERICA MULTI EXPERIENCE DEVELOPMENT PLATFORMS MARKET BY END USE (USD BILLION) 2020-2029
TABLE 44 ASIA PACIFIC MULTI EXPERIENCE DEVELOPMENT PLATFORMS MARKET BY DEPLOYMENT TYPE (USD BILLION) 2020-2029
TABLE 45 ASIA PACIFIC MULTI EXPERIENCE DEVELOPMENT PLATFORMS MARKET BY COMPONENT (USD BILLION) 2020-2029
TABLE 46 ASIA PACIFIC MULTI EXPERIENCE DEVELOPMENT PLATFORMS MARKET BY ORGANIZATION SIZE (USD BILLION) 2020-2029
TABLE 47 ASIA PACIFIC MULTI EXPERIENCE DEVELOPMENT PLATFORMS MARKET BY END USE (USD BILLION) 2020-2029
TABLE 48 ASIA PACIFIC MULTI EXPERIENCE DEVELOPMENT PLATFORMS MARKET BY COUNTRY (USD BILLION) 2020-2029
TABLE 49 INDIA MULTI EXPERIENCE DEVELOPMENT PLATFORMS MARKET BY DEPLOYMENT TYPE (USD BILLION) 2020-2029
TABLE 50 INDIA MULTI EXPERIENCE DEVELOPMENT PLATFORMS MARKET BY COMPONENT (USD BILLION) 2020-2029
TABLE 51 INDIA MULTI EXPERIENCE DEVELOPMENT PLATFORMS MARKET BY ORGANIZATION SIZE (USD BILLION) 2020-2029
TABLE 52 INDIA MULTI EXPERIENCE DEVELOPMENT PLATFORMS MARKET BY END USE (USD BILLION) 2020-2029
TABLE 53 CHINA MULTI EXPERIENCE DEVELOPMENT PLATFORMS MARKET BY DEPLOYMENT TYPE (USD BILLION) 2020-2029
TABLE 54 CHINA MULTI EXPERIENCE DEVELOPMENT PLATFORMS MARKET BY COMPONENT (USD BILLION) 2020-2029
TABLE 55 CHINA MULTI EXPERIENCE DEVELOPMENT PLATFORMS MARKET BY ORGANIZATION SIZE (USD BILLION) 2020-2029
TABLE 56 CHINA MULTI EXPERIENCE DEVELOPMENT PLATFORMS MARKET BY END USE (USD BILLION) 2020-2029
TABLE 57 JAPAN MULTI EXPERIENCE DEVELOPMENT PLATFORMS MARKET BY DEPLOYMENT TYPE (USD BILLION) 2020-2029
TABLE 58 JAPAN MULTI EXPERIENCE DEVELOPMENT PLATFORMS MARKET BY COMPONENT (USD BILLION) 2020-2029
TABLE 59 JAPAN MULTI EXPERIENCE DEVELOPMENT PLATFORMS MARKET BY ORGANIZATION SIZE (USD BILLION) 2020-2029
TABLE 60 JAPAN MULTI EXPERIENCE DEVELOPMENT PLATFORMS MARKET BY END USE (USD BILLION) 2020-2029
TABLE 61 SOUTH KOREA MULTI EXPERIENCE DEVELOPMENT PLATFORMS MARKET BY DEPLOYMENT TYPE (USD BILLION) 2020-2029
TABLE 62 SOUTH KOREA MULTI EXPERIENCE DEVELOPMENT PLATFORMS MARKET BY COMPONENT (USD BILLION) 2020-2029
TABLE 63 SOUTH KOREA MULTI EXPERIENCE DEVELOPMENT PLATFORMS MARKET BY ORGANIZATION SIZE (USD BILLION) 2020-2029
TABLE 64 SOUTH KOREA MULTI EXPERIENCE DEVELOPMENT PLATFORMS MARKET BY END USE (USD BILLION) 2020-2029
TABLE 65 AUSTRALIA MULTI EXPERIENCE DEVELOPMENT PLATFORMS MARKET BY DEPLOYMENT TYPE (USD BILLION) 2020-2029
TABLE 66 AUSTRALIA MULTI EXPERIENCE DEVELOPMENT PLATFORMS MARKET BY COMPONENT (USD BILLION) 2020-2029
TABLE 67 AUSTRALIA MULTI EXPERIENCE DEVELOPMENT PLATFORMS MARKET BY ORGANIZATION SIZE (USD BILLION) 2020-2029
TABLE 68 AUSTRALIA MULTI EXPERIENCE DEVELOPMENT PLATFORMS MARKET BY END USE (USD BILLION) 2020-2029
TABLE 69 SOUTH EAST ASIA MULTI EXPERIENCE DEVELOPMENT PLATFORMS MARKET BY DEPLOYMENT TYPE (USD BILLION) 2020-2029
TABLE 70 SOUTH EAST ASIA MULTI EXPERIENCE DEVELOPMENT PLATFORMS MARKET BY COMPONENT (USD BILLION) 2020-2029
TABLE 71 SOUTH EAST ASIA MULTI EXPERIENCE DEVELOPMENT PLATFORMS MARKET BY ORGANIZATION SIZE (USD BILLION) 2020-2029
TABLE 72 SOUTH EAST ASIA MULTI EXPERIENCE DEVELOPMENT PLATFORMS MARKET BY END USE (USD BILLION) 2020-2029
TABLE 73 REST OF ASIA PACIFIC MULTI EXPERIENCE DEVELOPMENT PLATFORMS MARKET BY DEPLOYMENT TYPE (USD BILLION) 2020-2029
TABLE 74 REST OF ASIA PACIFIC MULTI EXPERIENCE DEVELOPMENT PLATFORMS MARKET BY COMPONENT (USD BILLION) 2020-2029
TABLE 75 REST OF ASIA PACIFIC MULTI EXPERIENCE DEVELOPMENT PLATFORMS MARKET BY ORGANIZATION SIZE (USD BILLION) 2020-2029
TABLE 76 REST OF ASIA PACIFIC MULTI EXPERIENCE DEVELOPMENT PLATFORMS MARKET BY END USE (USD BILLION) 2020-2029
TABLE 77 EUROPE MULTI EXPERIENCE DEVELOPMENT PLATFORMS MARKET BY DEPLOYMENT TYPE (USD BILLION) 2020-2029
TABLE 78 EUROPE MULTI EXPERIENCE DEVELOPMENT PLATFORMS MARKET BY COMPONENT (USD BILLION) 2020-2029
TABLE 79 EUROPE MULTI EXPERIENCE DEVELOPMENT PLATFORMS MARKET BY ORGANIZATION SIZE (USD BILLION) 2020-2029
TABLE 80 EUROPE MULTI EXPERIENCE DEVELOPMENT PLATFORMS MARKET BY END USE (USD BILLION) 2020-2029
TABLE 81 EUROPE MULTI EXPERIENCE DEVELOPMENT PLATFORMS MARKET BY COUNTRY (USD BILLION) 2020-2029
TABLE 82 GERMANY MULTI EXPERIENCE DEVELOPMENT PLATFORMS MARKET BY DEPLOYMENT TYPE (USD BILLION) 2020-2029
TABLE 83 GERMANY MULTI EXPERIENCE DEVELOPMENT PLATFORMS MARKET BY COMPONENT (USD BILLION) 2020-2029
TABLE 84 GERMANY MULTI EXPERIENCE DEVELOPMENT PLATFORMS MARKET BY ORGANIZATION SIZE (USD BILLION) 2020-2029
TABLE 85 GERMANY MULTI EXPERIENCE DEVELOPMENT PLATFORMS MARKET BY END USE (USD BILLION) 2020-2029
TABLE 86 UK MULTI EXPERIENCE DEVELOPMENT PLATFORMS MARKET BY DEPLOYMENT TYPE (USD BILLION) 2020-2029
TABLE 87 UK MULTI EXPERIENCE DEVELOPMENT PLATFORMS MARKET BY COMPONENT (USD BILLION) 2020-2029
TABLE 88 UK MULTI EXPERIENCE DEVELOPMENT PLATFORMS MARKET BY ORGANIZATION SIZE (USD BILLION) 2020-2029
TABLE 89 UK MULTI EXPERIENCE DEVELOPMENT PLATFORMS MARKET BY END USE (USD BILLION) 2020-2029
TABLE 90 FRANCE MULTI EXPERIENCE DEVELOPMENT PLATFORMS MARKET BY DEPLOYMENT TYPE (USD BILLION) 2020-2029
TABLE 91 FRANCE MULTI EXPERIENCE DEVELOPMENT PLATFORMS MARKET BY COMPONENT (USD BILLION) 2020-2029
TABLE 92 FRANCE MULTI EXPERIENCE DEVELOPMENT PLATFORMS MARKET BY ORGANIZATION SIZE (USD BILLION) 2020-2029
TABLE 93 FRANCE MULTI EXPERIENCE DEVELOPMENT PLATFORMS MARKET BY END USE (USD BILLION) 2020-2029
TABLE 94 ITALY MULTI EXPERIENCE DEVELOPMENT PLATFORMS MARKET BY DEPLOYMENT TYPE (USD BILLION) 2020-2029
TABLE 95 ITALY MULTI EXPERIENCE DEVELOPMENT PLATFORMS MARKET BY COMPONENT (USD BILLION) 2020-2029
TABLE 96 ITALY MULTI EXPERIENCE DEVELOPMENT PLATFORMS MARKET BY ORGANIZATION SIZE (USD BILLION) 2020-2029
TABLE 97 ITALY MULTI EXPERIENCE DEVELOPMENT PLATFORMS MARKET BY END USE (USD BILLION) 2020-2029
TABLE 98 SPAIN MULTI EXPERIENCE DEVELOPMENT PLATFORMS MARKET BY DEPLOYMENT TYPE (USD BILLION) 2020-2029
TABLE 99 SPAIN MULTI EXPERIENCE DEVELOPMENT PLATFORMS MARKET BY COMPONENT (USD BILLION) 2020-2029
TABLE 100 SPAIN MULTI EXPERIENCE DEVELOPMENT PLATFORMS MARKET BY ORGANIZATION SIZE (USD BILLION) 2020-2029
TABLE 101 SPAIN MULTI EXPERIENCE DEVELOPMENT PLATFORMS MARKET BY END USE (USD BILLION) 2020-2029
TABLE 102 RUSSIA MULTI EXPERIENCE DEVELOPMENT PLATFORMS MARKET BY DEPLOYMENT TYPE (USD BILLION) 2020-2029
TABLE 103 RUSSIA MULTI EXPERIENCE DEVELOPMENT PLATFORMS MARKET BY COMPONENT (USD BILLION) 2020-2029
TABLE 104 RUSSIA MULTI EXPERIENCE DEVELOPMENT PLATFORMS MARKET BY ORGANIZATION SIZE (USD BILLION) 2020-2029
TABLE 105 RUSSIA MULTI EXPERIENCE DEVELOPMENT PLATFORMS MARKET BY END USE (USD BILLION) 2020-2029
TABLE 106 REST OF EUROPE MULTI EXPERIENCE DEVELOPMENT PLATFORMS MARKET BY DEPLOYMENT TYPE (USD BILLION) 2020-2029
TABLE 107 REST OF EUROPE MULTI EXPERIENCE DEVELOPMENT PLATFORMS MARKET BY COMPONENT (USD BILLION) 2020-2029
TABLE 108 REST OF EUROPE MULTI EXPERIENCE DEVELOPMENT PLATFORMS MARKET BY ORGANIZATION SIZE (USD BILLION) 2020-2029
TABLE 109 REST OF EUROPE MULTI EXPERIENCE DEVELOPMENT PLATFORMS MARKET BY END USE (USD BILLION) 2020-2029
TABLE 110 MIDDLE EAST & AFRICA MULTI EXPERIENCE DEVELOPMENT PLATFORMS MARKET BY DEPLOYMENT TYPE (USD BILLION) 2020-2029
TABLE 111 MIDDLE EAST & AFRICA MULTI EXPERIENCE DEVELOPMENT PLATFORMS MARKET BY COMPONENT (USD BILLION) 2020-2029
TABLE 112 MIDDLE EAST & AFRICA MULTI EXPERIENCE DEVELOPMENT PLATFORMS MARKET BY ORGANIZATION SIZE (USD BILLION) 2020-2029
TABLE 113 MIDDLE EAST & AFRICA MULTI EXPERIENCE DEVELOPMENT PLATFORMS MARKET BY END USE (USD BILLION) 2020-2029
TABLE 114 MIDDLE EAST & AFRICA MULTI EXPERIENCE DEVELOPMENT PLATFORMS MARKET BY COUNTRY (USD BILLION) 2020-2029
TABLE 115 UAE MULTI EXPERIENCE DEVELOPMENT PLATFORMS MARKET BY DEPLOYMENT TYPE (USD BILLION) 2020-2029
TABLE 116 UAE MULTI EXPERIENCE DEVELOPMENT PLATFORMS MARKET BY COMPONENT (USD BILLION) 2020-2029
TABLE 117 UAE MULTI EXPERIENCE DEVELOPMENT PLATFORMS MARKET BY ORGANIZATION SIZE (USD BILLION) 2020-2029
TABLE 118 UAE MULTI EXPERIENCE DEVELOPMENT PLATFORMS MARKET BY END USE (USD BILLION) 2020-2029
TABLE 119 SAUDI ARABIA MULTI EXPERIENCE DEVELOPMENT PLATFORMS MARKET BY DEPLOYMENT TYPE (USD BILLION) 2020-2029
TABLE 120 SAUDI ARABIA MULTI EXPERIENCE DEVELOPMENT PLATFORMS MARKET BY COMPONENT (USD BILLION) 2020-2029
TABLE 121 SAUDI ARABIA MULTI EXPERIENCE DEVELOPMENT PLATFORMS MARKET BY ORGANIZATION SIZE (USD BILLION) 2020-2029
TABLE 122 SAUDI ARABIA MULTI EXPERIENCE DEVELOPMENT PLATFORMS MARKET BY END USE (USD BILLION) 2020-2029
TABLE 123 SOUTH AFRICA MULTI EXPERIENCE DEVELOPMENT PLATFORMS MARKET BY DEPLOYMENT TYPE (USD BILLION) 2020-2029
TABLE 124 SOUTH AFRICA MULTI EXPERIENCE DEVELOPMENT PLATFORMS MARKET BY COMPONENT (USD BILLION) 2020-2029
TABLE 125 SOUTH AFRICA MULTI EXPERIENCE DEVELOPMENT PLATFORMS MARKET BY ORGANIZATION SIZE (USD BILLION) 2020-2029
TABLE 126 SOUTH AFRICA MULTI EXPERIENCE DEVELOPMENT PLATFORMS MARKET BY END USE (USD BILLION) 2020-2029
TABLE 127 REST OF MIDDLE EAST & AFRICA MULTI EXPERIENCE DEVELOPMENT PLATFORMS MARKET BY DEPLOYMENT TYPE (USD BILLION) 2020-2029
TABLE 128 REST OF MIDDLE EAST & AFRICA MULTI EXPERIENCE DEVELOPMENT PLATFORMS MARKET BY COMPONENT (USD BILLION) 2020-2029
TABLE 129 REST OF MIDDLE EAST & AFRICA MULTI EXPERIENCE DEVELOPMENT PLATFORMS MARKET BY ORGANIZATION SIZE (USD BILLION) 2020-2029
TABLE 130 REST OF MIDDLE EAST & AFRICA MULTI EXPERIENCE DEVELOPMENT PLATFORMS MARKET BY END USE (USD BILLION) 2020-2029
LIST OF FIGURES
FIGURE 1 MARKET DYNAMICS
FIGURE 2 MARKET SEGMENTATION
FIGURE 3 REPORT TIMELINES: YEARS CONSIDERED
FIGURE 4 DATA TRIANGULATION
FIGURE 5 BOTTOM-UP APPROACH
FIGURE 6 TOP-DOWN APPROACH
FIGURE 7 RESEARCH FLOW
FIGURE 8 GLOBAL MULTI EXPERIENCE DEVELOPMENT PLATFORMS MARKET BY DEPLOYMENT TYPE, USD BILLION, 2020-2029
FIGURE 9 GLOBAL MULTI EXPERIENCE DEVELOPMENT PLATFORMS MARKET BY COMPONENT, USD BILLION, 2020-2029
FIGURE 10 GLOBAL MULTI EXPERIENCE DEVELOPMENT PLATFORMS MARKET BY ORGANIZATION SIZE, USD BILLION, 2020-2029
FIGURE 12 GLOBAL MULTI EXPERIENCE DEVELOPMENT PLATFORMS MARKET BY END-USE, USD BILLION, 2020-2029
FIGURE 13 GLOBAL MULTI EXPERIENCE DEVELOPMENT PLATFORMS MARKET BY REGION, USD BILLION, 2020-2029
FIGURE 14 PORTER’S FIVE FORCES MODEL
FIGURE 15 GLOBAL MULTI EXPERIENCE DEVELOPMENT PLATFORMS MARKET BY DEPLOYMENT TYPE (USD BILLION), 2021
FIGURE 16 GLOBAL MULTI EXPERIENCE DEVELOPMENT PLATFORMS MARKET BY COMPONENT (USD BILLION), 2021
FIGURE 17 GLOBAL MULTI EXPERIENCE DEVELOPMENT PLATFORMS MARKET BY ORGANIZATION SIZE (USD BILLION), 2021
FIGURE 18 GLOBAL MULTI EXPERIENCE DEVELOPMENT PLATFORMS MARKET BY END-USE (USD BILLION), 2021
FIGURE 19 NORTH AMERICA MULTI EXPERIENCE DEVELOPMENT PLATFORMS MARKET SNAPSHOT
FIGURE 20 EUROPE MULTI EXPERIENCE DEVELOPMENT PLATFORMS MARKET SNAPSHOT
FIGURE 21 SOUTH AMERICA MULTI EXPERIENCE DEVELOPMENT PLATFORMS MARKET SNAPSHOT
FIGURE 22 ASIA PACIFIC MULTI EXPERIENCE DEVELOPMENT PLATFORMS MARKET SNAPSHOT
FIGURE 23 MIDDLE EAST ASIA AND AFRICA MULTI EXPERIENCE DEVELOPMENT PLATFORMS MARKET SNAPSHOT
FIGURE 24 MARKET SHARE ANALYSIS
FIGURE 25 APPIAN: COMPANY SNAPSHOT
FIGURE 26 GENEXUS: COMPANY SNAPSHOT
FIGURE 27 IBM: COMPANY SNAPSHOT
FIGURE 28 MENDIX: COMPANY SNAPSHOT
FIGURE 29 MICROSOFT CORPORATION: COMPANY SNAPSHOT
FIGURE 30 ORACLE: COMPANY SNAPSHOT
FIGURE 31 OUTSYSTEMS: COMPANY SNAPSHOT
FIGURE 32 PEGASYSTEMS: COMPANY SNAPSHOT
FIGURE 33 PROGRESS SOFTWARE CORPORATION: COMPANY SNAPSHOT
FIGURE 34 SALESFORCE: COMPANY SNAPSHOT
FIGURE 35 SAP SE: COMPANY SNAPSHOT
DOWNLOAD FREE SAMPLE REPORT
License Type
SPEAK WITH OUR ANALYST
Want to know more about the report or any specific requirement?
WANT TO CUSTOMIZE THE REPORT?
Our Clients Speak
We asked them to research ‘ Equipment market’ all over the world, and their whole arrangement was helpful to us. thehealthanalytics.com insightful analysis and reports contributed to our current analysis and in creating a future strategy. Besides, the te
Yosuke Mitsui
Senior Associate Construction Equipment Sales & Marketing
We asked them to research ‘Equipment market’ all over the world, and their whole arrangement was helpful to us. thehealthanalytics.com insightful analysis and reports contributed to our current analysis and in creating a future strategy. Besides, the te


