

Base Year Value ()
x.x %
x.x %
CAGR ()
x.x %
x.x %
Forecast Year Value ()
x.x %
x.x %
Historical Data Period
Largest Region
Forecast Period
Mercado de citometría de flujo por componente (instrumentos, reactivos y consumibles, software y servicio), por tecnología (basada en células y en microesferas), por aplicación (aplicaciones académicas y clínicas y aplicaciones de diagnóstico), por usuario final (hospitales, facultades de medicina y laboratorios de pruebas clínicas, organizaciones comerciales, instituciones académicas, otros) y región, tendencias globales y pronóstico de 2023 a 2029
Instant access to hundreds of data points and trends
- Market estimates from 2014-2029
- Competitive analysis, industry segmentation, financial benchmarks
- Incorporates SWOT, Porter's Five Forces and risk management frameworks
- PDF report or online database with Word, Excel and PowerPoint export options
- 100% money back guarantee
Descripción general del mercado de citometría de flujo
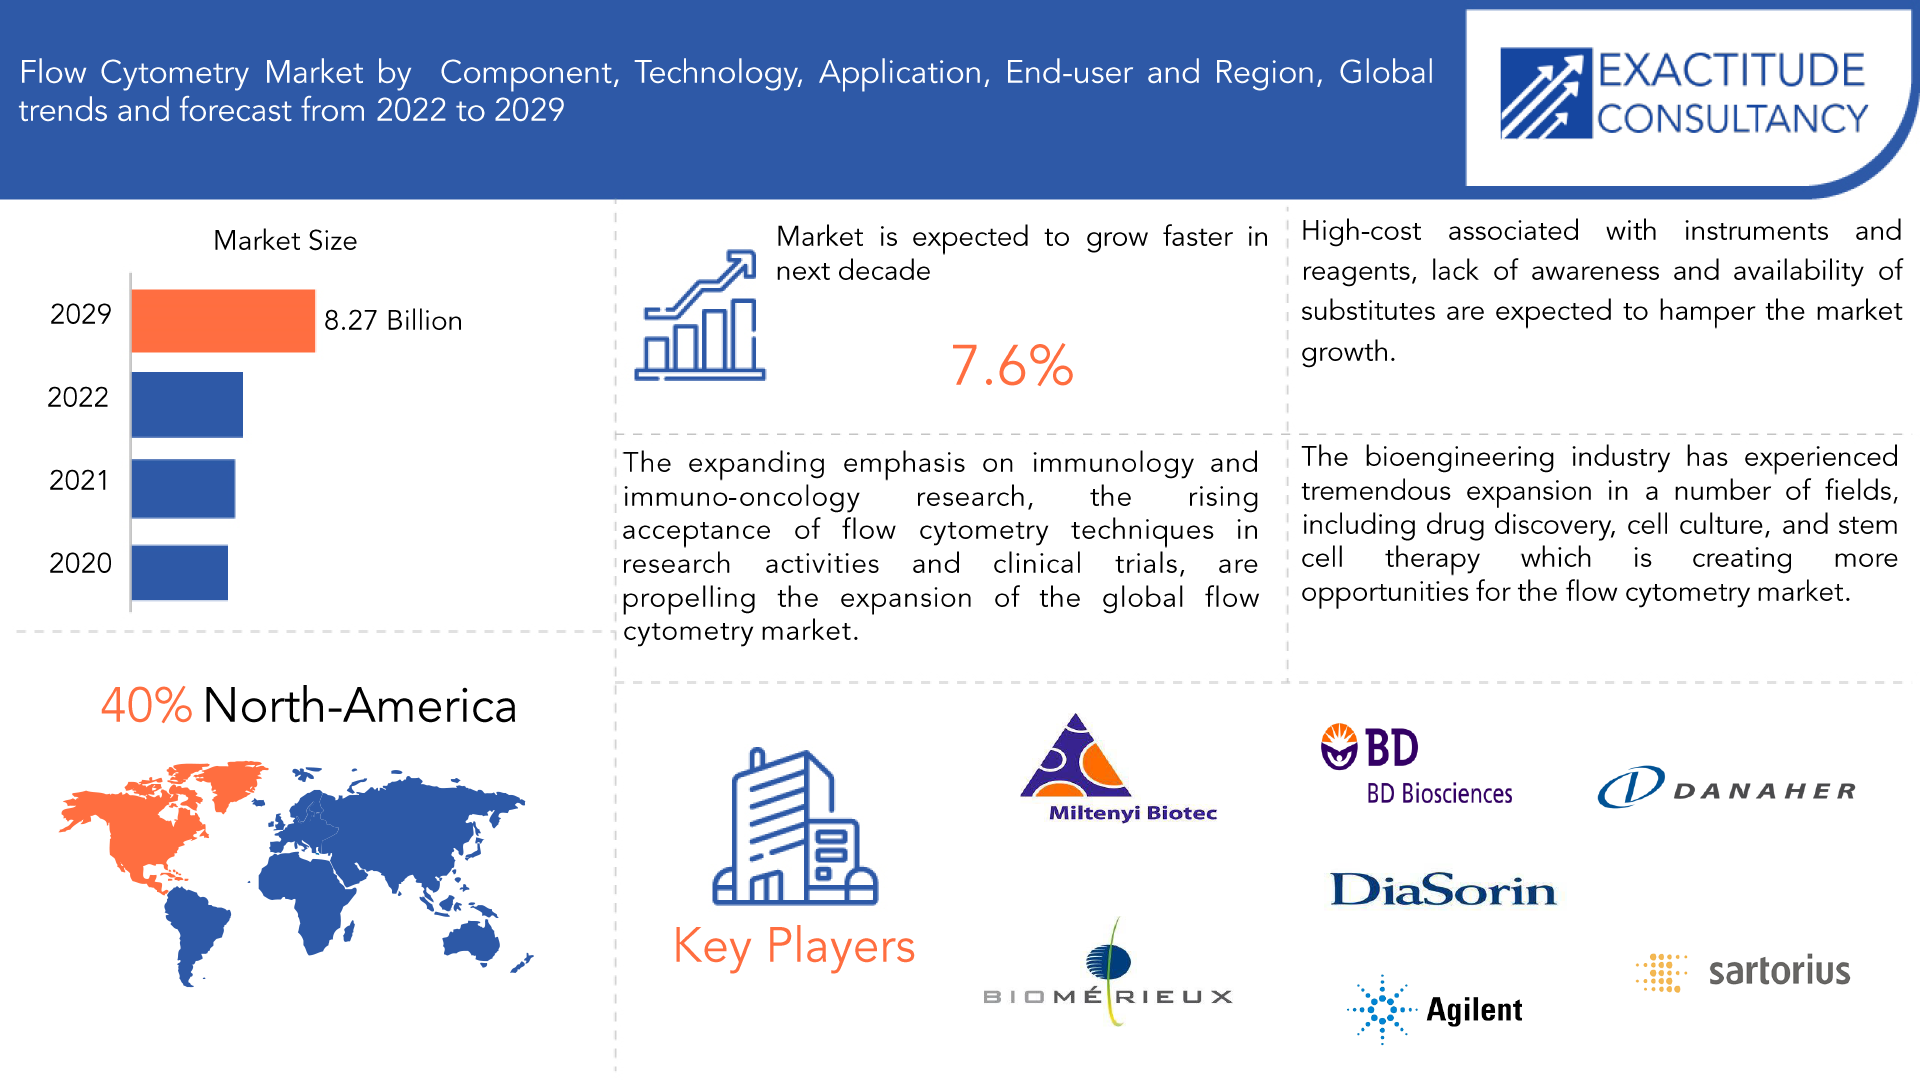
Se espera que el mercado de citometría de flujo crezca a una tasa anual compuesta del 7,6 % entre 2022 y 2029. Se espera que alcance más de 8270 millones de USD en 2029 desde 4280 millones de USD en 2020.
La citometría de flujo es un método ampliamente utilizado para analizar la expresión de moléculas intracelulares y de la superficie celular, caracterizar y definir diferentes tipos de células en una población celular heterogénea, evaluar la pureza de subpoblaciones aisladas y analizar el tamaño y el volumen de las células. Permite el análisis simultáneo de múltiples parámetros de células individuales. Se utiliza principalmente para evaluar la cantidad de fluorescencia producida por anticuerpos marcados con fluorescencia que se utilizan para detectar proteínas o ligandos que se unen a compuestos particulares que se encuentran en las células, como el ADN cuando está presente el yoduro de propidio. El proceso de tinción consiste en preparar una suspensión de células individuales a partir de materiales de cultivo de tejidos o células. Luego, las células se tratan con anticuerpos no marcados o marcados con fluorescencia en tubos o placas de microtitulación antes de evaluarlas en un citómetro de flujo.
| ATRIBUTO | DETALLES |
| Periodo de estudio | 2020-2029 |
| Año base | 2022 |
| Año estimado | 2022 |
| Año pronosticado | 2022-2029 |
| Periodo histórico | 2018-2020 |
| Unidad | Valor (USD MIL MILLONES) |
| Segmentación | Por componente, por tecnología, por función, por usuario final, por región |
| Por componente |
|
| Por tecnología |
|
| Por aplicación |
|
| Por el usuario final |
|
| Por región |
|
La alta demanda de instrumentos de citometría de flujo también es resultado del aumento de los gastos de I+D en biotecnología , ciencias biológicas y actividades de investigación biofarmacéutica. El desarrollo de la citometría de flujo microfluídica para pruebas en el punto de atención (POC) es un ejemplo de los instrumentos analíticos nuevos y mejorados que se están introduciendo gracias a las mejoras tecnológicas en la técnica.
Flow cytometry, an analytical tool used in the measurement and analysis of physical characteristics of cells or particles, has emerged as a key tool for safety and exploratory purposes during the drug discovery and development processes. Its emergence as a crucial tool is largely due to technology's capacity to quickly examine a huge number of particles and produce statistically reliable information on the cell population. The main drivers of the market expansion are the expanding use of flow cytometry in clinical research and the growing usage of the technique in stem cell research. Additionally, its multi-parametric methodology is aiding flow cytometry's adoption in the processes of drug discovery and development.
The expanding emphasis on immunology and immuno-oncology research, the rising acceptance of flow cytometry techniques in research activities and clinical trials, and the expanding technical advancements are propelling the expansion of the global flow cytometry market. As the HIV population increases globally, there is an increasing need for diagnostic tools like flow cytometry.
The bioengineering industry has experienced tremendous expansion thanks to its applications in a number of fields, including drug discovery, cell culture, and stem cell therapy which is creating more opportunities for the flow cytometry market. The market is also predicted to grow due to the increase in the prevalence of infectious diseases and the growing demand for quick and precise cancer prognostic tools. In general, it is projected that expanding applications in the life science sector will fuel greater demand. The rise in healthcare organizations that support the adoption of high-quality treatments and medical procedures is more likely to be the root of the market's expansion.
Additionally, changing the flow cytometry region to minimize conflicts with several different antibodies within a flow cytometry panel has been increasingly popular in recent years. Recombinant antibodies have reduced the cost of flow cytometry by lowering the high background that frequently occurs when antibodies attach to Fc receptors. As a result, the development of recombinant DNA technology for antibody manufacturing in flow cytometry has opened up a variety of new commercial potential.
La disponibilidad de sustitutos superiores y más asequibles plantea un obstáculo sustancial al mercado de la citometría de flujo. Estos sustitutos incluyen ELISA y radioinmunoensayo. ELISA y radioinmunoensayo son menos costosos y más fáciles de usar que la citometría de flujo, a pesar del hecho de que los tres métodos (citometría de flujo, ELISA y radioinmunoensayo) ayudan a diagnosticar el VIH al localizar "células problemáticas" en medio de una población de células. Se prevé que habrá un aumento en la prevalencia de enfermedades crónicas como el cáncer y el VIH, lo que aumentará el uso de la citometría de flujo en aplicaciones de diagnóstico. Por otro lado, se prevé que el desarrollo del mercado de la citometría de flujo se vea obstaculizado por problemas como el alto costo de los equipos y reactivos, la falta de concienciación entre los posibles usuarios finales y la falta de competencia técnica.
La pandemia de COVID-19 tuvo un efecto positivo en las perspectivas del negocio de la citometría de flujo durante la epidemia inicial de COVID-19. La creciente aplicación de reactivos en la investigación y los ensayos clínicos ha impulsado la cuota de mercado de los reactivos de citometría de flujo y, por tanto, el uso de la tecnología de citometría de flujo. Por ejemplo, en marzo de 2020, Cytek Biosciences Inc. brindó apoyo a médicos e investigadores de todo el mundo que estaban examinando los efectos del virus COVID-19 en los sistemas inmunológicos humanos. El uso de técnicas basadas en citometría de flujo para el diagnóstico y la vigilancia de la enfermedad de COVID-19 ha ayudado a la expansión de la industria. Además, la pandemia ha impulsado la innovación en el espacio de la citometría de flujo, como lo demuestra la introducción de nuevos productos en este campo.
[título id="attachment_14453" align="aligncenter" width="1024"]
Frequently Asked Questions
• What is the expected CAGR in terms of revenue for the global Flow cytometry market over the forecast period (2022–2029)?
The global Flow cytometry market revenue is projected to expand at a CAGR of 7.6% during the forecast period.
• What was the global Flow cytometry market valued at in 2020?
The global Flow cytometry market was valued at USD 4.28 Billion in 2020.
• Who are the key players in the flow cytometry market?
Some key players operating in the flow cytometry market include Agilent Technologies Inc., Becton Dickinson and Company, bioMérieux SA, Bio-Rad Laboratories Inc., Danaher Corporation, DiaSorin S.p.A., Miltenyi Biotec Inc., Sartorius AG, Sysmex Corporation, Thermo Fisher Scientific Inc.
• What are the factors driving the flow cytometry market?
Key factors driving the flow cytometry market growth include the rising R&D investments in the biotechnology sector and technological advancements in the field of flow cytometry for introducing new and improved analytical tools, such as microfluidic flow cytometry, for point-of-care testing.
• Which region will lead the global flow cytometry market?
North America region will lead the global flow cytometry market during the forecast period 2022 to 2029.
Flow Cytometry Market Segment Analysis
The flow cytometry market is segmented based on component, technology, application, end-user and region, global trends and forecast.
By component the market is bifurcated into instruments, Reagents and Consumables, Software, and Service; by Technology the market is bifurcated into Cell based and Bead based; by Application the market is bifurcated into Academic & Clinical applications and Diagnostic application; by End-user the market is bifurcated into Hospitals, Medical schools and clinical testing labs, Commercial organizations, Academic institutions, Others and Region.
Due to the development of novel instrument designs, the necessity for highly effective replacement components, applications in the treatment of emerging diseases, and an increase in research and advancements in flow cytometry techniques, the instruments segment held the largest market share in 2021. Reagents and consumables are crucial for flow cytometry analysis; hence they are predicted to overtake all other segments. Due to the combination of imaging capabilities and reagent consumption for enhancing the instrument performance and making it more affordable for emerging economies, the market share for flow cytometry reagents is anticipated to increase.
In 2021, the technology segment was led by the cell-based flow cytometry, which brought in more than 77.25% of the total revenue. Its dominance is influenced by rising demand for early diagnosis and growing understanding of the advantages of cell-based assays. The adoption is also anticipated to be fueled in the future by technological developments in cell-based assays, such as innovation in software, instruments, algorithms, affinity reagents, and labels. Bead-based flow cytometry is used to measure intracellular soluble proteins such as growth factors, cytokines, chemokines, and phosphorylated cell signaling proteins. The high-throughput flow cytometry technique is thought to be the best tool for performing multiplex bead-based assays. During the forecast period, the bead-based assay segment is expected to grow at a significant CAGR of more than.
Academic & clinical applications segment accounted for a significant share of the market share in the flow cytometry market in 2021, owing to an increase in research of academic & clinical applications of flow cytometry. However, due to the increased use of technology in diagnostic applications, the diagnostic applications segment is expected to grow at a rapid pace. In 2021, the academic institutes segment had a higher revenue share than other segments in terms of end-users. In cell biology and molecular diagnostic studies, the technique is used to measure cell parameters such as physical properties of cells, recognition of biomarkers via specific antibodies, cell type, cell lineage, and maturation stage. This technology can be used in a variety of educational settings, including molecular biology, immunology, pathology, plant biology, and marine biology. With increased R&D activities, the segment is expected to grow significantly during the forecast period. [caption id="attachment_14454" align="aligncenter" width="1920"]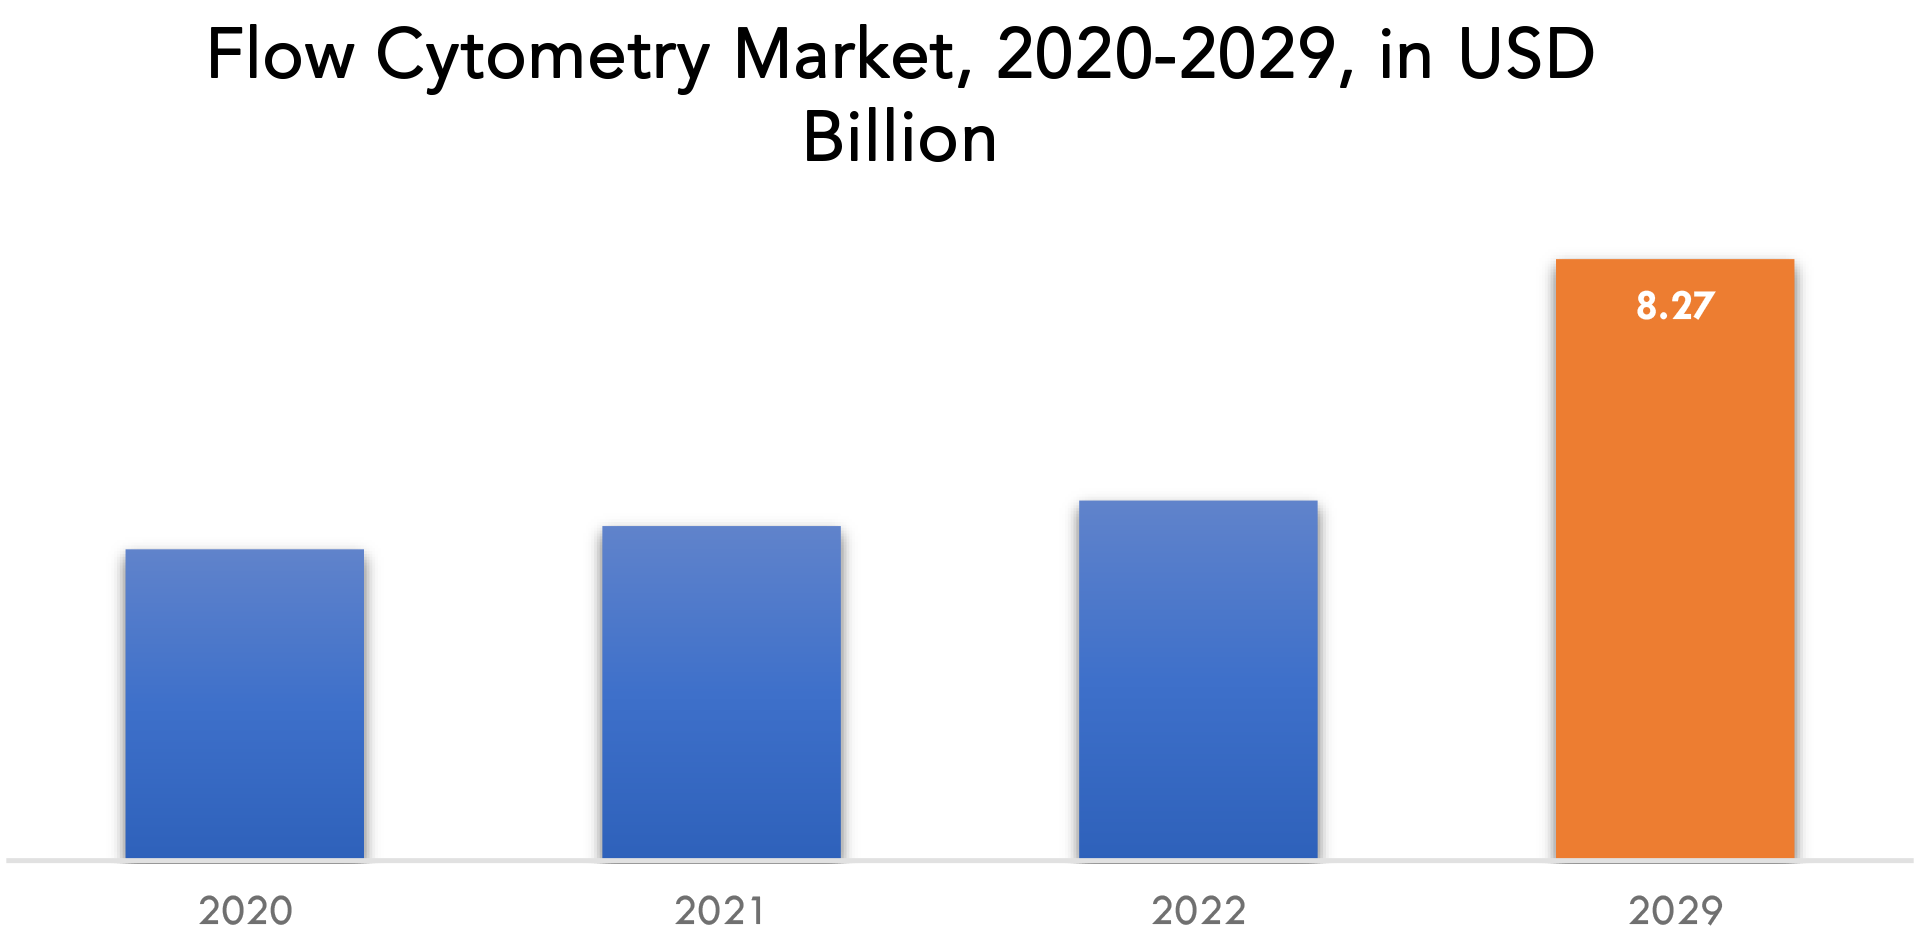
Flow Cytometry Market Key Players
The flow cytometry market key players include Agilent Technologies Inc., Becton Dickinson and Company, bioMérieux SA, Bio-Rad Laboratories Inc., Danaher Corporation, DiaSorin S.p.A., Miltenyi Biotec Inc., Sartorius AG, Sysmex Corporation, Thermo Fisher Scientific Inc., and others. 11 January 2023: BD (Becton, Dickinson and Company), a leading global medical technology company, introduced a new, robotic track system for the BD Kiestra microbiology laboratory solution that automates lab specimen processing, which may help to reduce manual labor and wait time for results.
24 January 2023: As part of a global, multiyear agreement, Thermo Fisher Scientific today announced it is working with AstraZeneca to develop a solid tissue and blood-based companion diagnostic (CDx) test for Tagrisso (osimertinib).Who Should Buy? Or Key Stakeholders
- Medical Technology Companies
- Scientific Research & Development
- Medical Devices Manufacturers
- End-users
- Regulatory Authorities
- Others
Flow Cytometry Market Regional Analysis
The flow cytometry market by region includes North America, Asia-Pacific (APAC), Europe, South America, and Middle East & Africa (MEA).
- North America: includes the US, Canada, Mexico
- Asia Pacific: includes China, Japan, South Korea, India, Australia, and Rest of APAC
- Europe: includes UK, Germany, France, Italy, Spain, Russia, and Rest of Europe
- South America: includes Brazil, Argentina, and Rest of South America
- Middle East & Africa: includes UAE, South Africa, Saudi Arabia and Rest of MEA
The flow cytometry market is dominated by North America, which also generates the highest revenue. Throughout the length of the forecast, this region is expected to dominate this market. This result is attributable to the U.S.'s substantial investment in healthcare, highly developed healthcare infrastructure, and widespread usage of flow cytometry technology. Additionally, there is a considerable need for flow cytometry equipment for research needs due to the highly expected research activities by pharmaceutical corporations and research colleges.
The second-largest flow cytometry market is anticipated to be in Europe. Government funding and support for R&D initiatives, increased public knowledge of healthcare diagnostics, and an increase in the number of cancer patients in the area are all factors contributing to the market growth in this region. Additionally, the pharmaceutical business is expanding its research and development efforts, which is boosting the market in this area.
Due to the rising prevalence of autoimmune diseases, rising healthcare awareness, rising investments and collaborative activities in the healthcare sector, as well as expansions by market players in the region, Asia-Pacific is anticipated to experience the fastest growth in the flow cytometry market during the forecast period.
[caption id="attachment_14455" align="aligncenter" width="1920"]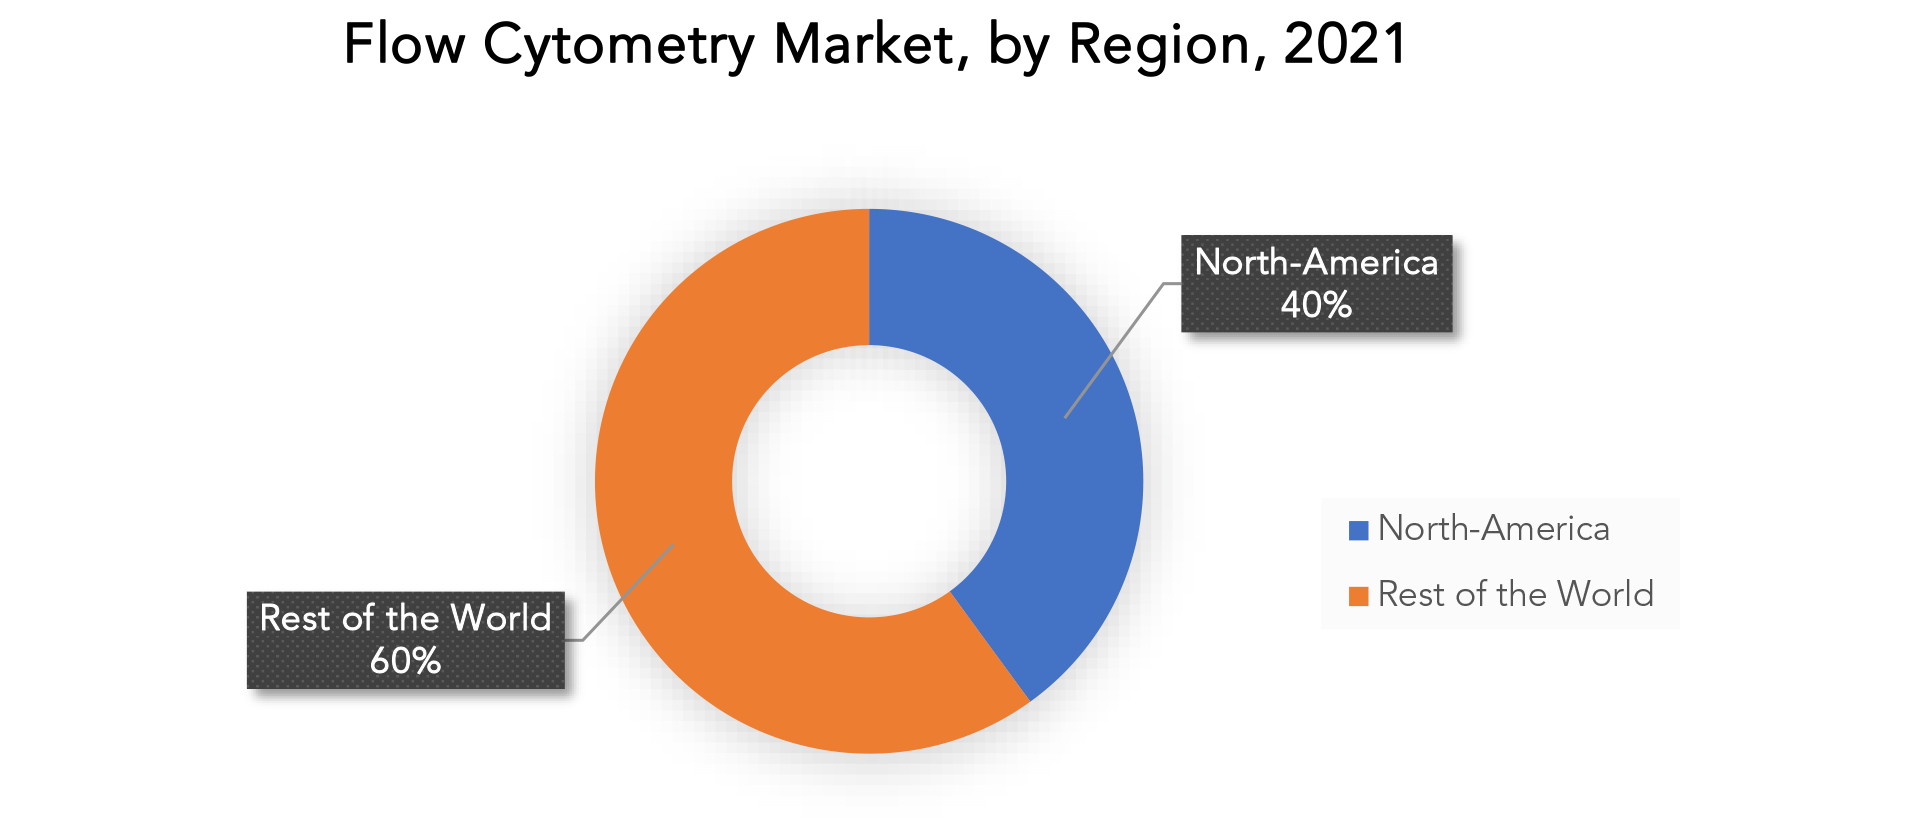
Key Market Segments: Flow cytometry market
Flow Cytometry Market By Component, 2020-2029, (USD Billion)- Instruments
- Reagents And Consumables
- Software
- Service
- Cell Based
- Bead Based
- Academic & Clinical Applications
- Diagnostic Application
- Hospitals
- Medical Schools And Clinical Testing Labs
- Commercial Organizations
- Academic Institutions
- Others
- North America
- Asia Pacific
- Europe
- South America
- Middle East And Africa
Exactitude Consultancy Services Key Objectives:
- Increasing sales and market share
- Developing new technology
- Improving profitability
- Entering new markets
- Enhancing brand reputation
Key Question Answered
- What is the expected growth rate of the Flow cytometry market over the next 7 years?
- Who are the major players in the Flow cytometry market and what is their market share?
- What are the opportunities for growth in emerging markets such as Asia-Pacific, Middle East, and Africa?
- How is the economic environment affecting the Flow cytometry market, including factors such as interest rates, inflation, and exchange rates?
- What is the expected impact of government policies and regulations on the Flow cytometry market?
- What is the current and forecasted size and growth rate of the global Flow cytometry market?
- What are the key drivers of growth in the Flow cytometry market?
- Who are the major players in the market and what is their market share?
- What are the distribution channels and supply chain dynamics in the Flow cytometry market?
- What are the technological advancements and innovations in the Flow cytometry market and their impact on product development and growth?
- What are the regulatory considerations and their impact on the market?
- What are the challenges faced by players in the Flow cytometry market and how are they addressing these challenges?
- What are the opportunities for growth and expansion in the Flow cytometry market?
- What are the service offerings and specifications of leading players in the market?
- INTRODUCCIÓN
- DEFINICIÓN DE MERCADO
- SEGMENTACIÓN DEL MERCADO
- CRONOGRAMAS DE INVESTIGACIÓN
- SUPUESTOS Y LIMITACIONES
- METODOLOGÍA DE LA INVESTIGACIÓN
- MINERÍA DE DATOS
- INVESTIGACIÓN SECUNDARIA
- INVESTIGACIÓN PRIMARIA
- ASESORAMIENTO DE EXPERTOS EN LA MATERIA
- CONTROLES DE CALIDAD
- REVISIÓN FINAL
- TRIANGULACIÓN DE DATOS
- ENFOQUE DE ABAJO HACIA ARRIBA
- ENFOQUE DE ARRIBA HACIA ABAJO
- FLUJO DE INVESTIGACIÓN
- FUENTES DE DATOS
- MINERÍA DE DATOS
- RESUMEN EJECUTIVO
- PANORAMA DEL MERCADO
- PERSPECTIVAS DEL MERCADO MUNDIAL DE CITOMETRÍA DE FLUJO
- IMPULSORES DEL MERCADO
- RESTRICCIONES DEL MERCADO
- OPORTUNIDADES DE MERCADO
- IMPACTO DEL COVID-19 EN EL MERCADO DE CITOMETRÍA DE FLUJO
- MODELO DE LAS CINCO FUERZAS DE PORTER
- AMENAZA DE NUEVOS INGRESANTES
- AMENAZA DE SUSTITUTOS
- PODER DE NEGOCIACIÓN DE LOS PROVEEDORES
- PODER DE NEGOCIACIÓN DE LOS CLIENTES
- GRADO DE COMPETENCIA
- ANÁLISIS DE LA CADENA DE VALOR DE LA INDUSTRIA
- PERSPECTIVAS DEL MERCADO MUNDIAL DE CITOMETRÍA DE FLUJO
- MERCADO GLOBAL DE CITOMETRÍA DE FLUJO POR COMPONENTE (MIL MILLONES DE USD), 2020-2029
- INSTRUMENTOS
- REACTIVOS Y CONSUMIBLES
- SOFTWARE
- SERVICIO
- MERCADO GLOBAL DE CITOMETRÍA DE FLUJO POR TECNOLOGÍA (MILES DE MILLONES DE USD), 2020-2029
- BASADO EN CÉLULAS
- A BASE DE CUENTAS
- MERCADO GLOBAL DE CITOMETRÍA DE FLUJO POR APLICACIÓN (MIL MILLONES DE USD), 2020-2029
- APLICACIONES ACADÉMICAS Y CLÍNICAS
- APLICACIÓN DIAGNÓSTICA
- MERCADO GLOBAL DE CITOMETRÍA DE FLUJO POR USUARIO FINAL (MIL MILLONES DE USD), 2020-2029
- HOSPITALES
- ESCUELAS DE MEDICINA Y LABORATORIOS DE PRUEBAS CLÍNICAS
- ORGANIZACIONES COMERCIALES
- INSTITUCIONES ACADÉMICAS
- OTROS
- GLOBAL FLOW CYTOMETRY MARKET BY REGION (USD BILLION), 2020-2029
- NORTH AMERICA
- US
- CANADA
- MEXICO
- SOUTH AMERICA
- BRAZIL
- ARGENTINA
- COLOMBIA
- REST OF SOUTH AMERICA
- EUROPE
- GERMANY
- UK
- FRANCE
- ITALY
- SPAIN
- RUSSIA
- REST OF EUROPE
- ASIA PACIFIC
- INDIA
- CHINA
- JAPAN
- SOUTH KOREA
- AUSTRALIA
- REST OF ASIA PACIFIC
- MIDDLE EAST AND AFRICA
- UAE
- SOUTH AFRICA
- SAUDI ARABIA
- REST OF MIDDLE EAST AND AFRICA
- NORTH AMERICA
- COMPANY PROFILES* (BUSINESS OVERVIEW, COMPANY SNAPSHOT, PRODUCTS OFFERED, RECENT DEVELOPMENTS)
- AGILENT TECHNOLOGIES INC.
- BECTON DICKINSON AND COMPANY
- BIOMÉRIEUX SA
- BIO-RAD LABORATORIES INC.
- DANAHER CORPORATION
- DIASORIN S.P.A.
- MILTENYI BIOTEC INC.
- SARTORIUS AG
- SYSMEX CORPORATION
- THERMO FISHER SCIENTIFIC INC. *THE COMPANY LIST IS INDICATIVE
LIST OF TABLES
TABLE 1 GLOBAL FLOW CYTOMETRY MARKET BY COMPONENT (USD BILLION), 2020-2029
TABLE 2 GLOBAL FLOW CYTOMETRY MARKET BY TECHNOLOGY (USD BILLION), 2020-2029
TABLE 3 GLOBAL FLOW CYTOMETRY MARKET BY APPLICATION (USD BILLION), 2020-2029
TABLE 4 GLOBAL FLOW CYTOMETRY MARKET BY END-USER (USD BILLION), 2020-2029
TABLE 5 GLOBAL FLOW CYTOMETRY MARKET BY REGION (USD BILLION), 2020-2029
TABLE 6 NORTH AMERICA FLOW CYTOMETRY MARKET BY COMPONENT (USD BILLION), 2020-2029
TABLE 7 NORTH AMERICA FLOW CYTOMETRY MARKET BY TECHNOLOGY (USD BILLION), 2020-2029
TABLE 8 NORTH AMERICA FLOW CYTOMETRY MARKET BY APPLICATION (USD BILLION), 2020-2029
TABLE 9 NORTH AMERICA FLOW CYTOMETRY MARKET BY END-USER (USD BILLION), 2020-2029
TABLE 10 NORTH AMERICA FLOW CYTOMETRY MARKET BY COUNTRY (USD BILLION), 2020-2029
TABLE 11 US FLOW CYTOMETRY MARKET BY COMPONENT (USD BILLION), 2020-2029
TABLE 12 US FLOW CYTOMETRY MARKET BY TECHNOLOGY (USD BILLION), 2020-2029
TABLE 13 US FLOW CYTOMETRY MARKET BY APPLICATION (USD BILLION), 2020-2029
TABLE 14 US FLOW CYTOMETRY MARKET BY END-USER (USD BILLION), 2020-2029
TABLE 15 CANADA FLOW CYTOMETRY MARKET BY COMPONENT (BILLION), 2020-2029
TABLE 16 CANADA FLOW CYTOMETRY MARKET BY TECHNOLOGY (USD BILLION), 2020-2029
TABLE 17 CANADA FLOW CYTOMETRY MARKET BY APPLICATION (USD BILLION), 2020-2029
TABLE 18 CANADA FLOW CYTOMETRY MARKET BY END-USER (USD BILLION), 2020-2029
TABLE 19 MEXICO FLOW CYTOMETRY MARKET BY COMPONENT (USD BILLION), 2020-2029
TABLE 20 MEXICO FLOW CYTOMETRY MARKET BY TECHNOLOGY (USD BILLION), 2020-2029
TABLE 21 MEXICO FLOW CYTOMETRY MARKET BY APPLICATION (USD BILLION), 2020-2029
TABLE 22 MEXICO FLOW CYTOMETRY MARKET BY END-USER (USD BILLION), 2020-2029
TABLE 23 REST OF NORTH AMERICA FLOW CYTOMETRY MARKET BY COMPONENT (USD BILLION), 2020-2029
TABLE 24 REST OF NORTH AMERICA FLOW CYTOMETRY MARKET BY TECHNOLOGY (USD BILLION), 2020-2029
TABLE 25 REST OF NORTH AMERICA FLOW CYTOMETRY MARKET BY APPLICATION (USD BILLION), 2020-2029
TABLE 26 REST OF NORTH AMERICA FLOW CYTOMETRY MARKET BY END-USER (USD BILLION), 2020-2029
TABLE 27 SOUTH AMERICA FLOW CYTOMETRY MARKET BY COMPONENT (USD BILLION), 2020-2029
TABLE 28 SOUTH AMERICA FLOW CYTOMETRY MARKET BY TECHNOLOGY (USD BILLION), 2020-2029
TABLE 29 SOUTH AMERICA FLOW CYTOMETRY MARKET BY APPLICATION (USD BILLION), 2020-2029
TABLE 30 SOUTH AMERICA FLOW CYTOMETRY MARKET BY END-USER (USD BILLION), 2020-2029
TABLE 31 SOUTH AMERICA FLOW CYTOMETRY MARKET BY COUNTRY (USD BILLION), 2020-2029
TABLE 32 BRAZIL FLOW CYTOMETRY MARKET BY COMPONENT (USD BILLION), 2020-2029
TABLE 33 BRAZIL FLOW CYTOMETRY MARKET BY TECHNOLOGY (USD BILLION), 2020-2029
TABLE 34 BRAZIL FLOW CYTOMETRY MARKET BY APPLICATION (USD BILLION), 2020-2029
TABLE 35 BRAZIL FLOW CYTOMETRY MARKET BY END-USER (USD BILLION), 2020-2029
TABLE 36 ARGENTINA FLOW CYTOMETRY MARKET BY COMPONENT (USD BILLION), 2020-2029
TABLE 37 ARGENTINA FLOW CYTOMETRY MARKET BY TECHNOLOGY (USD BILLION), 2020-2029
TABLE 38 ARGENTINA FLOW CYTOMETRY MARKET BY APPLICATION (USD BILLION), 2020-2029
TABLE 39 ARGENTINA FLOW CYTOMETRY MARKET BY END-USER (USD BILLION), 2020-2029
TABLE 40 COLOMBIA FLOW CYTOMETRY MARKET BY COMPONENT (USD BILLION), 2020-2029
TABLE 41 COLOMBIA FLOW CYTOMETRY MARKET BY TECHNOLOGY (USD BILLION), 2020-2029
TABLE 42 COLOMBIA FLOW CYTOMETRY MARKET BY APPLICATION (USD BILLION), 2020-2029
TABLE 43 COLOMBIA FLOW CYTOMETRY MARKET BY END-USER (USD BILLION), 2020-2029
TABLE 44 REST OF SOUTH AMERICA FLOW CYTOMETRY MARKET BY COMPONENT (USD BILLION), 2020-2029
TABLE 45 REST OF SOUTH AMERICA FLOW CYTOMETRY MARKET BY TECHNOLOGY (USD BILLION), 2020-2029
TABLE 46 REST OF SOUTH AMERICA FLOW CYTOMETRY MARKET BY APPLICATION (USD BILLION), 2020-2029
TABLE 47 REST OF SOUTH AMERICA FLOW CYTOMETRY MARKET BY END-USER (USD BILLION), 2020-2029
TABLE 48 ASIA -PACIFIC FLOW CYTOMETRY MARKET BY COMPONENT (USD BILLION), 2020-2029
TABLE 49 ASIA -PACIFIC FLOW CYTOMETRY MARKET BY TECHNOLOGY (USD BILLION), 2020-2029
TABLE 50 ASIA -PACIFIC FLOW CYTOMETRY MARKET BY APPLICATION (USD BILLION), 2020-2029
TABLE 51 ASIA -PACIFIC FLOW CYTOMETRY MARKET BY END-USER (USD BILLION), 2020-2029
TABLE 52 ASIA -PACIFIC FLOW CYTOMETRY MARKET BY COUNTRY (USD BILLION), 2020-2029
TABLE 53 INDIA FLOW CYTOMETRY MARKET BY COMPONENT (USD BILLION), 2020-2029
TABLE 54 INDIA FLOW CYTOMETRY MARKET BY TECHNOLOGY (USD BILLION), 2020-2029
TABLE 55 INDIA FLOW CYTOMETRY MARKET BY APPLICATION (USD BILLION), 2020-2029
TABLE 56 INDIA FLOW CYTOMETRY MARKET BY END-USER (USD BILLION), 2020-2029
TABLE 57 CHINA FLOW CYTOMETRY MARKET BY COMPONENT (USD BILLION), 2020-2029
TABLE 58 CHINA FLOW CYTOMETRY MARKET BY TECHNOLOGY (USD BILLION), 2020-2029
TABLE 59 CHINA FLOW CYTOMETRY MARKET BY APPLICATION (USD BILLION), 2020-2029
TABLE 60 CHINA FLOW CYTOMETRY MARKET BY END-USER (USD BILLION), 2020-2029
TABLE 61 JAPAN FLOW CYTOMETRY MARKET BY COMPONENT (USD BILLION), 2020-2029
TABLE 62 JAPAN FLOW CYTOMETRY MARKET BY TECHNOLOGY (USD BILLION), 2020-2029
TABLE 63 JAPAN FLOW CYTOMETRY MARKET BY APPLICATION (USD BILLION), 2020-2029
TABLE 64 JAPAN FLOW CYTOMETRY MARKET BY END-USER (USD BILLION), 2020-2029
TABLE 65 SOUTH KOREA FLOW CYTOMETRY MARKET BY COMPONENT (USD BILLION), 2020-2029
TABLE 66 SOUTH KOREA FLOW CYTOMETRY MARKET BY TECHNOLOGY (USD BILLION), 2020-2029
TABLE 67 SOUTH KOREA FLOW CYTOMETRY MARKET BY APPLICATION (USD BILLION), 2020-2029
TABLE 68 SOUTH KOREA FLOW CYTOMETRY MARKET BY END-USER (USD BILLION), 2020-2029
TABLE 69 AUSTRALIA FLOW CYTOMETRY MARKET BY COMPONENT (USD BILLION), 2020-2029
TABLE 70 AUSTRALIA HYBRID APPLICATIONBY TECHNOLOGY (USD BILLION), 2020-2029
TABLE 71 AUSTRALIA FLOW CYTOMETRY MARKET BY APPLICATION (USD BILLION), 2020-2029
TABLE 72 AUSTRALIA FLOW CYTOMETRY MARKET BY END-USER (USD BILLION), 2020-2029
TABLE 73 REST OF ASIA PACIFIC FLOW CYTOMETRY MARKET BY COMPONENT (USD BILLION), 2020-2029
TABLE 74 REST OF ASIA PACIFIC HYBRID APPLICATIONBY TECHNOLOGY (USD BILLION), 2020-2029
TABLE 75 REST OF ASIA PACIFIC FLOW CYTOMETRY MARKET BY APPLICATION (USD BILLION), 2020-2029
TABLE 76 REST OF ASIA PACIFIC FLOW CYTOMETRY MARKET BY END-USER (USD BILLION), 2020-2029
TABLE 77 EUROPE FLOW CYTOMETRY MARKET BY COMPONENT (USD BILLION), 2020-2029
TABLE 78 EUROPE FLOW CYTOMETRY MARKET BY TECHNOLOGY (USD BILLION), 2020-2029
TABLE 79 EUROPE FLOW CYTOMETRY MARKET BY APPLICATION (USD BILLION), 2020-2029
TABLE 80 EUROPE FLOW CYTOMETRY MARKET BY END-USER (USD BILLION), 2020-2029
TABLE 81 EUROPE FLOW CYTOMETRY MARKET BY COUNTRY (USD BILLION), 2020-2029
TABLE 82 GERMANY FLOW CYTOMETRY MARKET BY COMPONENT (USD BILLION), 2020-2029
TABLE 83 GERMANY FLOW CYTOMETRY MARKET BY TECHNOLOGY (USD BILLION), 2020-2029
TABLE 84 GERMANY FLOW CYTOMETRY MARKET BY APPLICATION (USD BILLION), 2020-2029
TABLE 85 GERMANY FLOW CYTOMETRY MARKET BY END-USER (USD BILLION), 2020-2029
TABLE 86 UK FLOW CYTOMETRY MARKET BY COMPONENT (USD BILLION), 2020-2029
TABLE 87 UK FLOW CYTOMETRY MARKET BY TECHNOLOGY (USD BILLION), 2020-2029
TABLE 88 UK FLOW CYTOMETRY MARKET BY APPLICATION (USD BILLION), 2020-2029
TABLE 89 UK FLOW CYTOMETRY MARKET BY END-USER (USD BILLION), 2020-2029
TABLE 90 FRANCE FLOW CYTOMETRY MARKET BY COMPONENT (USD BILLION), 2020-2029
TABLE 91 FRANCE FLOW CYTOMETRY MARKET BY TECHNOLOGY (USD BILLION), 2020-2029
TABLE 92 FRANCE FLOW CYTOMETRY MARKET BY APPLICATION (USD BILLION), 2020-2029
TABLE 93 FRANCE FLOW CYTOMETRY MARKET BY END-USER (USD BILLION), 2020-2029
TABLE 94 ITALY FLOW CYTOMETRY MARKET BY COMPONENT (USD BILLION), 2020-2029
TABLE 95 ITALY FLOW CYTOMETRY MARKET BY TECHNOLOGY (USD BILLION), 2020-2029
TABLE 96 ITALY FLOW CYTOMETRY MARKET BY APPLICATION (USD BILLION), 2020-2029
TABLE 97 ITALY FLOW CYTOMETRY MARKET BY END-USER (USD BILLION), 2020-2029
TABLE 98 SPAIN FLOW CYTOMETRY MARKET BY COMPONENT (USD BILLION), 2020-2029
TABLE 99 SPAIN FLOW CYTOMETRY MARKET BY TECHNOLOGY (USD BILLION), 2020-2029
TABLE 100 SPAIN FLOW CYTOMETRY MARKET BY APPLICATION (USD BILLION), 2020-2029
TABLE 101 SPAIN FLOW CYTOMETRY MARKET BY END-USER (USD BILLION), 2020-2029
TABLE 102 RUSSIA FLOW CYTOMETRY MARKET BY COMPONENT (USD BILLION), 2020-2029
TABLE 103 RUSSIA FLOW CYTOMETRY MARKET BY TECHNOLOGY (USD BILLION), 2020-2029
TABLE 104 RUSSIA FLOW CYTOMETRY MARKET BY APPLICATION (USD BILLION), 2020-2029
TABLE 105 RUSSIA FLOW CYTOMETRY MARKET BY END-USER (USD BILLION), 2020-2029
TABLE 106 REST OF EUROPE FLOW CYTOMETRY MARKET BY COMPONENT (USD BILLION), 2020-2029
TABLE 107 REST OF EUROPE FLOW CYTOMETRY MARKET BY TECHNOLOGY (USD BILLION), 2020-2029
TABLE 108 REST OF EUROPE FLOW CYTOMETRY MARKET BY APPLICATION (USD BILLION), 2020-2029
TABLE 109 REST OF EUROPE FLOW CYTOMETRY MARKET BY END-USER (USD BILLION), 2020-2029
TABLE 110 MIDDLE EAST AND AFRICA FLOW CYTOMETRY MARKET BY COMPONENT (USD BILLION), 2020-2029
TABLE 111 MIDDLE EAST AND AFRICA FLOW CYTOMETRY MARKET BY TECHNOLOGY (USD BILLION), 2020-2029
TABLE 112 MIDDLE EAST AND AFRICA FLOW CYTOMETRY MARKET BY APPLICATION (USD BILLION), 2020-2029
TABLE 113 MIDDLE EAST AND AFRICA FLOW CYTOMETRY MARKET BY END-USER (USD BILLION), 2020-2029
TABLE 114 MIDDLE EAST ABD AFRICA FLOW CYTOMETRY MARKET BY COUNTRY (USD BILLION), 2020-2029
TABLE 115 UAE FLOW CYTOMETRY MARKET BY COMPONENT (USD BILLION), 2020-2029
TABLE 116 UAE FLOW CYTOMETRY MARKET BY TECHNOLOGY (USD BILLION), 2020-2029
TABLE 117 UAE FLOW CYTOMETRY MARKET BY APPLICATION (USD BILLION), 2020-2029
TABLE 118 UAE FLOW CYTOMETRY MARKET BY END-USER (USD BILLION), 2020-2029
TABLE 119 SAUDI ARABIA FLOW CYTOMETRY MARKET BY COMPONENT (USD BILLION), 2020-2029
TABLE 120 SAUDI ARABIA FLOW CYTOMETRY MARKET BY TECHNOLOGY (USD BILLION), 2020-2029
TABLE 121 SAUDI ARABIA FLOW CYTOMETRY MARKET BY APPLICATION (USD BILLION), 2020-2029
TABLE 122 SAUDI ARABIA FLOW CYTOMETRY MARKET BY END-USER (USD BILLION), 2020-2029
TABLE 123 SOUTH AFRICA FLOW CYTOMETRY MARKET BY COMPONENT (USD BILLION), 2020-2029
TABLE 124 SOUTH AFRICA FLOW CYTOMETRY MARKET BY TECHNOLOGY (USD BILLION), 2020-2029
TABLE 125 SOUTH AFRICA FLOW CYTOMETRY MARKET BY APPLICATION (USD BILLION), 2020-2029
TABLE 126 SOUTH AFRICA FLOW CYTOMETRY MARKET BY END-USER (USD BILLION), 2020-2029
TABLE 127 REST OF MIDDLE EAST AND AFRICA FLOW CYTOMETRY MARKET BY COMPONENT (USD BILLION), 2020-2029
TABLE 128 REST OF MIDDLE EAST AND AFRICA FLOW CYTOMETRY MARKET BY TECHNOLOGY (USD BILLION), 2020-2029
TABLE 129 REST OF MIDDLE EAST AND AFRICA FLOW CYTOMETRY MARKET BY APPLICATION (USD BILLION), 2020-2029
TABLE 130 REST OF MIDDLE EAST AND AFRICA FLOW CYTOMETRY MARKET BY END-USER (USD BILLION), 2020-2029
LIST OF FIGURES
FIGURE 1 MARKET DYNAMICS
FIGURE 2 MARKET SEGMENTATION
FIGURE 3 REPORT TIMELINES: YEARS CONSIDERED
FIGURE 4 DATA TRIANGULATION
FIGURE 5 BOTTOM-UP APPROACH
FIGURE 6 TOP-DOWN APPROACH
FIGURE 7 RESEARCH FLOW
FIGURE 8 GLOBAL FLOW CYTOMETRY MARKET BY COMPONENT, USD BILLION, 2020-2029
FIGURE 9 GLOBAL FLOW CYTOMETRY MARKET BY TECHNOLOGY, USD BILLION, 2020-2029
FIGURE 10 GLOBAL FLOW CYTOMETRY MARKET BY APPLICATION, USD BILLION, 2020-2029
FIGURE 11 GLOBAL FLOW CYTOMETRY MARKET BY END-USER, USD BILLION, 2020-2029
FIGURE 12 GLOBAL FLOW CYTOMETRY MARKET BY REGION, USD BILLION, 2020-2029
FIGURE 13 PORTER’S FIVE FORCES MODEL
FIGURE 14 FLOW CYTOMETRY MARKET BY COMPONENT 2021
FIGURE 15 FLOW CYTOMETRY MARKET BY TECHNOLOGY 2021
FIGURE 16 FLOW CYTOMETRY MARKET BY APPLICATION 2021
FIGURE 17 FLOW CYTOMETRY MARKET BY END-USER 2021
FIGURE 18 FLOW CYTOMETRY MARKET BY REGION 2021
FIGURE 19 MARKET SHARE ANALYSIS
FIGURE 20 AGILENT TECHNOLOGIES INC.: COMPANY SNAPSHOT
FIGURE 21 BECTON DICKINSON AND COMPANY: COMPANY SNAPSHOT
FIGURE 22 BIOMÉRIEUX SA: COMPANY SNAPSHOT
FIGURE 23 BIO-RAD LABORATORIES INC.: COMPANY SNAPSHOT
FIGURE 24 DANAHER CORPORATION: COMPANY SNAPSHOT
FIGURE 25 DIASORIN S.P.A.: COMPANY SNAPSHOT
FIGURE 26 MILTENYI BIOTEC INC.: COMPANY SNAPSHOT
FIGURE 27 SARTORIUS AG: COMPANY SNAPSHOT
FIGURE 28 SYSMEX CORPORATION: COMPANY SNAPSHOT
FIGURE 29 THERMO FISHER SCIENTIFIC INC.: COMPANY SNAPSHOT
DOWNLOAD FREE SAMPLE REPORT
License Type
SPEAK WITH OUR ANALYST
Want to know more about the report or any specific requirement?
WANT TO CUSTOMIZE THE REPORT?
Our Clients Speak
We asked them to research ‘ Equipment market’ all over the world, and their whole arrangement was helpful to us. thehealthanalytics.com insightful analysis and reports contributed to our current analysis and in creating a future strategy. Besides, the te
Yosuke Mitsui
Senior Associate Construction Equipment Sales & Marketing
We asked them to research ‘Equipment market’ all over the world, and their whole arrangement was helpful to us. thehealthanalytics.com insightful analysis and reports contributed to our current analysis and in creating a future strategy. Besides, the te


