

Base Year Value ()
x.x %
x.x %
CAGR ()
x.x %
x.x %
Forecast Year Value ()
x.x %
x.x %
Historical Data Period
Largest Region
Forecast Period
Mercado de generación de hidrógeno por fuente (hidrógeno azul, hidrógeno gris, hidrógeno verde), aplicación (refinería de petróleo, producción de amoníaco, producción de metanol, transporte, generación de energía), tecnología (reformado de metano con vapor, oxidación parcial, gasificación de carbón, electrólisis), modo de entrega (cautivo, comercial) por región (América del Norte, Europa, Asia Pacífico, América del Sur, Oriente Medio y África) Tendencias globales y pronóstico de 2023 a 2029
Instant access to hundreds of data points and trends
- Market estimates from 2014-2029
- Competitive analysis, industry segmentation, financial benchmarks
- Incorporates SWOT, Porter's Five Forces and risk management frameworks
- PDF report or online database with Word, Excel and PowerPoint export options
- 100% money back guarantee
Panorama general del mercado de generación de hidrógeno
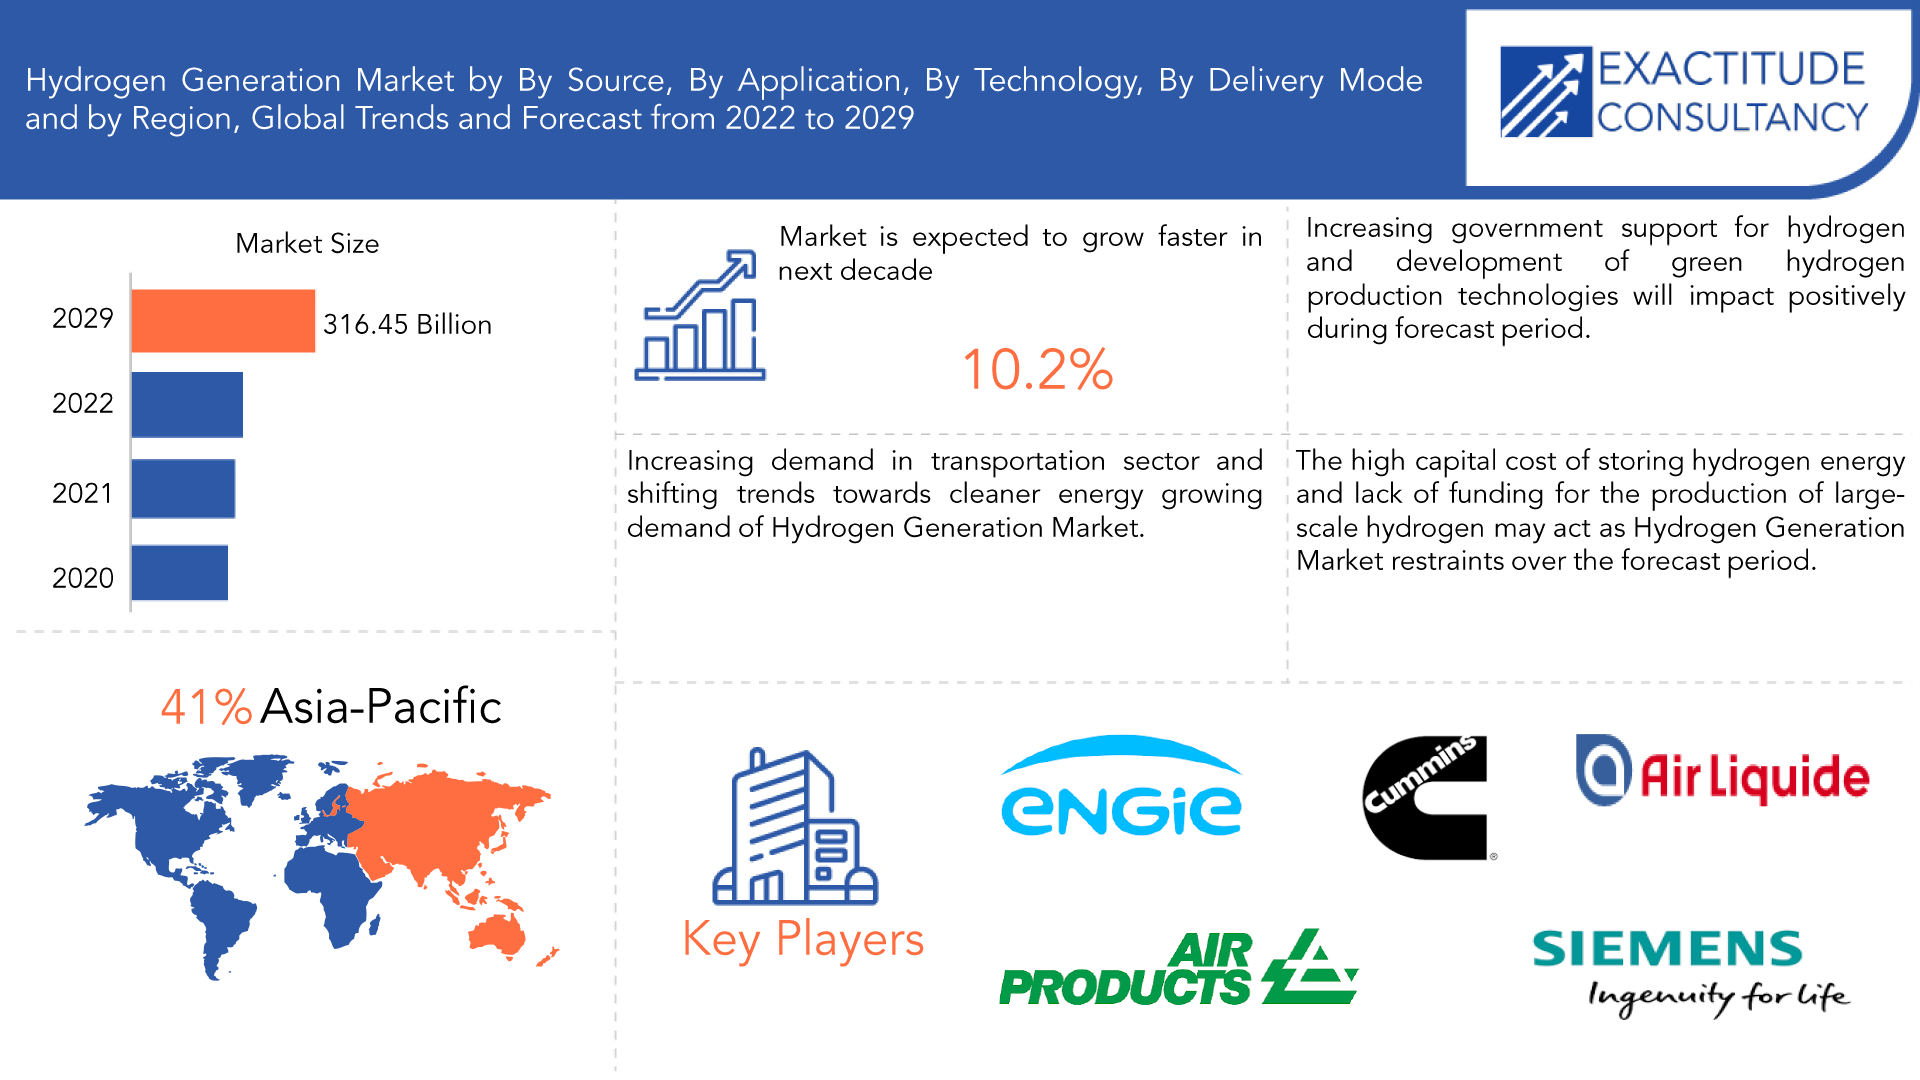
Se espera que el mercado de generación de hidrógeno crezca a una tasa anual compuesta del 10,2 % entre 2022 y 2029 y alcance más de 316 450 millones de dólares en 2029.
La generación de hidrógeno es un método industrial para generar gas hidrógeno. El hidrógeno desempeña un papel importante en la industria química y del petróleo y el gas. Se puede producir con la ayuda de diversos recursos nacionales, como combustibles fósiles, biomasa y electrólisis del agua con electricidad. El uso de pilas de combustible de hidrógeno en vehículos ligeros, incluidas bicicletas, automóviles, autobuses, trenes, equipos de manipulación de materiales, barcos, buques, aviones comerciales, unidades de potencia auxiliares (APU) de aeronaves, buques marinos y vehículos especiales como carretillas elevadoras, está promoviendo el crecimiento del mercado en la industria del transporte.
| ATRIBUTO | DETALLES |
| Periodo de estudio | 2020-2029 |
| Año base | 2021 |
| Año estimado | 2022 |
| Año pronosticado | 2022-2029 |
| Periodo histórico | 2018-2020 |
| Unidad | Valor (miles de millones de USD) |
| Segmentación | POR Fuente, Aplicación, Tecnología, Modo de entrega y Región. |
| Por fuente |
|
| Por aplicación |
|
| Por tecnología |
|
| Por modo de entrega |
|
| Por región |
|
Mientras tanto, el hidrógeno es un poderoso transportador de energía, y se prevé que su expansión continua hacia mercados adicionales se beneficie enormemente de esta propiedad. Se prevé un aumento en el consumo mundial de electricidad de aproximadamente dos tercios de la demanda actual. Se prevé que los proyectos de distribución de energía y servicios públicos impulsen la necesidad de expansión de la industria de generación de hidrógeno durante el período de pronóstico.
[título id="attachment_14915" align="aligncenter" width="1920"]
Frequently Asked Questions
• What is the worth of the global Hydrogen generation market?
The Hydrogen generation market size crossed USD 132.15 Billion in 2020 and will observe a CAGR of more than 10.2% up to 2029
• What is the dominant market segment for Hydrogen generation in terms of application?
Ammonia production segment expected to hold the largest share of hydrogen generation market during the forecast period
• What is the CAGR of Hydrogen generation market?
The global Hydrogen generation market registered a CAGR of 10.2% from 2022 to 2029. The industry segment was the highest revenue contributor to the market.
• Which are the top companies to hold the market share in the Hydrogen generation market?
Key players profiled in the report include Linde plc, Air Liquide, Cummins Inc., Air Products Inc., Engie, Siemens, ITM Power, S.A., McPhy Energy S.A., Messer, Enapter S.r.l., Iwatani Corporation, Xebec Adsorption Inc., Green Hydrogen, Plug Power Inc., and others.
• What are the main factors driving the market of Hydrogen generation?
Increasing demand of hydrogen in industrial segment and rising demand of transportation and power generation applications expected to foster market growth during the forecast period.
• Which is the largest regional market for hydrogen generation market?
Asia-Pacific is the largest regional market for hydrogen generation market.
Hydrogen Generation Market Segment Analysis
The global hydrogen generation market is segmented into source, application, technology, delivery mode and Region. By source the hydrogen generation market is classified into three types blue hydrogen, grey hydrogen, and green hydrogen. The grey hydrogen segment dominates the global hydrogen generation market. Grey hydrogen is obtained from natural gas and produced from fossil fuels, creating it the least renewable form of hydrogen. Most of the hydrogen produced is grey hydrogen. It is frequently used in the chemical industry to refine oil and make fertilizer because it is reasonably cheap. The demand for grey hydrogen in the market for hydrogen generation is projected to be driven by factors such as rapid globalization, industrialization, and an increase in the use of hydrogen in fuel cell powered automobiles.
Based on application, the market for hydrogen generation is divided into ammonia production, transportation, petroleum refinery, methanol production, power generation segment, and others. Ammonia production application is possible to lead the market size owned to the capabilities to utilize different technologies, growing technical expertise, and synthesizing ammonia in huge volumes.
Based on technology, this industry can be majorly segregated into Steam Methane Reforming, Partial Oxidation, Coal Gasification, Electrolysis. The steam methane reforming (SMR) segment is projected to account for a substantial portion owing to its better output, Input fuel flexibility, and low-cost operations. Moreover, the growing demand for automotive fuel cells to power private and commercial transportation fleets is probable to favor the partial oil oxidation segment growth.
On the basis of delivery mode, the market is segmented into captive and merchant mode whereas captive segment dominates the hydrogen generation market. The demand for hydrogen in the production of variety of chemicals, and in petroleum industry in a large quantity is a major factor projected to drive the demand for captive mode hydrogen generation market.
On the basis of region, the market is divided into North America, Europe, Asia Pacific, and the Rest of the world. North America is holding the largest sector of the Global Hydrogen generation Market during the projected period.
[caption id="attachment_14917" align="aligncenter" width="1920"]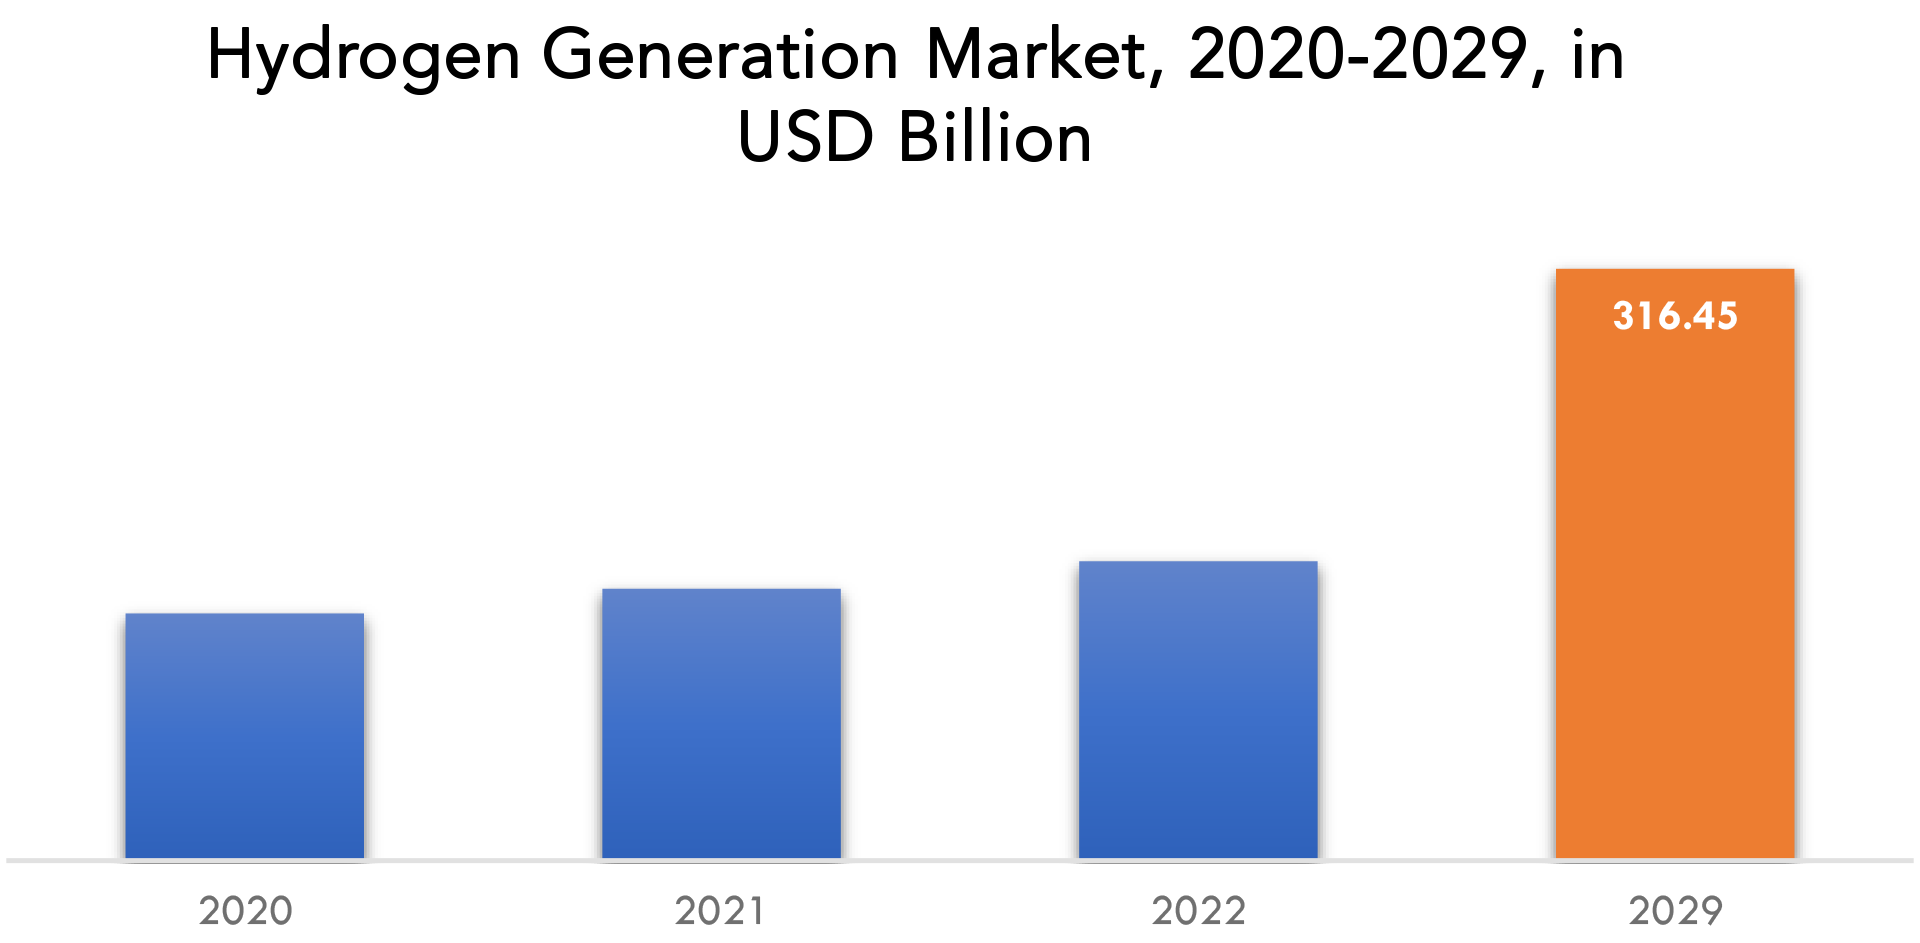
Hydrogen Generation Market Players:
The major players operating in the global hydrogen generation industry include Linde plc, Air Liquide, Cummins Inc., Air Products Inc., Engie, Siemens, ITM Power, S.A., McPhy Energy S.A., Messer, Enapter S.r.l., Iwatani Corporation, Xebec Adsorption Inc., Green Hydrogen, Plug Power Inc., and others. Industry Development:- February 02, 2023: Air Liquide and Total Energies announced their decision to generate an equally owned joint venture to develop a network of hydrogen stations, geared towards heavy duty vehicles on major European road corridors. This initiative will help enable access to hydrogen, enabling the development of its use for goods transportation and further strengthening the hydrogen sector.
- December 21, 2022: Air Liquide welcomed the Dutch State decision to support its large-scale renewable hydrogen projects and named ELYgator and CurtHyl, through the Important Project of Common European Interest (IPCEI) Hy2Use program.
Who Should Buy? Or Key stakeholders
- Research and development
- Manufacturing
- End-Use Industries
- Automotive
- Government and Regional Agencies
- Regulatory Bodies
- Environmental Monitoring
- Energy & Power
- Scientific Research & Development
- Others
Hydrogen Generation Market Regional Analysis
Geographically, the Hydrogen generation market is segmented into North America, South America, Europe, APAC and MEA.
- North America: includes the US, Canada, Mexico
- Europe: includes UK, Germany, France, Italy, Spain, Russia, and Rest of Europe
- Asia Pacific: includes China, Japan, South Korea, India, Australia, ASEAN and the Rest of APAC
- South America: includes Brazil, Argentina, and Rest of South America
- Middle East & Africa: includes Turkey, UAE, Saudi Arabia, South Africa, and Rest of MEA
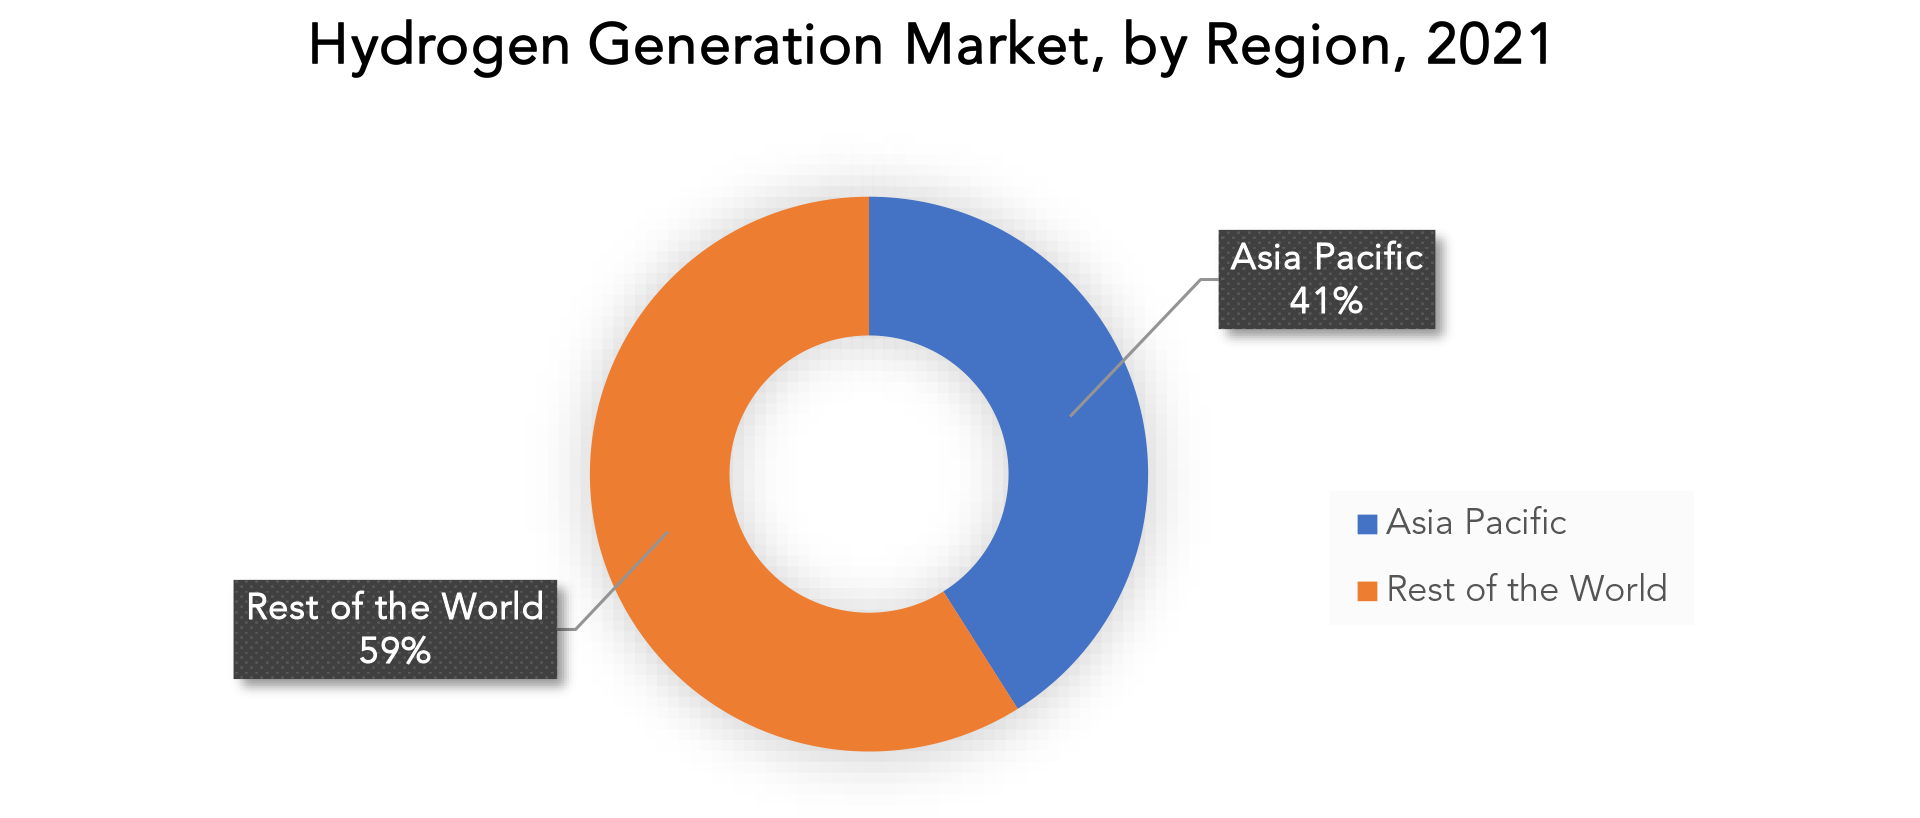
Asia-Pacific is dominated the global market and accounted for the largest revenue share of over 41%. Asia-Pacific analyzed across China, Japan, India, South Korea, Australia, and the Rest of Asia-Pacific. Hydrogen plays an important role in this region as it can be used to generate electricity for the future usage. Hydrogen producers in the region are looking to develop their geographical spread and target countries like Vietnam, Indonesia, and South Africa among other developing nations, to increase their revenue.
Asia-Pacific region contains many developing and under-developed countries, and is also the most populated region across the world. The market is expected to benefit from an increase in the use of ethanol-blend fuel in this region as well as ongoing reforms in India to increase the percentage of ethanol blend in the fuel. Additionally, governments in some Asia-Pacific countries like Japan and Australia, are researching cleaner and greener methods of producing hydrogen and these policies and investments are major factors driving the growth of the market in this region during the forecast period.
Key Market Segments: Hydrogen generation Market
Hydrogen Generation Market By Source, 2020-2029, (USD Billion)- Blue Hydrogen
- Gray Hydrogen
- Green Hydrogen
- Petroleum Refinery
- Ammonia Production
- Methanol Production
- Transportation
- Power Generation
- Steam Methane Reformin (Smr)
- Partial Oxidation (Pox)
- Coal Gasification
- Electrolysis
- Captive
- Merchant
- North America
- Europe
- Asia Pacific
- South America
- Middle East And Africa
Exactitude Consultancy Services Key Objectives:
- Increasing sales and market share
- Developing new technology
- Improving profitability
- Entering new markets
- Enhancing brand reputation
The Key Questions Answered in The Report Are
- What is the expected growth rate of the hydrogen generation market over the next 7 years?
- Who are the major players in the hydrogen generation market and what is their market share?
- What are the end-user industries driving demand for market and what is their outlook?
- What are the opportunities for growth in emerging markets such as Asia-Pacific, Middle East, and Africa?
- How is the economic environment affecting the hydrogen generation market, including factors such as interest rates, inflation, and exchange rates?
- What is the expected impact of government policies and regulations on the Hydrogen generation market?
- What is the current and forecasted size and growth rate of the global hydrogen generation market?
- What are the key drivers of growth in the hydrogen generation market?
- Who are the major players in the market and what is their market share?
- What are the distribution channels and supply chain dynamics in the hydrogen generation market?
- What are the technological advancements and innovations in the hydrogen generation market and their impact on product development and growth?
- What are the regulatory considerations and their impact on the market?
- What are the challenges faced by players in the hydrogen generation market and how are they addressing these challenges?
- What are the opportunities for growth and expansion in the hydrogen generation market?
- What are the services offerings and specifications of leading players in the market?
- INTRODUCCIÓN
- DEFINICIÓN DE MERCADO
- SEGMENTACIÓN DEL MERCADO
- CRONOGRAMAS DE INVESTIGACIÓN
- SUPUESTOS Y LIMITACIONES
- METODOLOGÍA DE LA INVESTIGACIÓN
- MINERÍA DE DATOS
- INVESTIGACIÓN SECUNDARIA
- INVESTIGACIÓN PRIMARIA
- ASESORAMIENTO DE EXPERTOS EN LA MATERIA
- CONTROLES DE CALIDAD
- REVISIÓN FINAL
- TRIANGULACIÓN DE DATOS
- ENFOQUE DE ABAJO HACIA ARRIBA
- ENFOQUE DE ARRIBA HACIA ABAJO
- FLUJO DE INVESTIGACIÓN
- FUENTES DE DATOS
- MINERÍA DE DATOS
- RESUMEN EJECUTIVO
- MARKET OVERVIEW
- GLOBAL HYDROGEN GENERATION MARKET OUTLOOK
- MARKET DRIVERS
- MARKET RESTRAINTS
- MARKET OPPORTUNITIES
- IMPACT OF COVID-19 ON THE GLOBAL HYDROGEN GENERATION MARKET
- GLOBAL HYDROGEN GENERATION MARKET OUTLOOK
- GLOBAL HYDROGEN GENERATION MARKET BY SOURCE, (USD BILLION)
- BLUE HYDROGEN
- GRAY HYDROGEN
- GREEN HYDROGEN
- GLOBAL HYDROGEN GENERATION MARKET BY APPLICATION, (USD BILLION)
- PETROLEUM REFINERY
- AMMONIA PRODUCTION
- METHANOL PRODUCTION
- TRANSPORTATION
- POWER GENERATION
- GLOBAL HYDROGEN GENERATION MARKET BY TECHNOLOGY, (USD BILLION)
- STEAM METHANE REFORMING (SMR)
- PARTIAL OXIDATION (POX)
- COAL GASIFICATION
- ELECTROLYSIS
- GLOBAL HYDROGEN GENERATION MARKET BY DELIVERY MODE, (USD BILLION)
- CAPTIVE
- MERCHANT
- GLOBAL HYDROGEN GENERATION MARKET BY REGION, (USD BILLION)
- INTRODUCTION
- ASIA-PACIFIC
- CHINA
- INDIA
- JAPAN
- SOUTH KOREA
- AUSTRALIA
- SOUTH-EAST ASIA
- REST OF ASIA-PACIFIC
- NORTH AMERICA
- UNITED STATES
- CANADA
- MEXICO
- EUROPE
- GERMANY
- UNITED KINGDOM
- FRANCE
- ITALY
- SPAIN
- RUSSIA
- REST OF EUROPE
- SOUTH AMERICA
- BRAZIL
- ARGENTINA
- COLOMBIA
- REST OF SOUTH AMERICA
- MIDDLE EAST AND AFRICA
- UAE
- SAUDI ARABIA
- SOUTH AFRICA
- REST OF MIDDLE EAST AND AFRICA
- COMPANY PROFILES*
(BUSINESS OVERVIEW, COMPANY SNAPSHOT, PRODUCTS OFFERED, RECENT DEVELOPMENTS)
- LINDE PLC
- AIR LIQUIDE
- CUMMINS INC.
- AIR PRODUCTS INC.
- ENGIE
- SIEMENS
- ITM POWER
- MCPHY ENERGY S.A.
- MESSER
- ENAPTER S.R.L.
- IWATANI CORPORATION
- XEBEC ADSORPTION INC.
- GREEN HYDROGEN
- PLUG POWER INC.
- OTHERS
*THE COMPANY LIST IS INDICATIVE
LIST OF TABLES
TABLE 1 GLOBAL HYDROGEN GENERATION MARKET BY SOURCE (USD BILLION) 2020-2029
TABLE 2 GLOBAL HYDROGEN GENERATION MARKET BY APPLICATION (USD BILLION) 2020-2029
TABLE 3 GLOBAL HYDROGEN GENERATION MARKET BY TECHNOLOGY (USD BILLION) 2020-2029
TABLE 4 GLOBAL HYDROGEN GENERATION MARKET BY DELIVERY MODE (USD BILLION) 2020-2029
TABLE 5 GLOBAL HYDROGEN GENERATION MARKET BY REGION (USD BILLION) 2020-2029
TABLE 6 NORTH AMERICA HYDROGEN GENERATION MARKET BY COUNTRY (USD BILLION), 2020-2029
TABLE 7 NORTH AMERICA HYDROGEN GENERATION MARKET BY SOURCE (USD BILLION) 2020-2029
TABLE 8 NORTH AMERICA HYDROGEN GENERATION MARKET BY APPLICATION (USD BILLION) 2020-2029
TABLE 9 NORTH AMERICA HYDROGEN GENERATION MARKET BY TECHNOLOGY (USD BILLION) 2020-2029
TABLE 10 NORTH AMERICA HYDROGEN GENERATION MARKET BY DELIVERY MODE (USD BILLION) 2020-2029
TABLE 11 US HYDROGEN GENERATION MARKET BY SOURCE (USD BILLION) 2020-2029
TABLE 12 US HYDROGEN GENERATION MARKET BY APPLICATION (USD BILLION) 2020-2029
TABLE 13 US HYDROGEN GENERATION MARKET BY TECHNOLOGY (USD BILLION) 2020-2029
TABLE 14 US HYDROGEN GENERATION MARKET BY DELIVERY MODE (USD BILLION) 2020-2029
TABLE 15 CANADA HYDROGEN GENERATION MARKET BY SOURCE (USD BILLION) 2020-2029
TABLE 16 CANADA HYDROGEN GENERATION MARKET BY APPLICATION (USD BILLION) 2020-2029
TABLE 17 CANADA HYDROGEN GENERATION MARKET BY TECHNOLOGY (USD BILLION) 2020-2029
TABLE 18 CANADA HYDROGEN GENERATION MARKET BY DELIVERY MODE (USD BILLION) 2020-2029
TABLE 19 MEXICO HYDROGEN GENERATION MARKET BY SOURCE (USD BILLION) 2020-2029
TABLE 20 MEXICO HYDROGEN GENERATION MARKET BY APPLICATION (USD BILLION) 2020-2029
TABLE 21 MEXICO HYDROGEN GENERATION MARKET BY TECHNOLOGY (USD BILLION) 2020-2029
TABLE 22 MEXICO HYDROGEN GENERATION MARKET BY DELIVERY MODE (USD BILLION) 2020-2029
TABLE 23 SOUTH AMERICA HYDROGEN GENERATION MARKET BY COUNTRY (USD BILLION), 2020-2029
TABLE 24 SOUTH AMERICA HYDROGEN GENERATION MARKET BY SOURCE (USD BILLION) 2020-2029
TABLE 25 SOUTH AMERICA HYDROGEN GENERATION MARKET BY APPLICATION (USD BILLION) 2020-2029
TABLE 26 SOUTH AMERICA HYDROGEN GENERATION MARKET BY TECHNOLOGY (USD BILLION) 2020-2029
TABLE 27 SOUTH AMERICA HYDROGEN GENERATION MARKET BY DELIVERY MODE (USD BILLION) 2020-2029
TABLE 28 BRAZIL HYDROGEN GENERATION MARKET BY SOURCE (USD BILLION) 2020-2029
TABLE 29 BRAZIL HYDROGEN GENERATION MARKET BY APPLICATION (USD BILLION) 2020-2029
TABLE 30 BRAZIL HYDROGEN GENERATION MARKET BY TECHNOLOGY (USD BILLION) 2020-2029
TABLE 31 BRAZIL HYDROGEN GENERATION MARKET BY DELIVERY MODE (USD BILLION) 2020-2029
TABLE 32 ARGENTINA HYDROGEN GENERATION MARKET BY SOURCE (USD BILLION) 2020-2029
TABLE 33 ARGENTINA HYDROGEN GENERATION MARKET BY APPLICATION (USD BILLION) 2020-2029
TABLE 34 ARGENTINA HYDROGEN GENERATION MARKET BY TECHNOLOGY (USD BILLION) 2020-2029
TABLE 35 ARGENTINA HYDROGEN GENERATION MARKET BY DELIVERY MODE (USD BILLION) 2020-2029
TABLE 36 COLOMBIA HYDROGEN GENERATION MARKET BY SOURCE (USD BILLION) 2020-2029
TABLE 37 COLOMBIA HYDROGEN GENERATION MARKET BY APPLICATION (USD BILLION) 2020-2029
TABLE 38 COLOMBIA HYDROGEN GENERATION MARKET BY TECHNOLOGY (USD BILLION) 2020-2029
TABLE 39 COLOMBIA HYDROGEN GENERATION MARKET BY DELIVERY MODE (USD BILLION) 2020-2029
TABLE 40 REST OF SOUTH AMERICA HYDROGEN GENERATION MARKET BY SOURCE (USD BILLION) 2020-2029
TABLE 41 REST OF SOUTH AMERICA HYDROGEN GENERATION MARKET BY APPLICATION (USD BILLION) 2020-2029
TABLE 42 REST OF SOUTH AMERICA HYDROGEN GENERATION MARKET BY TECHNOLOGY (USD BILLION) 2020-2029
TABLE 43 REST OF SOUTH AMERICA HYDROGEN GENERATION MARKET BY DELIVERY MODE (USD BILLION) 2020-2029
TABLE 44 ASIA PACIFIC HYDROGEN GENERATION MARKET BY COUNTRY (USD BILLION), 2020-2029
TABLE 45 ASIA PACIFIC HYDROGEN GENERATION MARKET BY SOURCE (USD BILLION) 2020-2029
TABLE 46 ASIA PACIFIC HYDROGEN GENERATION MARKET BY APPLICATION (USD BILLION) 2020-2029
TABLE 47 ASIA PACIFIC HYDROGEN GENERATION MARKET BY TECHNOLOGY (USD BILLION) 2020-2029
TABLE 48 ASIA PACIFIC HYDROGEN GENERATION MARKET BY DELIVERY MODE (USD BILLION) 2020-2029
TABLE 49 INDIA HYDROGEN GENERATION MARKET BY SOURCE (USD BILLION) 2020-2029
TABLE 50 INDIA HYDROGEN GENERATION MARKET BY APPLICATION (USD BILLION) 2020-2029
TABLE 51 INDIA HYDROGEN GENERATION MARKET BY TECHNOLOGY (USD BILLION) 2020-2029
TABLE 52 INDIA HYDROGEN GENERATION MARKET BY DELIVERY MODE (USD BILLION) 2020-2029
TABLE 53 CHINA HYDROGEN GENERATION MARKET BY SOURCE (USD BILLION) 2020-2029
TABLE 54 CHINA HYDROGEN GENERATION MARKET BY APPLICATION (USD BILLION) 2020-2029
TABLE 55 CHINA HYDROGEN GENERATION MARKET BY TECHNOLOGY (USD BILLION) 2020-2029
TABLE 56 CHINA HYDROGEN GENERATION MARKET BY DELIVERY MODE (USD BILLION) 2020-2029
TABLE 57 JAPAN HYDROGEN GENERATION MARKET BY SOURCE (USD BILLION) 2020-2029
TABLE 58 JAPAN HYDROGEN GENERATION MARKET BY APPLICATION (USD BILLION) 2020-2029
TABLE 59 JAPAN HYDROGEN GENERATION MARKET BY TECHNOLOGY (USD BILLION) 2020-2029
TABLE 60 JAPAN HYDROGEN GENERATION MARKET BY DELIVERY MODE (USD BILLION) 2020-2029
TABLE 61 SOUTH KOREA HYDROGEN GENERATION MARKET BY SOURCE (USD BILLION) 2020-2029
TABLE 62 SOUTH KOREA HYDROGEN GENERATION MARKET BY APPLICATION (USD BILLION) 2020-2029
TABLE 63 SOUTH KOREA HYDROGEN GENERATION MARKET BY TECHNOLOGY (USD BILLION) 2020-2029
TABLE 64 SOUTH KOREA HYDROGEN GENERATION MARKET BY DELIVERY MODE (USD BILLION) 2020-2029
TABLE 65 AUSTRALIA HYDROGEN GENERATION MARKET BY SOURCE (USD BILLION) 2020-2029
TABLE 66 AUSTRALIA HYDROGEN GENERATION MARKET BY APPLICATION (USD BILLION) 2020-2029
TABLE 67 AUSTRALIA HYDROGEN GENERATION MARKET BY TECHNOLOGY (USD BILLION) 2020-2029
TABLE 68 AUSTRALIA HYDROGEN GENERATION MARKET BY DELIVERY MODE (USD BILLION) 2020-2029
TABLE 69 SOUTH-EAST ASIA HYDROGEN GENERATION MARKET BY SOURCE (USD BILLION) 2020-2029
TABLE 70 SOUTH-EAST ASIA HYDROGEN GENERATION MARKET BY APPLICATION (USD BILLION) 2020-2029
TABLE 71 SOUTH-EAST ASIA HYDROGEN GENERATION MARKET BY TECHNOLOGY (USD BILLION) 2020-2029
TABLE 72 SOUTH-EAST ASIA HYDROGEN GENERATION MARKET BY DELIVERY MODE (USD BILLION) 2020-2029
TABLE 73 REST OF ASIA PACIFIC HYDROGEN GENERATION MARKET BY SOURCE (USD BILLION) 2020-2029
TABLE 74 REST OF ASIA PACIFIC HYDROGEN GENERATION MARKET BY APPLICATION (USD BILLION) 2020-2029
TABLE 75 REST OF ASIA PACIFIC HYDROGEN GENERATION MARKET BY TECHNOLOGY (USD BILLION) 2020-2029
TABLE 76 REST OF ASIA PACIFIC HYDROGEN GENERATION MARKET BY DELIVERY MODE (USD BILLION) 2020-2029
TABLE 77 EUROPE HYDROGEN GENERATION MARKET BY COUNTRY (USD BILLION), 2020-2029
TABLE 78 EUROPE HYDROGEN GENERATION MARKET BY SOURCE (USD BILLION) 2020-2029
TABLE 79 EUROPE HYDROGEN GENERATION MARKET BY APPLICATION (USD BILLION) 2020-2029
TABLE 80 EUROPE HYDROGEN GENERATION MARKET BY TECHNOLOGY (USD BILLION) 2020-2029
TABLE 81 EUROPE HYDROGEN GENERATION MARKET BY DELIVERY MODE (USD BILLION) 2020-2029
TABLE 82 GERMANY HYDROGEN GENERATION MARKET BY SOURCE (USD BILLION) 2020-2029
TABLE 83 GERMANY HYDROGEN GENERATION MARKET BY APPLICATION (USD BILLION) 2020-2029
TABLE 84 GERMANY HYDROGEN GENERATION MARKET BY TECHNOLOGY (USD BILLION) 2020-2029
TABLE 85 GERMANY HYDROGEN GENERATION MARKET BY DELIVERY MODE (USD BILLION) 2020-2029
TABLE 86 UK HYDROGEN GENERATION MARKET BY SOURCE (USD BILLION) 2020-2029
TABLE 87 UK HYDROGEN GENERATION MARKET BY APPLICATION (USD BILLION) 2020-2029
TABLE 88 UK HYDROGEN GENERATION MARKET BY TECHNOLOGY (USD BILLION) 2020-2029
TABLE 89 UK HYDROGEN GENERATION MARKET BY DELIVERY MODE (USD BILLION) 2020-2029
TABLE 90 FRANCE HYDROGEN GENERATION MARKET BY SOURCE (USD BILLION) 2020-2029
TABLE 91 FRANCE HYDROGEN GENERATION MARKET BY APPLICATION (USD BILLION) 2020-2029
TABLE 92 FRANCE HYDROGEN GENERATION MARKET BY TECHNOLOGY (USD BILLION) 2020-2029
TABLE 93 FRANCE HYDROGEN GENERATION MARKET BY DELIVERY MODE (USD BILLION) 2020-2029
TABLE 94 ITALY HYDROGEN GENERATION MARKET BY SOURCE (USD BILLION) 2020-2029
TABLE 95 ITALY HYDROGEN GENERATION MARKET BY APPLICATION (USD BILLION) 2020-2029
TABLE 96 ITALY HYDROGEN GENERATION MARKET BY TECHNOLOGY (USD BILLION) 2020-2029
TABLE 97 ITALY HYDROGEN GENERATION MARKET BY DELIVERY MODE (USD BILLION) 2020-2029
TABLE 98 SPAIN HYDROGEN GENERATION MARKET BY SOURCE (USD BILLION) 2020-2029
TABLE 99 SPAIN HYDROGEN GENERATION MARKET BY APPLICATION (USD BILLION) 2020-2029
TABLE 100 SPAIN HYDROGEN GENERATION MARKET BY TECHNOLOGY (USD BILLION) 2020-2029
TABLE 101 SPAIN HYDROGEN GENERATION MARKET BY DELIVERY MODE (USD BILLION) 2020-2029
TABLE 102 RUSSIA HYDROGEN GENERATION MARKET BY SOURCE (USD BILLION) 2020-2029
TABLE 103 RUSSIA HYDROGEN GENERATION MARKET BY APPLICATION (USD BILLION) 2020-2029
TABLE 104 RUSSIA HYDROGEN GENERATION MARKET BY TECHNOLOGY (USD BILLION) 2020-2029
TABLE 105 RUSSIA HYDROGEN GENERATION MARKET BY DELIVERY MODE (USD BILLION) 2020-2029
TABLE 106 REST OF EUROPE HYDROGEN GENERATION MARKET BY SOURCE (USD BILLION) 2020-2029
TABLE 107 REST OF EUROPE HYDROGEN GENERATION MARKET BY APPLICATION (USD BILLION) 2020-2029
TABLE 108 REST OF EUROPE HYDROGEN GENERATION MARKET BY TECHNOLOGY (USD BILLION) 2020-2029
TABLE 109 REST OF EUROPE HYDROGEN GENERATION MARKET BY DELIVERY MODE (USD BILLION) 2020-2029
TABLE 110 MIDDLE EAST AND AFRICA HYDROGEN GENERATION MARKET BY COUNTRY (USD BILLION) 2020-2029
TABLE 111 MIDDLE EAST AND AFRICA HYDROGEN GENERATION MARKET BY SOURCE (USD BILLION) 2020-2029
TABLE 112 MIDDLE EAST AND AFRICA HYDROGEN GENERATION MARKET BY APPLICATION (USD BILLION) 2020-2029
TABLE 113 MIDDLE EAST AND AFRICA HYDROGEN GENERATION MARKET BY TECHNOLOGY (USD BILLION) 2020-2029
TABLE 114 MIDDLE EAST AND AFRICA HYDROGEN GENERATION MARKET BY DELIVERY MODE (USD BILLION) 2020-2029
TABLE 115 SAUDI ARABIA HYDROGEN GENERATION MARKET BY SOURCE (USD BILLION) 2020-2029
TABLE 116 SAUDI ARABIA HYDROGEN GENERATION MARKET BY APPLICATION (USD BILLION) 2020-2029
TABLE 117 SAUDI ARABIA HYDROGEN GENERATION MARKET BY TECHNOLOGY (USD BILLION) 2020-2029
TABLE 118 SAUDI ARABIA HYDROGEN GENERATION MARKET BY DELIVERY MODE (USD BILLION) 2020-2029
TABLE 119 SOUTH AFRICA HYDROGEN GENERATION MARKET BY SOURCE (USD BILLION) 2020-2029
TABLE 120 SOUTH AFRICA HYDROGEN GENERATION MARKET BY APPLICATION (USD BILLION) 2020-2029
TABLE 121 SOUTH AFRICA HYDROGEN GENERATION MARKET BY TECHNOLOGY (USD BILLION) 2020-2029
TABLE 122 SOUTH AFRICA HYDROGEN GENERATION MARKET BY DELIVERY MODE (USD BILLION) 2020-2029
TABLE 123 REST OF MIDDLE EAST AND AFRICA HYDROGEN GENERATION MARKET BY SOURCE (USD BILLION) 2020-2029
TABLE 124 REST OF MIDDLE EAST AND AFRICA HYDROGEN GENERATION MARKET BY APPLICATION (USD BILLION) 2020-2029
TABLE 125 REST OF MIDDLE EAST AND AFRICA HYDROGEN GENERATION MARKET BY TECHNOLOGY (USD BILLION) 2020-2029
TABLE 126 REST OF MIDDLE EAST AND AFRICA HYDROGEN GENERATION MARKET BY INDUSTRY (USD BILLION) 2020-2029
LIST OF FIGURES
FIGURE 1 MARKET DYNAMICS
FIGURE 2 MARKET SEGMENTATION
FIGURE 3 REPORT TIMELINES: YEARS CONSIDERED
FIGURE 4 DATA TRIANGULATION
FIGURE 5 BOTTOM-UP APPROACH
FIGURE 6 TOP-DOWN APPROACH
FIGURE 7 RESEARCH FLOW
FIGURE 8 GLOBAL HYDROGEN GENERATION MARKET BY SOURCE, USD BILLION, 2020-2029
FIGURE 9 GLOBAL HYDROGEN GENERATION MARKET BY DELIVERY MODE, USD BILLION, 2020-2029
FIGURE 10 GLOBAL HYDROGEN GENERATION MARKET BY APPLICATION, USD BILLION, 2020-2029
FIGURE 11 GLOBAL HYDROGEN GENERATION MARKET BY TECHNOLOGY, USD BILLION, 2020-2029
FIGURE 12 GLOBAL HYDROGEN GENERATION MARKET BY REGION, USD BILLION, 2020-2029
FIGURE 13 PORTER’S FIVE FORCES MODEL
FIGURE 14 GLOBAL HYDROGEN GENERATION MARKET BY SOURCE, 2021
FIGURE 15 GLOBAL HYDROGEN GENERATION MARKET BY DELIVERY MODE, 2021
FIGURE 16 GLOBAL HYDROGEN GENERATION MARKET BY APPLICATION, 2021
FIGURE 17 GLOBAL HYDROGEN GENERATION MARKET BY TECHNOLOGY, 2021
FIGURE 18 HYDROGEN GENERATION MARKET BY REGION, 2021
FIGURE 19 MARKET SHARE ANALYSIS
FIGURE 20 LINDE PLC: COMPANY SNAPSHOT
FIGURE 21 AIR LIQUIDE: COMPANY SNAPSHOT
FIGURE 22 CUMMINS INC.: COMPANY SNAPSHOT
FIGURE 23 AIR PRODUCTS INC.: COMPANY SNAPSHOT
FIGURE 24 ENGIE: COMPANY SNAPSHOT
FIGURE 25 SIEMENS: COMPANY SNAPSHOT
FIGURE 26 ITM POWER: COMPANY SNAPSHOT
FIGURE 27 MCPHY ENERGY S.A.: COMPANY SNAPSHOT
FIGURE 28 MESSER: COMPANY SNAPSHOT
FIGURE 29 ENAPTER S.R.L.: COMPANY SNAPSHOT
FIGURE 30 IWATANI CORPORATION: COMPANY SNAPSHOT
FIGURE 31 XEBEC ADSORPTION INC.: COMPANY SNAPSHOT
FIGURE 32 GREEN HYDROGEN: COMPANY SNAPSHOT
FIGURE 33 PLUG POWER INC.: COMPANY SNAPSHO
DOWNLOAD FREE SAMPLE REPORT
License Type
SPEAK WITH OUR ANALYST
Want to know more about the report or any specific requirement?
WANT TO CUSTOMIZE THE REPORT?
Our Clients Speak
We asked them to research ‘ Equipment market’ all over the world, and their whole arrangement was helpful to us. thehealthanalytics.com insightful analysis and reports contributed to our current analysis and in creating a future strategy. Besides, the te
Yosuke Mitsui
Senior Associate Construction Equipment Sales & Marketing
We asked them to research ‘Equipment market’ all over the world, and their whole arrangement was helpful to us. thehealthanalytics.com insightful analysis and reports contributed to our current analysis and in creating a future strategy. Besides, the te


