

Base Year Value ()
x.x %
x.x %
CAGR ()
x.x %
x.x %
Forecast Year Value ()
x.x %
x.x %
Historical Data Period
Largest Region
Forecast Period
Mercado mundial de medicamentos de inmunoterapia por tipo (anticuerpos monoclonales, inmunomoduladores, interleucinas, vacunas), por área terapéutica (cáncer, enfermedad autoinmune, enfermedad inflamatoria, enfermedad infecciosa), por usuario final (hospital, clínica) y por región, tendencias globales y pronóstico de 2022 a 2029.
Instant access to hundreds of data points and trends
- Market estimates from 2014-2029
- Competitive analysis, industry segmentation, financial benchmarks
- Incorporates SWOT, Porter's Five Forces and risk management frameworks
- PDF report or online database with Word, Excel and PowerPoint export options
- 100% money back guarantee
Panorama del mercado mundial de medicamentos de inmunoterapia
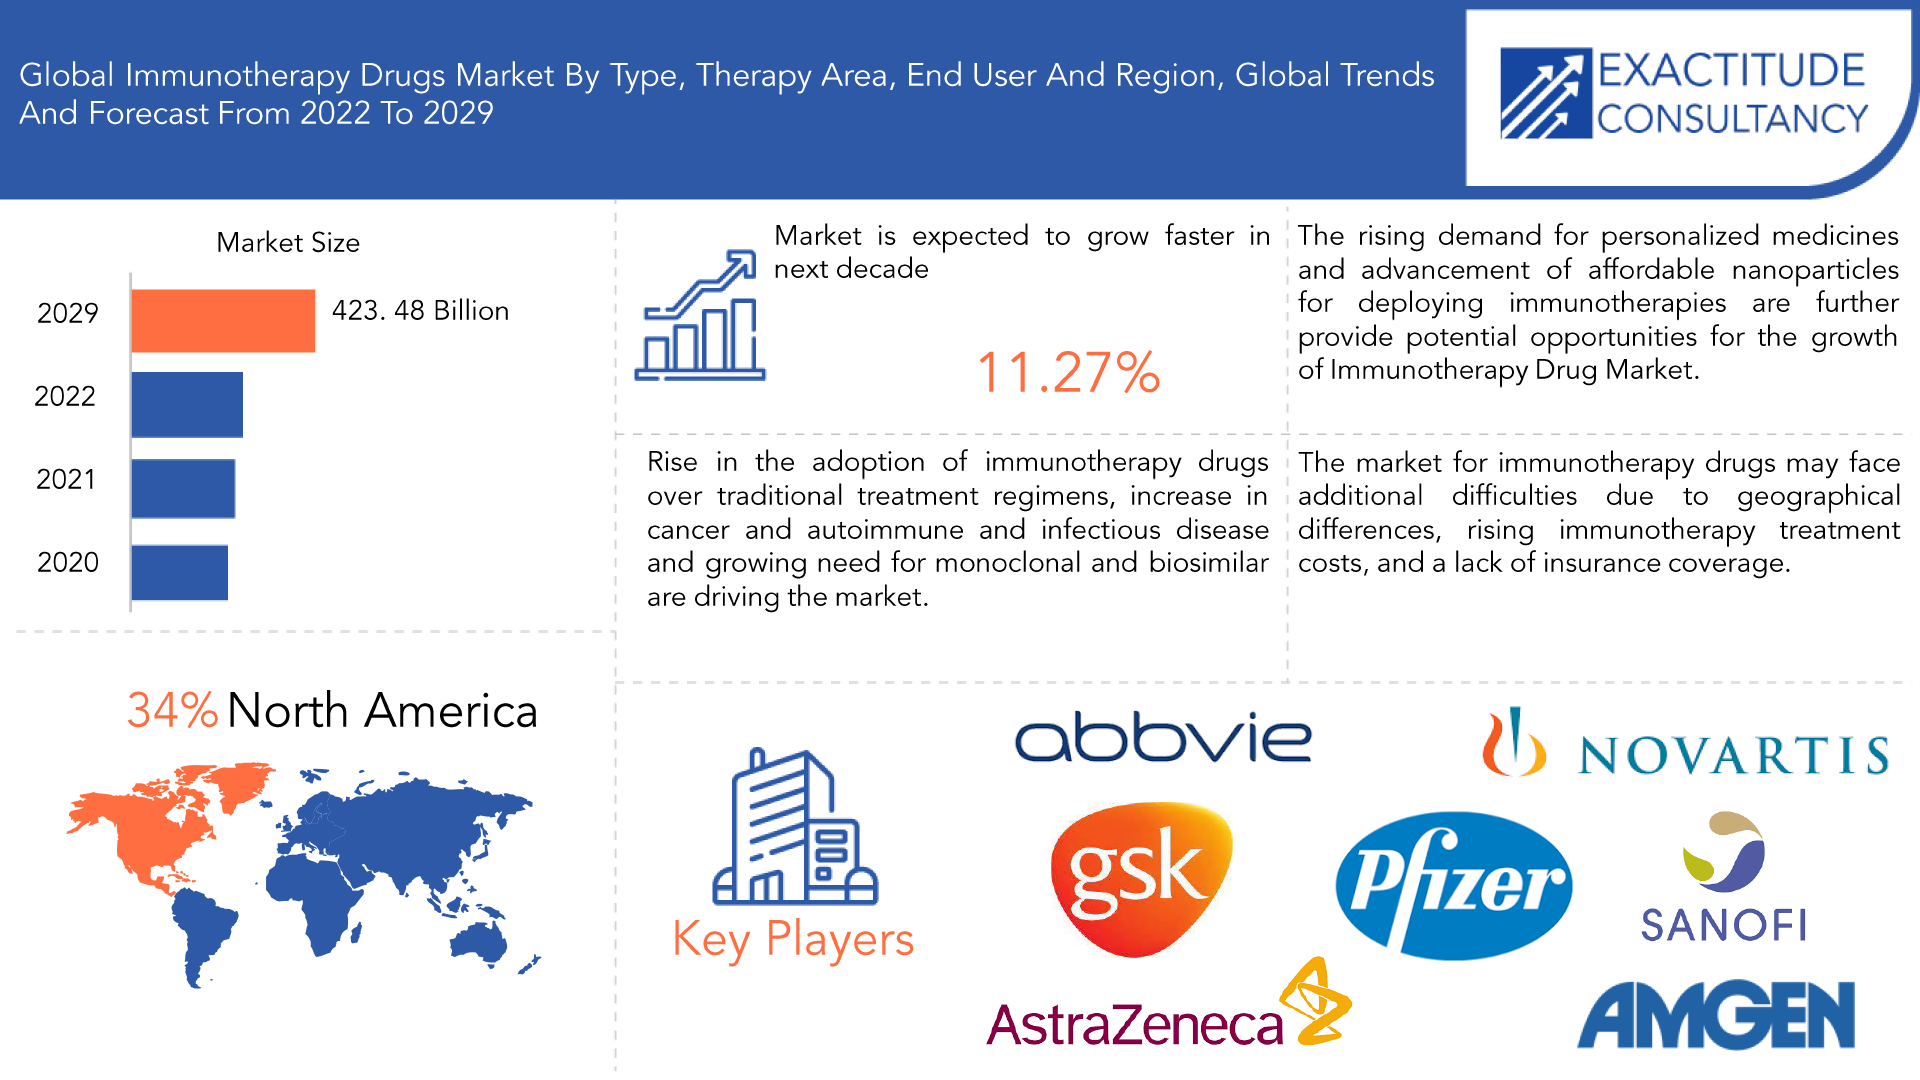
Se espera que el tamaño del mercado mundial de medicamentos de inmunoterapia crezca a una tasa compuesta anual de más del 11,27 % entre 2021 y 2029. Se espera que alcance más de 423 480 millones de dólares en 2029 desde un poco más de 161 970 millones de dólares en 2020.
Los medicamentos que se utilizan en inmunoterapia se utilizan para fortalecer o debilitar el sistema inmunológico del cuerpo. Combaten principalmente el cáncer al reforzar el sistema inmunológico y provocar una reacción inmunológica que promueve la producción de anticuerpos. Las células malignas o tumorales son destruidas por los anticuerpos que se producen en respuesta a un antígeno. El crecimiento de los ingresos del mercado se debe principalmente a un aumento en el número de resultados exitosos de Investigación y Desarrollo (I+D) en el campo de la inmunoterapia utilizada para tratar el cáncer, las enfermedades autoinmunes, las enfermedades neurodegenerativas, los adenocarcinomas, las enfermedades cardiovasculares y otras enfermedades, así como a la creciente adopción de terapias dirigidas en lugar de terapias tradicionales y un aumento en la prevalencia de enfermedades crónicas y trastornos del estilo de vida. La inmunoterapia es una forma de terapia biológica que se utiliza para tratar a pacientes con cáncer. Funciona mejorando la capacidad del sistema inmunológico del paciente para encontrar y destruir células cancerosas dentro del cuerpo.
| ATRIBUTO | DETALLES |
| Periodo de estudio | 2020-2029 |
| Año base | 2021 |
| Año estimado | 2022 |
| Año pronosticado | 2022-2029 |
| Periodo histórico | 2018-2020 |
| Unidad | Valor (miles de millones de USD), (Miles de unidades) |
| Segmentación | Por tipo, por área de terapia, por usuario final, por región |
| Por tipo |
|
| Por área de terapia |
|
| Por el usuario final |
|
| Por región |
|
Las inmunoterapias que se centran en la inmunomodulación, la neutralización viral pasiva y la neutralización de citocinas inflamatorias pueden reducir la carga viral, prevenir el ingreso en la UCI y reducir el daño pulmonar relacionado con la inflamación, al tiempo que reducen la inflamación en sí misma. Esto ayudará a que el mercado se expanda más rápidamente. Debido a que permiten el desarrollo de anticuerpos que se dirigen específicamente a un antígeno tumoral en particular, los anticuerpos monoclonales son ventajosos. Los anticuerpos se pueden producir en grandes cantidades utilizando métodos in vitro en el laboratorio. Otro factor que apoyará la expansión del mercado es la necesidad de biosimilares en el tratamiento del cáncer. Además, el crecimiento futuro del mercado de productos farmacéuticos de inmunoterapia puede verse influenciado por el creciente deseo de tratamientos personalizados y el desarrollo de nanopartículas más accesibles para inmunoterapias.
La COVID-19 tuvo un impacto positivo significativo en el mercado de medicamentos de inmunoterapia. La participación de mercado de los medicamentos de inmunoterapia aumentó como resultado de la COVID-19. El impacto de la COVID-19 en la industria de los tratamientos de inmunoterapia es favorable debido al hecho de que varias empresas están trabajando activamente en el desarrollo de medicamentos o vacunas basados en inmunoterapia para la COVID-19. En colaboración con Pfizer Inc., BioNTech SE está llevando a cabo actualmente una investigación clínica de fase III en voluntarios sanos para evaluar la seguridad, la tolerabilidad y la inmunogenicidad de BNT162b2 contra la COVID-19.
[título id="attachment_15053" align="aligncenter" width="1920"]
Frequently Asked Questions
• Who are the key players in the global immunotherapy drugs market?
Some key players operating in the global immunotherapy drugs market include Amgen Inc., Novartis AG, AbbVie Inc., Pfizer Inc., Nextera AS, Johnson & Johnson Services Inc., AstraZeneca, GSK, Sanofi, Biomunex Pharmaceuticals.
• What are the factors driving the global immunotherapy drugs market?
The market's revenue growth is primarily being driven by an increase in the number of successful Research & Development (R&D) outcomes in the field of immunotherapy used to treat cancer, autoimmune diseases, neurodegenerative diseases, adenocarcinomas, cardiovascular diseases, and other diseases, as well as rising adoption of targeted therapy over traditional therapy and an increase in the prevalence of chronic diseases and lifestyle disorders.
• How big is the global immunotherapy drugs market?
The global Immunotherapy Drugs market size was estimated at USD 161.97 billion in 2021 and is expected to reach USD 423.48 billion in 2029.
• What is the global immunotherapy drugs market growth?
The global immunotherapy drugs market is expected to grow at a compound annual growth rate of 11.27 % from 2022 to 2029 to reach USD 423.48 billion by 2029.
• Which region accounted for the largest global immunotherapy drugs market share?
The North America dominated the global immunotherapy drugs market with a share of 34% in 2021.
Global Immunotherapy Drugs Market Segment Analysis
Based on the type, market is segmented into monoclonal antibodies, immunomodulators, interlukins, vaccines. The monoclonal antibodies segment account for the maximum share of market revenue due to its improved implementation in cancer immunotherapy. It frequently has fewer side effects than other cancer treatments and helps the immune system fight cancer. Revenue growth in this market is being driven by immunomodulators' notable accuracy in preventing cancer when compared to other techniques. These are substances that either stimulate newly developed immune responses or boost already existing ones in order to identify and eradicate cancer cells.
Based on the therapy area, market is segmented into cancer, autoimmune disease, inflammatory disease, infectious disease. Cancer treatment accounted for largest use of immunotherapy drugs. One of the main factors influencing this segment's revenue growth is the rising incidence of cancer around the world, which is being accompanied by a shift away from chemotherapy due to its adverse effects. An enormous increase in the quantity of successful R&D (Research and Development) efforts is being caused by the rising prevalence of autoimmune illnesses.
By end user, market is segmented into hospital and clinic. Hospitals account for the major share for the use of immunotherapy drugs.
[caption id="attachment_15054" align="aligncenter" width="1920"]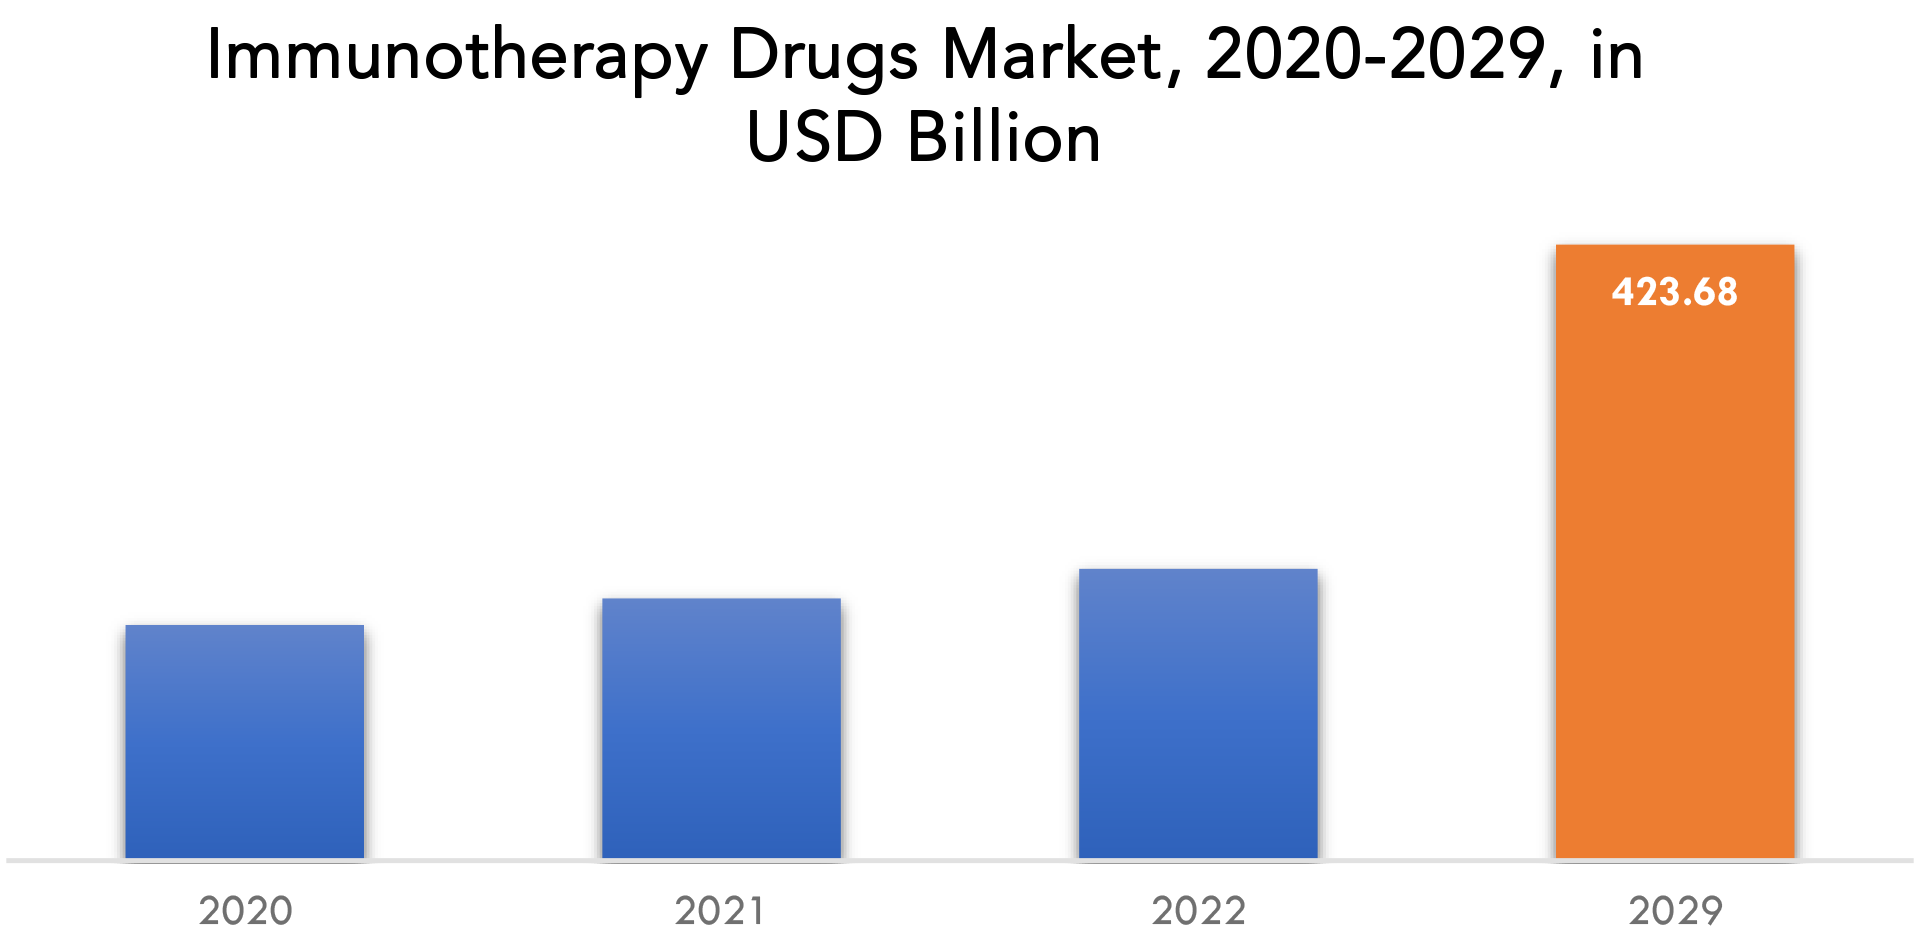
Global Immunotherapy Drugs Market Players
Key competitors from both domestic and international markets compete fiercely in the worldwide global Immunotherapy Drugs industry include Amgen Inc., Novartis AG, AbbVie Inc., Pfizer Inc., Nextera AS, Johnson & Johnson Services Inc., AstraZeneca, GSK, Sanofi, Biomunex Pharmaceuticals. Recent News:- 20th March 2022: Nextera AS strategically collaborated with Zelluna Immunotherapy AS for the development of optimized TCRs for cancer immunotherapy.
- February 2022: Biomunex Pharmaceuticals collaborated with Institut Curie to develop an immunotherapy drug candidate to treat hematological malignancies using Biomunex’ BiXAR technology.
Who Should Buy? Or Key stakeholders
- Immunotherapy Drugs Providers
- Research and Development Organizations
- Regulatory Agencies
- Specialties Pharmacy
- Cancer Clinics
- Pharmaceutical Manufactures
- Investors
- Others
Global Immunotherapy Drugs Market Regional Analysis
The Global Immunotherapy Drugs Market by region includes North America, Asia-Pacific (APAC), Europe, South America, and Middle East & Africa (MEA).
- North America: includes the US, Canada, Mexico
- Asia Pacific: includes China, Japan, South Korea, India, Australia, ASEAN and Rest of APAC
- Europe: includes UK, Germany, France, Italy, Spain, Russia, and Rest of Europe
- South America: includes Brazil, Argentina and Rest of South America
- Middle East & Africa: includes Turkey, UAE, Saudi Arabia, South Africa, and Rest of MEA
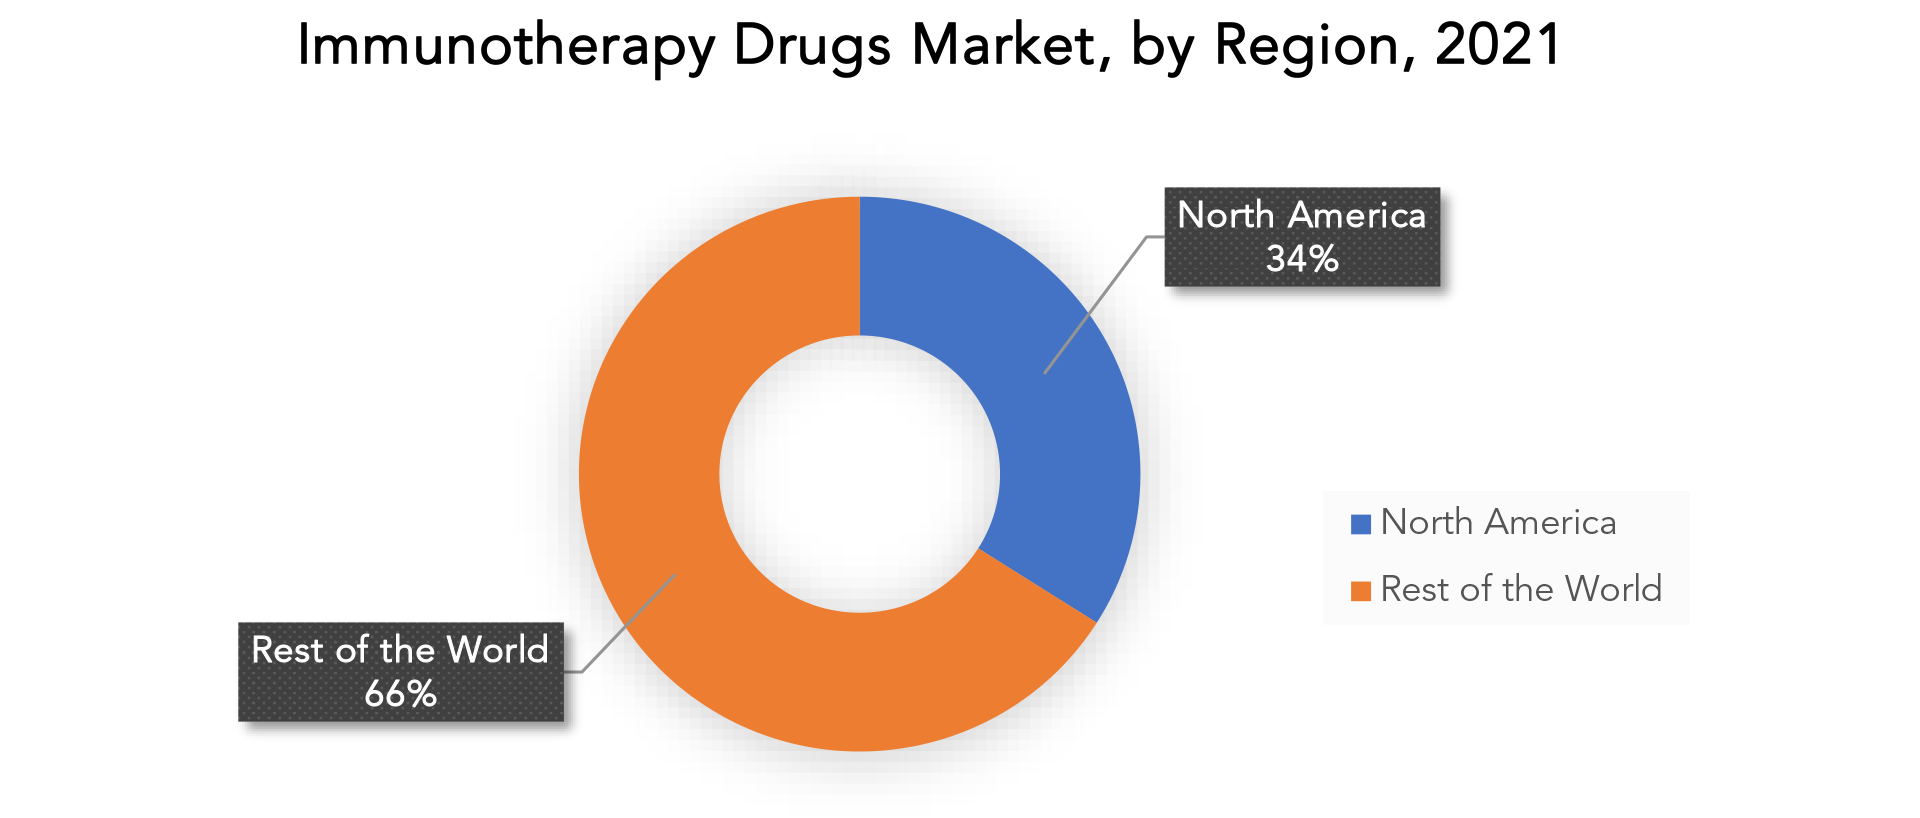
Due to an increase in FDA approvals, North America currently holds a monopoly on the market for immunotherapy medications. Additionally, throughout the projected period, the prevalence of autoimmune disorders and cancer will increase, which will further support the expansion of the market for immunotherapy drugs in the area. Due to the rising costs of building a healthcare infrastructure, the immunotherapy medicine market in Asia-Pacific is expected to grow significantly throughout this period. Furthermore, it is projected that in the upcoming years, the market for immunotherapy medications in the region will rise significantly due to the large patient pool and rising cancer incidence.
Key Market Segments: Global Immunotherapy Drugs Market
Global Immunotherapy Drugs Market By Type, 2020-2029, (USD Billion), (Thousand Units)- Monoclonal Antibodies
- Immunomodulators
- Interlukins
- Vaccines
- Cancer
- Autoimmune Disease
- Inflammatory Disease
- Infectious Disease
- Hospital
- Clinic
- North America
- Europe
- Asia Pacific
- South America
- Middle East And Africa
Exactitude Consultancy Services Key Objectives
- Increasing sales and market share
- Developing new technology
- Improving profitability
- Entering new market
- Enhancing brand reputation
Key Question Answered
- What is the expected growth rate of the immunotherapy drugs market over the next 7 years?
- Who are the major players in the immunotherapy drugs market and what is their market share?
- What are the end-user industries driving demand for market and what is their outlook?
- What are the opportunities for growth in emerging markets such as Asia-Pacific, Middle East, and Africa?
- How is the economic environment affecting the immunotherapy drugs market, including factors such as interest rates, inflation, and exchange rates?
- What is the expected impact of government policies and regulations on the immunotherapy drugs market?
- What is the current and forecasted size and growth rate of the global immunotherapy drugs market?
- What are the key drivers of growth in the immunotherapy drugs market?
- What are the distribution channels and supply chain dynamics in the immunotherapy drugs market?
- What are the technological advancements and innovations in the immunotherapy drugs market and their impact on product development and growth?
- What are the regulatory considerations and their impact on the market?
- What are the challenges faced by players in the immunotherapy drugs market and how are they addressing these challenges?
- What are the opportunities for growth and expansion in the immunotherapy drugs market?
- What are the product offerings and specifications of leading players in the market?
- What is the pricing trend of immunotherapy drugs’ in the market and what is the impact of raw material prices on the price trend?
- INTRODUCCIÓN
- DEFINICIÓN DE MERCADO
- SEGMENTACIÓN DEL MERCADO
- CRONOGRAMAS DE INVESTIGACIÓN
- SUPUESTOS Y LIMITACIONES
- METODOLOGÍA DE LA INVESTIGACIÓN
- MINERÍA DE DATOS
- INVESTIGACIÓN SECUNDARIA
- INVESTIGACIÓN PRIMARIA
- ASESORAMIENTO DE EXPERTOS EN LA MATERIA
- CONTROLES DE CALIDAD
- REVISIÓN FINAL
- TRIANGULACIÓN DE DATOS
- ENFOQUE DE ABAJO HACIA ARRIBA
- ENFOQUE DE ARRIBA HACIA ABAJO
- FLUJO DE INVESTIGACIÓN
- FUENTES DE DATOS
- MINERÍA DE DATOS
- RESUMEN EJECUTIVO
- PANORAMA DEL MERCADO
- PERSPECTIVAS DEL MERCADO MUNDIAL DE FÁRMACOS DE INMUNOTERAPIA
- IMPULSORES DEL MERCADO
- RESTRICCIONES DEL MERCADO
- OPORTUNIDADES DE MERCADO
- IMPACTO DEL COVID-19 EN EL MERCADO DE MEDICAMENTOS DE INMUNOTERAPIA
- MODELO DE LAS CINCO FUERZAS DE PORTER
- AMENAZA DE NUEVOS INGRESANTES
- AMENAZA DE SUSTITUTOS
- PODER DE NEGOCIACIÓN DE LOS PROVEEDORES
- PODER DE NEGOCIACIÓN DE LOS CLIENTES
- GRADO DE COMPETENCIA
- ANÁLISIS DE LA CADENA DE VALOR DE LA INDUSTRIA
- PERSPECTIVAS DEL MERCADO MUNDIAL DE FÁRMACOS DE INMUNOTERAPIA
- MERCADO MUNDIAL DE FÁRMACOS DE INMUNOTERAPIA POR TIPO, 2020-2029, (MIL MILLONES DE USD), (MILES DE UNIDADES)
- ANTICUERPOS MONOCLONALES
- INMUNOMODULADORES
- INTERLUKINS
- VACUNAS
- MERCADO MUNDIAL DE FÁRMACOS DE INMUNOTERAPIA POR ÁREA TERAPÉUTICA, 2020-2029, (MILES DE MILLONES DE USD), (MILES DE UNIDADES)
- CÁNCER
- ENFERMEDAD AUTOINMUNE
- ENFERMEDAD INFLAMATORIA
- ENFERMEDAD INFECCIOSA
- MERCADO MUNDIAL DE FÁRMACOS DE INMUNOTERAPIA POR USUARIO FINAL, 2020-2029, (MILES DE MILLONES DE USD), (MILES DE UNIDADES)
- HOSPITAL
- CLÍNICA
- MERCADO MUNDIAL DE FÁRMACOS DE INMUNOTERAPIA POR REGIÓN, 2020-2029, (MIL MILLONES DE USD), (MILES DE UNIDADES)
- AMÉRICA DEL NORTE
- A NOSOTROS
- CANADÁ
- MÉXICO
- SUDAMERICA
- BRASIL
- ARGENTINA
- COLOMBIA
- RESTO DE SUDAMÉRICA
- EUROPA
- ALEMANIA
- Reino Unido
- FRANCIA
- ITALIA
- ESPAÑA
- RUSIA
- RESTO DE EUROPA
- ASIA PACÍFICO
- INDIA
- PORCELANA
- JAPÓN
- COREA DEL SUR
- AUSTRALIA
- ASIA SUDESTE
- RESTO DE ASIA PACÍFICO
- ORIENTE MEDIO Y ÁFRICA
- Emiratos Árabes Unidos
- ARABIA SAUDITA
- SUDÁFRICA
- REST OF MIDDLE EAST AND AFRICA
- AMÉRICA DEL NORTE
9. COMPANY PROFILES* (BUSINESS OVERVIEW, COMPANY SNAPSHOT, PRODUCTS OFFERED, RECENT DEVELOPMENTS)
- AMGEN INC.
- NOVARTIS AG
- ABBVIE INC.
- PFIZER INC.
- NEXTERA AS
- JOHNSON & JOHNSON SERVICES INC.
- ASTRAZENECA
- GSK
- SANOFI
- BIOMUNEX PHARMACEUTICALS *THE COMPANY LIST IS INDICATIVE
LIST OF TABLES
TABLE 1 GLOBAL IMMUNOTHERAPY DRUGS MARKET BY TYPE (USD BILLION) 2020-2029
TABLE 2 GLOBAL IMMUNOTHERAPY DRUGS MARKET BY TYPE (THOUSAND UNITS) 2020-2029
TABLE 3 GLOBAL IMMUNOTHERAPY DRUGS MARKET BY THERAPY AREA (USD BILLION) 2020-2029
TABLE 4 GLOBAL IMMUNOTHERAPY DRUGS MARKET BY THERAPY AREA (THOUSAND UNITS) 2020-2029
TABLE 5 GLOBAL IMMUNOTHERAPY DRUGS MARKET BY END USER (USD BILLION) 2020-2029
TABLE 6 GLOBAL IMMUNOTHERAPY DRUGS MARKET BY END USER (THOUSAND UNITS) 2020-2029
TABLE 7 GLOBAL IMMUNOTHERAPY DRUGS MARKET BY REGION (USD BILLION) 2020-2029
TABLE 8 GLOBAL IMMUNOTHERAPY DRUGS MARKET BY REGION (THOUSAND UNITS) 2020-2029
TABLE 9 NORTH AMERICA IMMUNOTHERAPY DRUGS MARKET BY COUNTRY (USD BILLION) 2020-2029
TABLE 10 NORTH AMERICA IMMUNOTHERAPY DRUGS MARKET BY COUNTRY (THOUSAND UNITS) 2020-2029
TABLE 11 NORTH AMERICA IMMUNOTHERAPY DRUGS MARKET BY TYPE (USD BILLION) 2020-2029
TABLE 12 NORTH AMERICA IMMUNOTHERAPY DRUGS MARKET BY TYPE (THOUSAND UNITS) 2020-2029
TABLE 13 NORTH AMERICA IMMUNOTHERAPY DRUGS MARKET BY THERAPY AREA (USD BILLION) 2020-2029
TABLE 14 NORTH AMERICA IMMUNOTHERAPY DRUGS MARKET BY THERAPY AREA (THOUSAND UNITS) 2020-2029
TABLE 15 NORTH AMERICA IMMUNOTHERAPY DRUGS MARKET BY END USER (USD BILLION) 2020-2029
TABLE 16 NORTH AMERICA IMMUNOTHERAPY DRUGS MARKET BY END USER (THOUSAND UNITS) 2020-2029
TABLE 17 US IMMUNOTHERAPY DRUGS MARKET BY TYPE (USD BILLION) 2020-2029
TABLE 18 US IMMUNOTHERAPY DRUGS MARKET BY TYPE (THOUSAND UNITS) 2020-2029
TABLE 19 US IMMUNOTHERAPY DRUGS MARKET BY THERAPY AREA (USD BILLION) 2020-2029
TABLE 20 US IMMUNOTHERAPY DRUGS MARKET BY THERAPY AREA (THOUSAND UNITS) 2020-2029
TABLE 21 US IMMUNOTHERAPY DRUGS MARKET BY END USER (USD BILLION) 2020-2029
TABLE 22 US IMMUNOTHERAPY DRUGS MARKET BY END USER (THOUSAND UNITS) 2020-2029
TABLE 23 CANADA IMMUNOTHERAPY DRUGS MARKET BY TYPE (USD BILLION) 2020-2029
TABLE 24 CANADA IMMUNOTHERAPY DRUGS MARKET BY TYPE (THOUSAND UNITS) 2020-2029
TABLE 25 CANADA IMMUNOTHERAPY DRUGS MARKET BY THERAPY AREA (USD BILLION) 2020-2029
TABLE 26 CANADA IMMUNOTHERAPY DRUGS MARKET BY THERAPY AREA (THOUSAND UNITS) 2020-2029
TABLE 27 CANADA IMMUNOTHERAPY DRUGS MARKET BY END USER (USD BILLION) 2020-2029
TABLE 28 CANADA IMMUNOTHERAPY DRUGS MARKET BY END USER (THOUSAND UNITS) 2020-2029
TABLE 29 MEXICO IMMUNOTHERAPY DRUGS MARKET BY TYPE (USD BILLION) 2020-2029
TABLE 30 MEXICO IMMUNOTHERAPY DRUGS MARKET BY TYPE (THOUSAND UNITS) 2020-2029
TABLE 31 MEXICO IMMUNOTHERAPY DRUGS MARKET BY THERAPY AREA (USD BILLION) 2020-2029
TABLE 32 MEXICO IMMUNOTHERAPY DRUGS MARKET BY THERAPY AREA (THOUSAND UNITS) 2020-2029
TABLE 33 MEXICO IMMUNOTHERAPY DRUGS MARKET BY END USER (USD BILLION) 2020-2029
TABLE 34 MEXICO IMMUNOTHERAPY DRUGS MARKET BY END USER (THOUSAND UNITS) 2020-2029
TABLE 35 SOUTH AMERICA IMMUNOTHERAPY DRUGS MARKET BY COUNTRY (USD BILLION) 2020-2029
TABLE 36 SOUTH AMERICA IMMUNOTHERAPY DRUGS MARKET BY COUNTRY (THOUSAND UNITS) 2020-2029
TABLE 37 SOUTH AMERICA IMMUNOTHERAPY DRUGS MARKET BY TYPE (USD BILLION) 2020-2029
TABLE 38 SOUTH AMERICA IMMUNOTHERAPY DRUGS MARKET BY TYPE (THOUSAND UNITS) 2020-2029
TABLE 39 SOUTH AMERICA IMMUNOTHERAPY DRUGS MARKET BY THERAPY AREA (USD BILLION) 2020-2029
TABLE 40 SOUTH AMERICA IMMUNOTHERAPY DRUGS MARKET BY THERAPY AREA (THOUSAND UNITS) 2020-2029
TABLE 41 SOUTH AMERICA IMMUNOTHERAPY DRUGS MARKET BY END USER (USD BILLION) 2020-2029
TABLE 42 SOUTH AMERICA IMMUNOTHERAPY DRUGS MARKET BY END USER (THOUSAND UNITS) 2020-2029
TABLE 43 BRAZIL IMMUNOTHERAPY DRUGS MARKET BY TYPE (USD BILLION) 2020-2029
TABLE 44 BRAZIL IMMUNOTHERAPY DRUGS MARKET BY TYPE (THOUSAND UNITS) 2020-2029
TABLE 45 BRAZIL IMMUNOTHERAPY DRUGS MARKET BY THERAPY AREA (USD BILLION) 2020-2029
TABLE 46 BRAZIL IMMUNOTHERAPY DRUGS MARKET BY THERAPY AREA (THOUSAND UNITS) 2020-2029
TABLE 47 BRAZIL IMMUNOTHERAPY DRUGS MARKET BY END USER (USD BILLION) 2020-2029
TABLE 48 BRAZIL IMMUNOTHERAPY DRUGS MARKET BY END USER (THOUSAND UNITS) 2020-2029
TABLE 49 ARGENTINA IMMUNOTHERAPY DRUGS MARKET BY TYPE (USD BILLION) 2020-2029
TABLE 50 ARGENTINA IMMUNOTHERAPY DRUGS MARKET BY TYPE (THOUSAND UNITS) 2020-2029
TABLE 51 ARGENTINA IMMUNOTHERAPY DRUGS MARKET BY THERAPY AREA (USD BILLION) 2020-2029
TABLE 52 ARGENTINA IMMUNOTHERAPY DRUGS MARKET BY THERAPY AREA (THOUSAND UNITS) 2020-2029
TABLE 53 ARGENTINA IMMUNOTHERAPY DRUGS MARKET BY END USER (USD BILLION) 2020-2029
TABLE 54 ARGENTINA IMMUNOTHERAPY DRUGS MARKET BY END USER (THOUSAND UNITS) 2020-2029
TABLE 55 COLOMBIA IMMUNOTHERAPY DRUGS MARKET BY TYPE (USD BILLION) 2020-2029
TABLE 56 COLOMBIA IMMUNOTHERAPY DRUGS MARKET BY TYPE (THOUSAND UNITS) 2020-2029
TABLE 57 COLOMBIA IMMUNOTHERAPY DRUGS MARKET BY THERAPY AREA (USD BILLION) 2020-2029
TABLE 58 COLOMBIA IMMUNOTHERAPY DRUGS MARKET BY THERAPY AREA (THOUSAND UNITS) 2020-2029
TABLE 59 COLOMBIA IMMUNOTHERAPY DRUGS MARKET BY END USER (USD BILLION) 2020-2029
TABLE 60 COLOMBIA IMMUNOTHERAPY DRUGS MARKET BY END USER (THOUSAND UNITS) 2020-2029
TABLE 61 REST OF SOUTH AMERICA IMMUNOTHERAPY DRUGS MARKET BY TYPE (USD BILLION) 2020-2029
TABLE 62 REST OF SOUTH AMERICA IMMUNOTHERAPY DRUGS MARKET BY TYPE (THOUSAND UNITS) 2020-2029
TABLE 63 REST OF SOUTH AMERICA IMMUNOTHERAPY DRUGS MARKET BY THERAPY AREA (USD BILLION) 2020-2029
TABLE 64 REST OF SOUTH AMERICA IMMUNOTHERAPY DRUGS MARKET BY THERAPY AREA (THOUSAND UNITS) 2020-2029
TABLE 65 REST OF SOUTH AMERICA IMMUNOTHERAPY DRUGS MARKET BY END USER (USD BILLION) 2020-2029
TABLE 66 REST OF SOUTH AMERICA IMMUNOTHERAPY DRUGS MARKET BY END USER (THOUSAND UNITS) 2020-2029
TABLE 67 ASIA-PACIFIC IMMUNOTHERAPY DRUGS MARKET BY COUNTRY (USD BILLION) 2020-2029
TABLE 68 ASIA-PACIFIC IMMUNOTHERAPY DRUGS MARKET BY COUNTRY (THOUSAND UNITS) 2020-2029
TABLE 69 ASIA-PACIFIC IMMUNOTHERAPY DRUGS MARKET BY TYPE (USD BILLION) 2020-2029
TABLE 70 ASIA-PACIFIC IMMUNOTHERAPY DRUGS MARKET BY TYPE (THOUSAND UNITS) 2020-2029
TABLE 71 ASIA-PACIFIC IMMUNOTHERAPY DRUGS MARKET BY THERAPY AREA (USD BILLION) 2020-2029
TABLE 72 ASIA-PACIFIC IMMUNOTHERAPY DRUGS MARKET BY THERAPY AREA (THOUSAND UNITS) 2020-2029
TABLE 73 ASIA-PACIFIC IMMUNOTHERAPY DRUGS MARKET BY END USER (USD BILLION) 2020-2029
TABLE 74 ASIA-PACIFIC IMMUNOTHERAPY DRUGS MARKET BY END USER (THOUSAND UNITS) 2020-2029
TABLE 75 INDIA IMMUNOTHERAPY DRUGS MARKET BY TYPE (USD BILLION) 2020-2029
TABLE 76 INDIA IMMUNOTHERAPY DRUGS MARKET BY TYPE (THOUSAND UNITS) 2020-2029
TABLE 77 INDIA IMMUNOTHERAPY DRUGS MARKET BY THERAPY AREA (USD BILLION) 2020-2029
TABLE 78 INDIA IMMUNOTHERAPY DRUGS MARKET BY THERAPY AREA (THOUSAND UNITS) 2020-2029
TABLE 79 INDIA IMMUNOTHERAPY DRUGS MARKET BY END USER (USD BILLION) 2020-2029
TABLE 80 INDIA IMMUNOTHERAPY DRUGS MARKET BY END USER (THOUSAND UNITS) 2020-2029
TABLE 81 CHINA IMMUNOTHERAPY DRUGS MARKET BY TYPE (USD BILLION) 2020-2029
TABLE 82 CHINA IMMUNOTHERAPY DRUGS MARKET BY TYPE (THOUSAND UNITS) 2020-2029
TABLE 83 CHINA IMMUNOTHERAPY DRUGS MARKET BY THERAPY AREA (USD BILLION) 2020-2029
TABLE 84 CHINA IMMUNOTHERAPY DRUGS MARKET BY THERAPY AREA (THOUSAND UNITS) 2020-2029
TABLE 85 CHINA IMMUNOTHERAPY DRUGS MARKET BY END USER (USD BILLION) 2020-2029
TABLE 86 CHINA IMMUNOTHERAPY DRUGS MARKET BY END USER (THOUSAND UNITS) 2020-2029
TABLE 87 JAPAN IMMUNOTHERAPY DRUGS MARKET BY TYPE (USD BILLION) 2020-2029
TABLE 88 JAPAN IMMUNOTHERAPY DRUGS MARKET BY TYPE (THOUSAND UNITS) 2020-2029
TABLE 89 JAPAN IMMUNOTHERAPY DRUGS MARKET BY THERAPY AREA (USD BILLION) 2020-2029
TABLE 90 JAPAN IMMUNOTHERAPY DRUGS MARKET BY THERAPY AREA (THOUSAND UNITS) 2020-2029
TABLE 91 JAPAN IMMUNOTHERAPY DRUGS MARKET BY END USER (USD BILLION) 2020-2029
TABLE 92 JAPAN IMMUNOTHERAPY DRUGS MARKET BY END USER (THOUSAND UNITS) 2020-2029
TABLE 93 SOUTH KOREA IMMUNOTHERAPY DRUGS MARKET BY TYPE (USD BILLION) 2020-2029
TABLE 94 SOUTH KOREA IMMUNOTHERAPY DRUGS MARKET BY TYPE (THOUSAND UNITS) 2020-2029
TABLE 95 SOUTH KOREA IMMUNOTHERAPY DRUGS MARKET BY THERAPY AREA (USD BILLION) 2020-2029
TABLE 96 SOUTH KOREA IMMUNOTHERAPY DRUGS MARKET BY THERAPY AREA (THOUSAND UNITS) 2020-2029
TABLE 97 SOUTH KOREA IMMUNOTHERAPY DRUGS MARKET BY END USER (USD BILLION) 2020-2029
TABLE 98 SOUTH KOREA IMMUNOTHERAPY DRUGS MARKET BY END USER (THOUSAND UNITS) 2020-2029
TABLE 99 AUSTRALIA IMMUNOTHERAPY DRUGS MARKET BY TYPE (USD BILLION) 2020-2029
TABLE 100 AUSTRALIA IMMUNOTHERAPY DRUGS MARKET BY TYPE (THOUSAND UNITS) 2020-2029
TABLE 101 AUSTRALIA IMMUNOTHERAPY DRUGS MARKET BY THERAPY AREA (USD BILLION) 2020-2029
TABLE 102 AUSTRALIA IMMUNOTHERAPY DRUGS MARKET BY THERAPY AREA (THOUSAND UNITS) 2020-2029
TABLE 103 AUSTRALIA IMMUNOTHERAPY DRUGS MARKET BY END USER (USD BILLION) 2020-2029
TABLE 104 AUSTRALIA IMMUNOTHERAPY DRUGS MARKET BY END USER (THOUSAND UNITS) 2020-2029
TABLE 105 SOUTH-EAST ASIA IMMUNOTHERAPY DRUGS MARKET BY TYPE (USD BILLION) 2020-2029
TABLE 106 SOUTH-EAST ASIA IMMUNOTHERAPY DRUGS MARKET BY TYPE (THOUSAND UNITS) 2020-2029
TABLE 107 SOUTH-EAST ASIA IMMUNOTHERAPY DRUGS MARKET BY THERAPY AREA (USD BILLION) 2020-2029
TABLE 108 SOUTH-EAST ASIA IMMUNOTHERAPY DRUGS MARKET BY THERAPY AREA (THOUSAND UNITS) 2020-2029
TABLE 109 SOUTH-EAST ASIA IMMUNOTHERAPY DRUGS MARKET BY END USER (USD BILLION) 2020-2029
TABLE 110 SOUTH-EAST ASIA IMMUNOTHERAPY DRUGS MARKET BY END USER (THOUSAND UNITS) 2020-2029
TABLE 111 REST OF ASIA PACIFIC IMMUNOTHERAPY DRUGS MARKET BY TYPE (USD BILLION) 2020-2029
TABLE 112 REST OF ASIA PACIFIC IMMUNOTHERAPY DRUGS MARKET BY TYPE (THOUSAND UNITS) 2020-2029
TABLE 113 REST OF ASIA PACIFIC IMMUNOTHERAPY DRUGS MARKET BY THERAPY AREA (USD BILLION) 2020-2029
TABLE 114 REST OF ASIA PACIFIC IMMUNOTHERAPY DRUGS MARKET BY THERAPY AREA (THOUSAND UNITS) 2020-2029
TABLE 115 REST OF ASIA PACIFIC IMMUNOTHERAPY DRUGS MARKET BY END USER (USD BILLION) 2020-2029
TABLE 116 REST OF ASIA PACIFIC IMMUNOTHERAPY DRUGS MARKET BY END USER (THOUSAND UNITS) 2020-2029
TABLE 117 EUROPE IMMUNOTHERAPY DRUGS MARKET BY COUNTRY (USD BILLION) 2020-2029
TABLE 118 EUROPE IMMUNOTHERAPY DRUGS MARKET BY COUNTRY (THOUSAND UNITS) 2020-2029
TABLE 119 ASIA-PACIFIC IMMUNOTHERAPY DRUGS MARKET BY TYPE (USD BILLION) 2020-2029
TABLE 120 ASIA-PACIFIC IMMUNOTHERAPY DRUGS MARKET BY TYPE (THOUSAND UNITS) 2020-2029
TABLE 121 ASIA-PACIFIC IMMUNOTHERAPY DRUGS MARKET BY THERAPY AREA (USD BILLION) 2020-2029
TABLE 122 ASIA-PACIFIC IMMUNOTHERAPY DRUGS MARKET BY THERAPY AREA (THOUSAND UNITS) 2020-2029
TABLE 123 ASIA-PACIFIC IMMUNOTHERAPY DRUGS MARKET BY END USER (USD BILLION) 2020-2029
TABLE 124 ASIA-PACIFIC IMMUNOTHERAPY DRUGS MARKET BY END USER (THOUSAND UNITS) 2020-2029
TABLE 125 GERMANY IMMUNOTHERAPY DRUGS MARKET BY TYPE (USD BILLION) 2020-2029
TABLE 126 GERMANY IMMUNOTHERAPY DRUGS MARKET BY TYPE (THOUSAND UNITS) 2020-2029
TABLE 127 GERMANY IMMUNOTHERAPY DRUGS MARKET BY THERAPY AREA (USD BILLION) 2020-2029
TABLE 128 GERMANY IMMUNOTHERAPY DRUGS MARKET BY THERAPY AREA (THOUSAND UNITS) 2020-2029
TABLE 129 GERMANY IMMUNOTHERAPY DRUGS MARKET BY END USER (USD BILLION) 2020-2029
TABLE 130 GERMANY IMMUNOTHERAPY DRUGS MARKET BY END USER (THOUSAND UNITS) 2020-2029
TABLE 131 UK IMMUNOTHERAPY DRUGS MARKET BY TYPE (USD BILLION) 2020-2029
TABLE 132 UK IMMUNOTHERAPY DRUGS MARKET BY TYPE (THOUSAND UNITS) 2020-2029
TABLE 133 UK IMMUNOTHERAPY DRUGS MARKET BY THERAPY AREA (USD BILLION) 2020-2029
TABLE 134 UK IMMUNOTHERAPY DRUGS MARKET BY THERAPY AREA (THOUSAND UNITS) 2020-2029
TABLE 135 UK IMMUNOTHERAPY DRUGS MARKET BY END USER (USD BILLION) 2020-2029
TABLE 136 UK IMMUNOTHERAPY DRUGS MARKET BY END USER (THOUSAND UNITS) 2020-2029
TABLE 137 FRANCE IMMUNOTHERAPY DRUGS MARKET BY TYPE (USD BILLION) 2020-2029
TABLE 138 FRANCE IMMUNOTHERAPY DRUGS MARKET BY TYPE (THOUSAND UNITS) 2020-2029
TABLE 139 FRANCE IMMUNOTHERAPY DRUGS MARKET BY THERAPY AREA (USD BILLION) 2020-2029
TABLE 140 FRANCE IMMUNOTHERAPY DRUGS MARKET BY THERAPY AREA (THOUSAND UNITS) 2020-2029
TABLE 141 FRANCE IMMUNOTHERAPY DRUGS MARKET BY END USER (USD BILLION) 2020-2029
TABLE 142 FRANCE IMMUNOTHERAPY DRUGS MARKET BY END USER (THOUSAND UNITS) 2020-2029
TABLE 143 ITALY IMMUNOTHERAPY DRUGS MARKET BY TYPE (USD BILLION) 2020-2029
TABLE 144 ITALY IMMUNOTHERAPY DRUGS MARKET BY TYPE (THOUSAND UNITS) 2020-2029
TABLE 145 ITALY IMMUNOTHERAPY DRUGS MARKET BY THERAPY AREA (USD BILLION) 2020-2029
TABLE 146 ITALY IMMUNOTHERAPY DRUGS MARKET BY THERAPY AREA (THOUSAND UNITS) 2020-2029
TABLE 147 ITALY IMMUNOTHERAPY DRUGS MARKET BY END USER (USD BILLION) 2020-2029
TABLE 148 ITALY IMMUNOTHERAPY DRUGS MARKET BY END USER (THOUSAND UNITS) 2020-2029
TABLE 149 SPAIN IMMUNOTHERAPY DRUGS MARKET BY TYPE (USD BILLION) 2020-2029
TABLE 150 SPAIN IMMUNOTHERAPY DRUGS MARKET BY TYPE (THOUSAND UNITS) 2020-2029
TABLE 151 SPAIN IMMUNOTHERAPY DRUGS MARKET BY THERAPY AREA (USD BILLION) 2020-2029
TABLE 152 SPAIN IMMUNOTHERAPY DRUGS MARKET BY THERAPY AREA (THOUSAND UNITS) 2020-2029
TABLE 153 SPAIN IMMUNOTHERAPY DRUGS MARKET BY END USER (USD BILLION) 2020-2029
TABLE 154 SPAIN IMMUNOTHERAPY DRUGS MARKET BY END USER (THOUSAND UNITS) 2020-2029
TABLE 155 RUSSIA IMMUNOTHERAPY DRUGS MARKET BY TYPE (USD BILLION) 2020-2029
TABLE 156 RUSSIA IMMUNOTHERAPY DRUGS MARKET BY TYPE (THOUSAND UNITS) 2020-2029
TABLE 157 RUSSIA IMMUNOTHERAPY DRUGS MARKET BY THERAPY AREA (USD BILLION) 2020-2029
TABLE 158 RUSSIA IMMUNOTHERAPY DRUGS MARKET BY THERAPY AREA (THOUSAND UNITS) 2020-2029
TABLE 159 RUSSIA IMMUNOTHERAPY DRUGS MARKET BY END USER (USD BILLION) 2020-2029
TABLE 160 RUSSIA IMMUNOTHERAPY DRUGS MARKET BY END USER (THOUSAND UNITS) 2020-2029
TABLE 161 REST OF EUROPE IMMUNOTHERAPY DRUGS MARKET BY TYPE (USD BILLION) 2020-2029
TABLE 162 REST OF EUROPE IMMUNOTHERAPY DRUGS MARKET BY TYPE (THOUSAND UNITS) 2020-2029
TABLE 163 REST OF EUROPE IMMUNOTHERAPY DRUGS MARKET BY THERAPY AREA (USD BILLION) 2020-2029
TABLE 164 REST OF EUROPE IMMUNOTHERAPY DRUGS MARKET BY THERAPY AREA (THOUSAND UNITS) 2020-2029
TABLE 165 REST OF EUROPE IMMUNOTHERAPY DRUGS MARKET BY END USER (USD BILLION) 2020-2029
TABLE 166 REST OF EUROPE IMMUNOTHERAPY DRUGS MARKET BY END USER (THOUSAND UNITS) 2020-2029
TABLE 167 MIDDLE EAST AND AFRICA IMMUNOTHERAPY DRUGS MARKET BY COUNTRY (USD BILLION) 2020-2029
TABLE 168 MIDDLE EAST AND AFRICA IMMUNOTHERAPY DRUGS MARKET BY COUNTRY (THOUSAND UNITS) 2020-2029
TABLE 169 MIDDLE EAST AND AFRICA IMMUNOTHERAPY DRUGS MARKET BY TYPE (USD BILLION) 2020-2029
TABLE 170 MIDDLE EAST AND AFRICA IMMUNOTHERAPY DRUGS MARKET BY TYPE (THOUSAND UNITS) 2020-2029
TABLE 171 MIDDLE EAST AND AFRICA IMMUNOTHERAPY DRUGS MARKET BY THERAPY AREA (USD BILLION) 2020-2029
TABLE 172 MIDDLE EAST AND AFRICA IMMUNOTHERAPY DRUGS MARKET BY THERAPY AREA (THOUSAND UNITS) 2020-2029
TABLE 173 MIDDLE EAST AND AFRICA IMMUNOTHERAPY DRUGS MARKET BY END USER (USD BILLION) 2020-2029
TABLE 174 MIDDLE EAST AND AFRICA IMMUNOTHERAPY DRUGS MARKET BY END USER (THOUSAND UNITS) 2020-2029
TABLE 175 UAE IMMUNOTHERAPY DRUGS MARKET BY TYPE (USD BILLION) 2020-2029
TABLE 176 UAE IMMUNOTHERAPY DRUGS MARKET BY TYPE (THOUSAND UNITS) 2020-2029
TABLE 177 UAE IMMUNOTHERAPY DRUGS MARKET BY THERAPY AREA (USD BILLION) 2020-2029
TABLE 178 UAE IMMUNOTHERAPY DRUGS MARKET BY THERAPY AREA (THOUSAND UNITS) 2020-2029
TABLE 179 UAE IMMUNOTHERAPY DRUGS MARKET BY END USER (USD BILLION) 2020-2029
TABLE 180 UAE IMMUNOTHERAPY DRUGS MARKET BY END USER (THOUSAND UNITS) 2020-2029
TABLE 181 SAUDI ARABIA IMMUNOTHERAPY DRUGS MARKET BY TYPE (USD BILLION) 2020-2029
TABLE 182 SAUDI ARABIA IMMUNOTHERAPY DRUGS MARKET BY TYPE (THOUSAND UNITS) 2020-2029
TABLE 183 SAUDI ARABIA IMMUNOTHERAPY DRUGS MARKET BY THERAPY AREA (USD BILLION) 2020-2029
TABLE 184 SAUDI ARABIA IMMUNOTHERAPY DRUGS MARKET BY THERAPY AREA (THOUSAND UNITS) 2020-2029
TABLE 185 SAUDI ARABIA IMMUNOTHERAPY DRUGS MARKET BY END USER (USD BILLION) 2020-2029
TABLE 186 SAUDI ARABIA IMMUNOTHERAPY DRUGS MARKET BY END USER (THOUSAND UNITS) 2020-2029
TABLE 187 SOUTH AFRICA IMMUNOTHERAPY DRUGS MARKET BY TYPE (USD BILLION) 2020-2029
TABLE 188 SOUTH AFRICA IMMUNOTHERAPY DRUGS MARKET BY TYPE (THOUSAND UNITS) 2020-2029
TABLE 189 SOUTH AFRICA IMMUNOTHERAPY DRUGS MARKET BY THERAPY AREA (USD BILLION) 2020-2029
TABLE 190 SOUTH AFRICA IMMUNOTHERAPY DRUGS MARKET BY THERAPY AREA (THOUSAND UNITS) 2020-2029
TABLE 191 SOUTH AFRICA IMMUNOTHERAPY DRUGS MARKET BY END USER (USD BILLION) 2020-2029
TABLE 192 SOUTH AFRICA IMMUNOTHERAPY DRUGS MARKET BY END USER (THOUSAND UNITS) 2020-2029
TABLE 193 REST OF MIDDLE EAST AND AFRICA IMMUNOTHERAPY DRUGS MARKET BY TYPE (USD BILLION) 2020-2029
TABLE 194 REST OF MIDDLE EAST AND AFRICA IMMUNOTHERAPY DRUGS MARKET BY TYPE (THOUSAND UNITS) 2020-2029
TABLE 195 REST OF MIDDLE EAST AND AFRICA IMMUNOTHERAPY DRUGS MARKET BY THERAPY AREA (USD BILLION) 2020-2029
TABLE 196 REST OF MIDDLE EAST AND AFRICA IMMUNOTHERAPY DRUGS MARKET BY THERAPY AREA (THOUSAND UNITS) 2020-2029
TABLE 197 REST OF MIDDLE EAST AND AFRICA IMMUNOTHERAPY DRUGS MARKET BY END USER (USD BILLION) 2020-2029
TABLE 198 REST OF MIDDLE EAST AND AFRICA IMMUNOTHERAPY DRUGS MARKET BY END USER (THOUSAND UNITS) 2020-2029
LIST OF FIGURES
FIGURE 1 MARKET DYNAMICS
FIGURE 2 MARKET SEGMENTATION
FIGURE 3 REPORT TIMELINES: YEARS CONSIDERED
FIGURE 4 DATA TRIANGULATION
FIGURE 5 BOTTOM-UP APPROACH
FIGURE 6 TOP-DOWN APPROACH
FIGURE 7 RESEARCH FLOW
FIGURE 8 GLOBAL IMMUNOTHERAPY DRUGS MARKET BY TYPE, USD BILLION, 2020-2029
FIGURE 9 GLOBAL IMMUNOTHERAPY DRUGS MARKET BY THERAPY AREA, USD BILLION, 2020-2029
FIGURE 10 GLOBAL IMMUNOTHERAPY DRUGS MARKET BY END USER, USD BILLION, 2020-2029
FIGURE 11 GLOBAL IMMUNOTHERAPY DRUGS MARKET BY REGION, USD BILLION, 2020-2029
FIGURE 12 PORTER’S FIVE FORCES MODEL
FIGURE 13 GLOBAL IMMUNOTHERAPY DRUGS MARKET BY TYPE, USD BILLION, 2021
FIGURE 14 GLOBAL IMMUNOTHERAPY DRUGS MARKET BY THERAPY AREA, USD BILLION, 2021
FIGURE 15 GLOBAL IMMUNOTHERAPY DRUGS MARKET BY END USER, USD BILLION, 2021
FIGURE 16 GLOBAL IMMUNOTHERAPY DRUGS MARKET BY REGION, USD BILLION, 2021
FIGURE 17 NORTH AMERICA IMMUNOTHERAPY DRUGS MARKET SNAPSHOT
FIGURE 18 EUROPE IMMUNOTHERAPY DRUGS MARKET SNAPSHOT
FIGURE 19 SOUTH AMERICA IMMUNOTHERAPY DRUGS MARKET SNAPSHOT
FIGURE 20 ASIA PACIFIC IMMUNOTHERAPY DRUGS MARKET SNAPSHOT
FIGURE 21 MIDDLE EAST ASIA AND AFRICA IMMUNOTHERAPY DRUGS MARKET SNAPSHOT
FIGURE 22 MARKET SHARE ANALYSIS
FIGURE 23 AMGEN: COMPANY SNAPSHOT
FIGURE 24 NOVARTIS AG: COMPANY SNAPSHOT
FIGURE 25 ABBVIE INC.: COMPANY SNAPSHOT
FIGURE 26 PFIZER INC.: COMPANY SNAPSHOT
FIGURE 27 F. HOFFMAN-LA ROCHE LTD.: COMPANY SNAPSHOT
FIGURE 28 JOHNSON & JOHNSON SERVICES INC.: COMPANY SNAPSHOT
FIGURE 29 ASTAZENECA: COMPANY SNAPSHOT
FIGURE 30 GSK: COMPANY SNAPSHOT
FIGURE 31 SANOFI: COMPANY SNAPSHOT
FIGURE 32 BAYER AG: COMPANY SNAPSHOT
DOWNLOAD FREE SAMPLE REPORT
License Type
SPEAK WITH OUR ANALYST
Want to know more about the report or any specific requirement?
WANT TO CUSTOMIZE THE REPORT?
Our Clients Speak
We asked them to research ‘ Equipment market’ all over the world, and their whole arrangement was helpful to us. thehealthanalytics.com insightful analysis and reports contributed to our current analysis and in creating a future strategy. Besides, the te
Yosuke Mitsui
Senior Associate Construction Equipment Sales & Marketing
We asked them to research ‘Equipment market’ all over the world, and their whole arrangement was helpful to us. thehealthanalytics.com insightful analysis and reports contributed to our current analysis and in creating a future strategy. Besides, the te


