

Base Year Value ()
x.x %
x.x %
CAGR ()
x.x %
x.x %
Forecast Year Value ()
x.x %
x.x %
Historical Data Period
Largest Region
Forecast Period
Mercado de membranas espirales por tipo de polímero (poliamida, PS y PES, fluoropolímeros), por tecnología (ósmosis inversa, microfiltración, ultrafiltración, nanofiltración), por industria del usuario final (tratamiento de agua y aguas residuales, procesamiento industrial, procesamiento de alimentos y bebidas, farmacéutica y médica, otros) y región, tendencias globales y pronóstico de 2022 a 2029
Instant access to hundreds of data points and trends
- Market estimates from 2014-2029
- Competitive analysis, industry segmentation, financial benchmarks
- Incorporates SWOT, Porter's Five Forces and risk management frameworks
- PDF report or online database with Word, Excel and PowerPoint export options
- 100% money back guarantee
Descripción general del mercado de membranas espirales
Se espera que el mercado de membranas espirales crezca a una tasa anual compuesta del 10 % entre 2022 y 2029. Se espera que alcance más de USD 15 040 millones en 2029 desde USD 6380 millones en 2020.
La membrana espiral se curva alrededor de un núcleo central en un medio filtrante conocido como membrana circular, que está densamente compactado. Se utiliza un material espaciador para sellar y cerrar los bordes del filtro para que los líquidos puedan fluir a través de ellos. Debido a su membrana alta y diseño compacto, es perfecto para aplicaciones que involucran líquidos de alto flujo. La filtración se produce cuando se aplica una contrapresión menor para forzar el paso de agua limpia a través de la superficie de la membrana. El agua que se va a filtrar ingresa al módulo de membrana espiral por un extremo. Las membranas, los espaciadores de alimentación, los espaciadores de permeado y un tubo de permeado son todos componentes del elemento espiral. La función de un espaciador de alimentación es crear un pasaje para que el agua pase a través entre las superficies de la membrana y permitir un flujo uniforme entre las hojas de la membrana.
La creciente adopción de membranas espirales es lo que está impulsando la expansión del mercado global de membranas espirales. La creciente conciencia pública sobre el tratamiento del agua y las aguas residuales está impulsando esta adopción. Uno de los factores clave que impulsa el crecimiento del mercado global de membranas espirales es la necesidad de una separación selectiva para cumplir con los estándares de calidad del agua. Los países en desarrollo están aplicando estrictas regulaciones ambientales, lo que puede contribuir al crecimiento positivo del mercado global de membranas espirales.
| ATRIBUTO | DETALLES |
| Periodo de estudio | 2020-2029 |
| Año base | 2021 |
| Año estimado | 2022 |
| Año pronosticado | 2022-2029 |
| Periodo histórico | 2018-2020 |
| Unidad | Valor (USD MIL MILLONES) |
| Segmentación | Por tipo de polímero, por tecnología, por industria del usuario final, por región |
| Por tipo de polímero |
|
| Por tecnología |
|
| Por industria del usuario final |
|
| Por región |
|
En los últimos años, una parte considerable del mercado ha estado formada por el sector de alimentos y bebidas. Se prevé que el sector crezca rápidamente durante el período de pronóstico. Para la concentración de proteína de suero, la concentración de lactosa, la purificación de azúcar y agua, la clarificación de jugo y el tratamiento de aguas residuales, las membranas espirales se utilizan en más del 60% de las aplicaciones en el sector de alimentos y bebidas . Para crear jugos de primera calidad, se utiliza con frecuencia la ultrafiltración y la nanofiltración. El almidón, la pectina, las proteínas y los compuestos polifenólicos se pueden eliminar mediante membranas de ultrafiltración y nanofiltración. La microfiltración es una técnica que se puede utilizar para deshacerse de los microbios.
Dado que el equipo necesario para producir membranas espirales es costoso, su fabricación es un desafío con altos costos. Numerosas industrias de uso final, principalmente aquellas que se ocupan del tratamiento de agua y aguas residuales, la producción de alimentos y bebidas, la producción química y otras, utilizan membranas espirales. El alto nivel de suciedad de los elementos espirales en las membranas espirales requiere un tratamiento, erradicación y limpieza de rutina. Debido a los gastos adicionales de manipulación, pretratamiento, eliminación de suciedad y limpieza, las membranas espirales tienen altos costos operativos para los usuarios finales.
El mercado de las membranas espirales se vio obstaculizado por el brote de COVID-19, que también afectó a la demanda y la producción mundiales. La expansión del mercado se vio obstaculizada por las restricciones de confinamiento, los contratiempos en la fabricación, los problemas de la cadena de suministro y los desafíos logísticos. Las industrias de alimentos y bebidas se vieron afectadas por la disminución del consumo provocada por el cierre de hoteles, tiendas de comestibles y puntos de venta minorista, la interrupción de la cadena de suministro y las restricciones de confinamiento. La industria del tratamiento de aguas residuales se vio frenada por las lentas inversiones del sector del agua y la reducción de las operaciones. Como resultado, la fase inicial de COVID vio una perturbación a corto plazo y un crecimiento decreciente en el mercado mundial de membranas espirales.
Uno de los principales factores que impulsan la expansión del mercado es la combinación de una rápida industrialización y la creciente necesidad de soluciones eficientes para el tratamiento del agua. Además, las crecientes preocupaciones ambientales sobre el vertido de aguas residuales sin tratar y la creciente contaminación de los cuerpos de agua están impulsando la expansión del mercado.
[título id="attachment_15358" align="aligncenter" width="1920"]
Frequently Asked Questions
• What is the worth of Spiral membrane market?
The Spiral membrane market size had crossed USD 6.38 billion in 2020 and will observe a CAGR of more than 10% up to 2029.
• What is the size of the Asia Pacific Spiral membrane industry?
Asia Pacific held more than 36% of the Spiral membrane market revenue share in 2021 and will witness expansion in the forecast period.
• What are some of the market's driving forces?
Drivers such as the presence of major rising product demand across a range of end-use industries, including food and beverage, water and wastewater treatment, industrial processing, and others
• Which are the top companies to hold the market share in Spiral membrane market?
Key players profiled in the report Alfa Laval AB, Applied Membranes Inc., Axeon Water Technologies, Dow Inc., DuPont de Nemours, Inc., Fileder Filter Systems Ltd., GEA Group Aktiengesellschaft, Hydranautics, Koch Separation Solutions Inc etc.
• What is the leading application of Spiral membrane market?
One of the key trends is the reverse osmosis technology. Polyamide nanofiltration membranes are frequently used in industrial processes like desalination, food processing, water purification, wastewater treatment, and bio-separation.
• Which is the largest regional market for Spiral membrane market?
The region's largest share is in Europe. Multiple manufacturers' presence in Europe has led to a sizable market share for the continent.
Spiral membrane Market Segment Analysis
The Spiral membrane market is segmented based on vehicle type, form type, application and Region, Global trends and forecast.By type, the market is bifurcated into polymer type (polyamide, PS & PES, fluoropolymers), by technology (reverse osmosis, microfiltration, ultrafiltration, nanofiltration) and by end-user industry (water & wastewater treatment, industry processing, food & beverage processing, pharmaceutical &, medical, others).
With more than 41% of the market share, polyamide was the most popular type of polymer in 2019. This polymer is expected to be in high demand for applications like water and wastewater treatment, industrial processing, and food and beverage processing due to its wide availability and low cost. Reverse osmosis and polyamide nanofiltration membranes are frequently used in industrial processes like desalination, food processing, water purification, wastewater treatment, and bio-separation. Superior strength and high resistance to oxidation are two features of PS and PES polymers. Furthermore, they are mainly employed in microfiltration and ultrafiltration techniques.
With a market share of more than 40% in 2019, the reverse osmosis technology segment is expected to continue to grow at a constant CAGR from 2020 to 2027. Water and wastewater are mainly purified using reverse osmosis. Additionally, it is employed in the creation of Ultrapure Water (UPW), the treatment of landfill leachates, and the desalination of seawater and brine water. In comparison to more conventional thermal desalination methods like Multistage Flash Distillation (MSF) and Multiple Effect Distillation (MED), reverse osmosis technology has a significantly higher recovery rate. As a result, this technology is quickly taking over at saltwater desalination plants around the globe from the thermal desalination method. Organic materials, such as polymer-based membranes, are used to create microfiltration membranes.
[caption id="attachment_15359" align="aligncenter" width="1920"]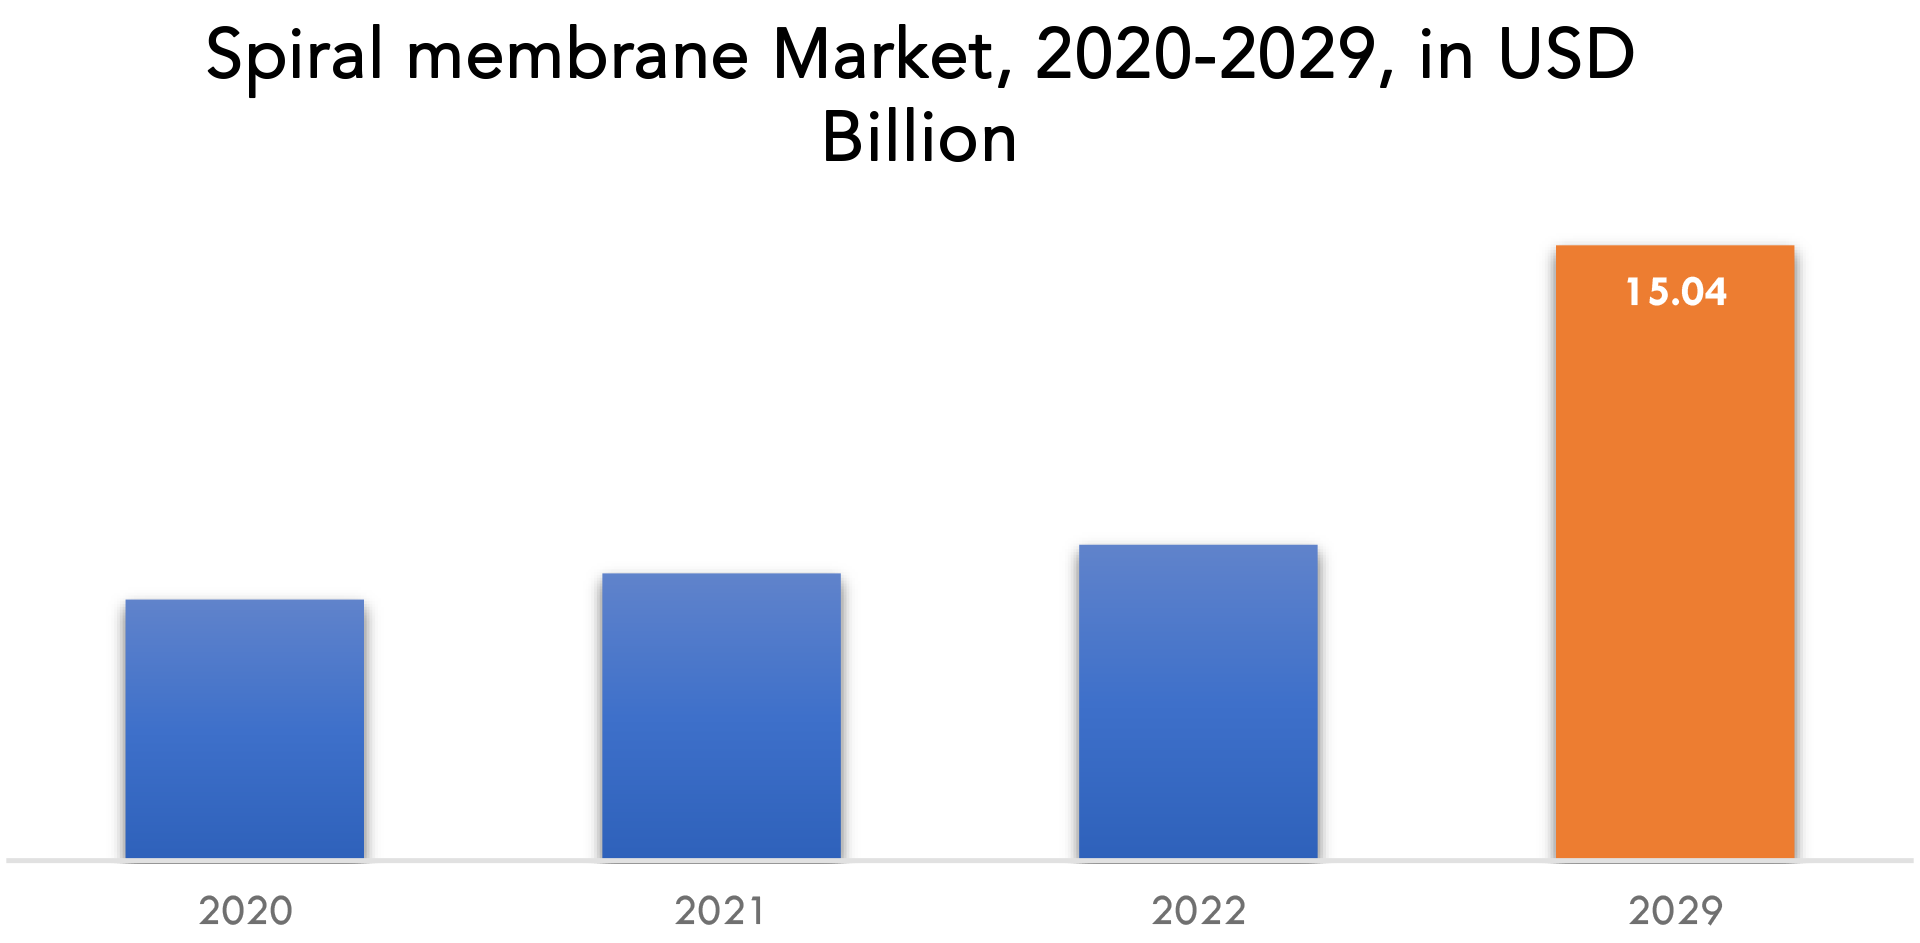
Spiral membrane Market Players
The Spiral membrane market key players include Alfa Laval AB, Applied Membranes Inc., Axeon Water Technologies, Dow Inc., DuPont de Nemours, Inc., Fileder Filter Systems Ltd., GEA Group Aktiengesellschaft, Hydranautics, Koch Separation Solutions Inc., LG Chem Ltd., Merck KGaA, Pall Corporation, Pentair Plc, SUEZ Water Technologies & Solutions and Toray Industries Inc. News: 24th January 2022: Alfa Laval membrane system generates value from waste. 24th January 2022: Hydrofarm and AXEON Water Technologies Enter Strategic Partnership. California-based water filtration manufacturer to distribute systems through Hydrofarm.Who Should Buy? Or Key stakeholders
- Spiral membrane Suppliers
- Raw Materials Manufacturers
- Research Organizations
- Investors
- End-users
- Government Authorities
- Consulting and Research Firm
- Others
Spiral membrane Regional Analysis
The Spiral membrane market by region includes North America, Asia-Pacific (APAC), Europe, South America, and Middle East & Africa (MEA).- North America: includes the US, Canada, Mexico
- Asia Pacific: includes China, Japan, South Korea, India, Australia, ASEAN and Rest of APAC
- Europe: includes UK, Germany, France, Italy, Spain, Russia, and Rest of Europe
- South America: includes Brazil, Argentina and Rest of South America
- Middle East & Africa: includes Turkey, UAE, Saudi Arabia, South Africa, and Rest of MEA
Asia Pacific dominated the global market, contributing more than 36% of global revenue. Due to its rapid industrialization and the escalating environmental concerns in its emerging economies, the region is predicted to continue to grow at the fastest CAGR from 2020 to 2027. Additionally, expanding government initiatives to build water and wastewater treatment facilities are anticipated to fuel market expansion.
Multiple manufacturers' presence in Europe has led to a sizable market share for the continent. Over the forecast period, it is anticipated that growth in Europe's water and wastewater treatment, food and beverage, and pharmaceutical industries will boost product demand. To better serve the larger customer base, distributors and industry players are working together.
Environmental pollution is anticipated to increase as a result of the expansion of industries like mining, metal processing, and chemicals. Thus, it is anticipated that rising environmental concerns and water pollution will encourage the adoption of wastewater treatment procedures, fueling market expansion.
[caption id="attachment_15360" align="aligncenter" width="1920"]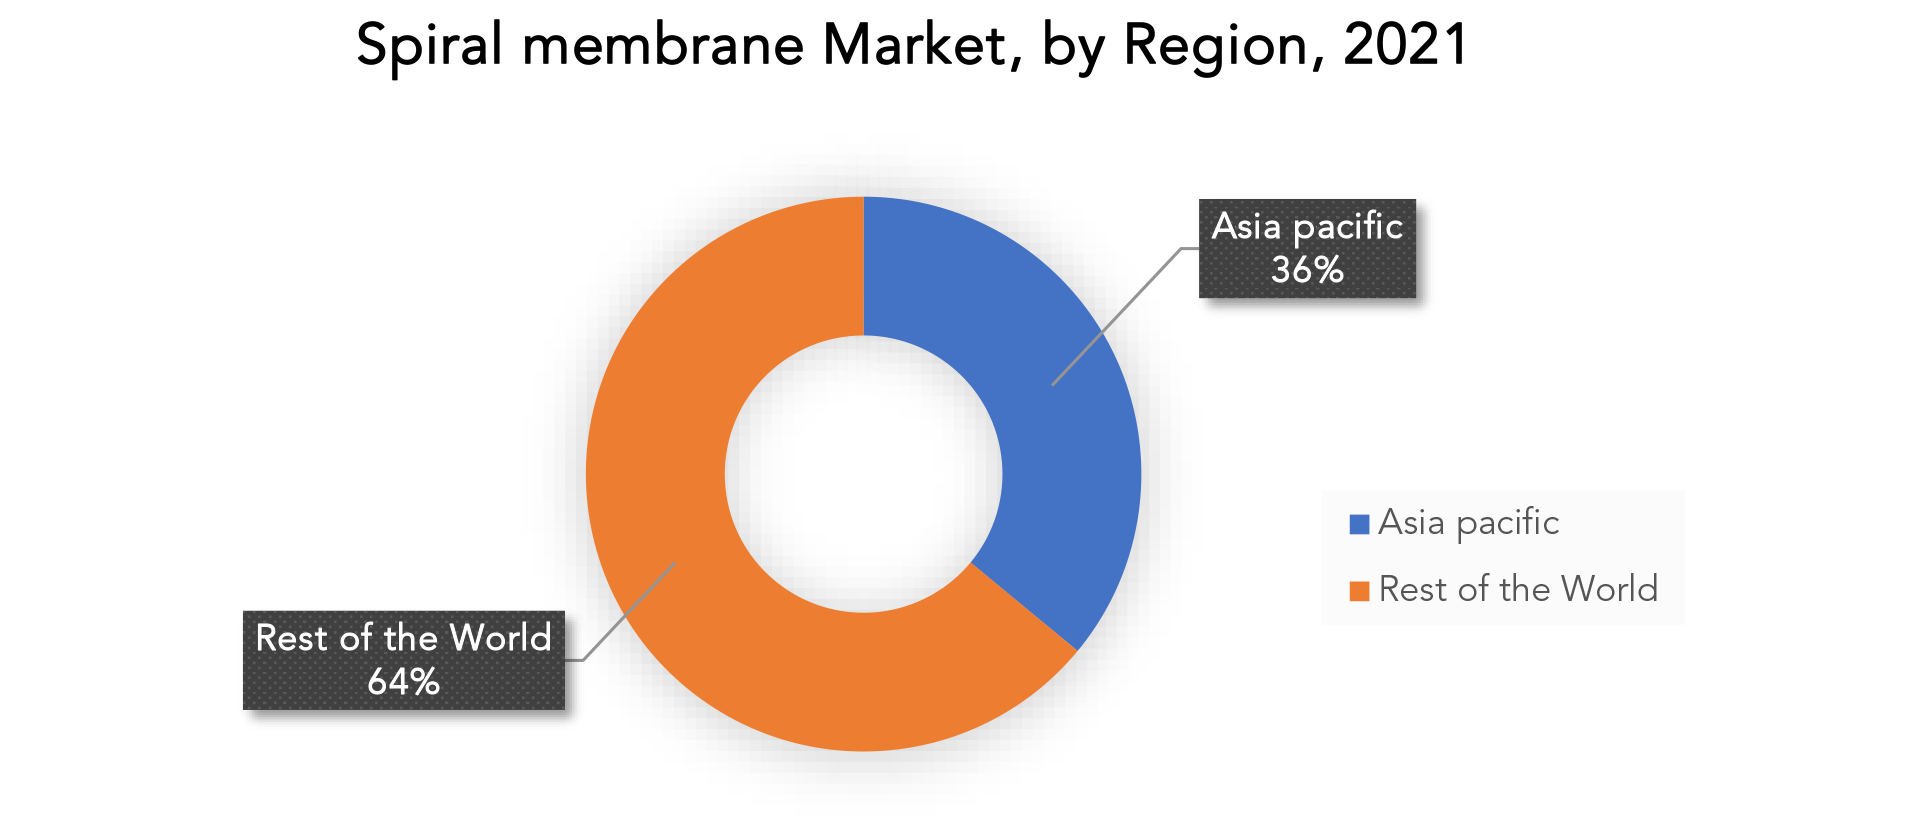
Key Market Segments: Spiral membrane Market
Spiral Membrane Market By Polymer Type, 2020-2029, (Usd Billion)- Polyamide
- Ps & Pes
- Fluoropolymers
- Reverse Osmosis
- Microfiltration
- Ultrafiltration
- Nanofiltration
- Water & Wastewater Treatment
- Industry Processing
- Food & Beverage Processing
- Pharmaceutical & Medical
- Other
- North America
- Asia Pacific
- Europe
- South America
- Middle East And Africa
Exactitude Consultancy Services Key Objectives:
- Increasing sales and market share
- Developing new technology
- Improving profitability
- Entering new markets
- Enhancing brand reputation
Key Question Answered
- What is the expected growth rate of the spiral membrane market over the next 7 years?
- Who are the major players in the spiral membrane market and what is their market share?
- What are the end-user industries driving demand for market and what is their outlook?
- What are the opportunities for growth in emerging markets such as Asia-Pacific, Middle East, and Africa?
- How is the economic environment affecting the spiral membrane market, including factors such as interest rates, inflation, and exchange rates?
- What is the expected impact of government policies and regulations on the spiral membrane market?
- What is the current and forecasted size and growth rate of the global spiral membrane market?
- What are the key drivers of growth in the spiral membrane market?
- What are the distribution channels and supply chain dynamics in the spiral membrane market?
- What are the technological advancements and innovations in the spiral membrane market and their impact on product development and growth?
- What are the regulatory considerations and their impact on the market?
- What are the challenges faced by players in the spiral membrane market and how are they addressing these challenges?
- What are the opportunities for growth and expansion in the spiral membrane market?
- What are the product offerings and specifications of leading players in the market?
- INTRODUCCIÓN
- DEFINICIÓN DE MERCADO
- SEGMENTACIÓN DEL MERCADO
- CRONOGRAMAS DE INVESTIGACIÓN
- SUPUESTOS Y LIMITACIONES
- METODOLOGÍA DE LA INVESTIGACIÓN
- MINERÍA DE DATOS
- INVESTIGACIÓN SECUNDARIA
- INVESTIGACIÓN PRIMARIA
- ASESORAMIENTO DE EXPERTOS EN LA MATERIA
- CONTROLES DE CALIDAD
- REVISIÓN FINAL
- TRIANGULACIÓN DE DATOS
- ENFOQUE DE ABAJO HACIA ARRIBA
- ENFOQUE DE ARRIBA HACIA ABAJO
- FLUJO DE INVESTIGACIÓN
- FUENTES DE DATOS
- MINERÍA DE DATOS
- RESUMEN EJECUTIVO
- PANORAMA DEL MERCADO
- PERSPECTIVA DEL MERCADO MUNDIAL DE MEMBRANAS ESPIRALES
- IMPULSORES DEL MERCADO
- RESTRICCIONES DEL MERCADO
- OPORTUNIDADES DE MERCADO
- IMPACTO DEL COVID-19 EN EL MERCADO DE MEMBRANAS ESPIRALES
- PORTER’S FIVE FORCES MODEL
- THREAT FROM NEW ENTRANTS
- THREAT FROM SUBSTITUTES
- BARGAINING POWER OF SUPPLIERS
- BARGAINING POWER OF CUSTOMERS
- DEGREE OF COMPETITION
- INDUSTRY VALUE CHAIN ANALYSIS
- PERSPECTIVA DEL MERCADO MUNDIAL DE MEMBRANAS ESPIRALES
- GLOBAL SPIRAL MEMBRANE MARKET BY POLYMER TYPE, 2020-2029, (USD BILLION)
- POLYAMIDE
- PS & PES
- FLUOROPOLYMERS
- GLOBAL SPIRAL MEMBRANE MARKET BY TECHNOLOGY, 2020-2029, (USD BILLION)
- REVERSE OSMOSIS
- MICROFILTRATION
- ULTRAFILTRATION
- NANOFILTRATION
- GLOBAL SPIRAL MEMBRANE MARKET BY END USER INDUSTRY, 2020-2029, (USD BILLION)
- WATER & WASTEWATER TREATMENT
- INDUSTRY PROCESSING
- FOOD & BEVERAGE PROCESSING
- PHARMACEUTICAL & MEDICAL
- OTHERS
- GLOBAL SPIRAL MEMBRANE MARKET BY REGION, 2020-2029, (USD BILLION)
- NORTH AMERICA
- US
- CANADA
- MEXICO
- SOUTH AMERICA
- BRAZIL
- ARGENTINA
- COLOMBIA
- REST OF SOUTH AMERICA
- EUROPE
- GERMANY
- UK
- FRANCE
- ITALY
- SPAIN
- RUSSIA
- REST OF EUROPE
- ASIA PACIFIC
- INDIA
- CHINA
- JAPAN
- SOUTH KOREA
- AUSTRALIA
- SOUTH-EAST ASIA
- REST OF ASIA PACIFIC
- MIDDLE EAST AND AFRICA
- UAE
- SAUDI ARABIA
- SOUTH AFRICA
- REST OF MIDDLE EAST AND AFRICA
- NORTH AMERICA
- COMPANY PROFILES* (BUSINESS OVERVIEW, COMPANY SNAPSHOT, PRODUCTS OFFERED, RECENT DEVELOPMENTS)
- MIX TELEMATICS
- ALFA LAVAL AB
- APPLIED MEMBRANES INC
- AXEON WATER TECHNOLOGIES
- DOW INC
- DUPONT DE NEMOURS, INC.
- FILEDER FILTER SYSTEMS LTD.
- GEA GROUP
- AKTIENGESELLSCHAFT HYDRANAUTICS
- KOCH SEPARATION SOLUTIONS INC.
- LG CHEM LTD.
- MERCK KGAA
- PALL CORPORATION
- PENTAIR PLC
- SUEZ WATER TECHNOLOGIES & SOLUTIONS
- TORAY INDUSTRIES INC. *THE COMPANY LIST IS INDICATIVE
LIST OF TABLES
TABLE 1 GLOBAL SPIRAL MEMBRANE MARKET BY POLYMER TYPE (USD BILLION), 2020-2029
TABLE 2 GLOBAL SPIRAL MEMBRANE MARKET BY TECHNOLOGY (USD BILLION), 2020-2029
TABLE 3 GLOBAL SPIRAL MEMBRANE MARKET BY END USER INDUSTRY (USD BILLION), 2020-2029
TABLE 4 GLOBAL SPIRAL MEMBRANE MARKET BY REGION (USD BILLION), 2020-2029
TABLE 5 NORTH AMERICA SPIRAL MEMBRANE MARKET BY POLYMER TYPE (USD BILLION), 2020-2029
TABLE 6 NORTH AMERICA SPIRAL MEMBRANE MARKET BY TECHNOLOGY (USD BILLION), 2020-2029
TABLE 7 NORTH AMERICA SPIRAL MEMBRANE MARKET BY END USER INDUSTRY (USD BILLION), 2020-2029
TABLE 8 NORTH AMERICA SPIRAL MEMBRANE MARKET BY COUNTRY (USD BILLION), 2020-2029
TABLE 9 US SPIRAL MEMBRANE MARKET BY POLYMER TYPE (USD BILLION), 2020-2029
TABLE 10 US SPIRAL MEMBRANE MARKET BY TECHNOLOGY (USD BILLION), 2020-2029
TABLE 11 US SPIRAL MEMBRANE MARKET BY END USER INDUSTRY (USD BILLION), 2020-2029
TABLE 12 CANADA SPIRAL MEMBRANE MARKET BY POLYMER TYPE (BILLION), 2020-2029
TABLE 13 CANADA SPIRAL MEMBRANE MARKET BY TECHNOLOGY (USD BILLION), 2020-2029
TABLE 14 CANADA SPIRAL MEMBRANE MARKET BY END USER INDUSTRY (USD BILLION), 2020-2029
TABLE 15 MEXICO SPIRAL MEMBRANE MARKET BY POLYMER TYPE (USD BILLION), 2020-2029
TABLE 16 MEXICO SPIRAL MEMBRANE MARKET BY TECHNOLOGY (USD BILLION), 2020-2029
TABLE 17 MEXICO SPIRAL MEMBRANE MARKET BY END USER INDUSTRY (USD BILLION), 2020-2029
TABLE 18 SOUTH AMERICA SPIRAL MEMBRANE MARKET BY POLYMER TYPE (USD BILLION), 2020-2029
TABLE 19 SOUTH AMERICA SPIRAL MEMBRANE MARKET BY TECHNOLOGY (USD BILLION), 2020-2029
TABLE 20 SOUTH AMERICA SPIRAL MEMBRANE MARKET BY END USER INDUSTRY (USD BILLION), 2020-2029
TABLE 21 SOUTH AMERICA SPIRAL MEMBRANE MARKET BY COUNTRY (USD BILLION), 2020-2029
TABLE 22 BRAZIL SPIRAL MEMBRANE MARKET BY POLYMER TYPE (USD BILLION), 2020-2029
TABLE 23 BRAZIL SPIRAL MEMBRANE MARKET BY TECHNOLOGY (USD BILLION), 2020-2029
TABLE 24 BRAZIL SPIRAL MEMBRANE MARKET BY END USER INDUSTRY (USD BILLION), 2020-2029
TABLE 25 ARGENTINA SPIRAL MEMBRANE MARKET BY POLYMER TYPE (USD BILLION), 2020-2029
TABLE 26 ARGENTINA SPIRAL MEMBRANE MARKET BY TECHNOLOGY (USD BILLION), 2020-2029
TABLE 27 ARGENTINA SPIRAL MEMBRANE MARKET BY END USER INDUSTRY (USD BILLION), 2020-2029
TABLE 28 COLOMBIA SPIRAL MEMBRANE MARKET BY POLYMER TYPE (USD BILLION), 2020-2029
TABLE 29 COLOMBIA SPIRAL MEMBRANE MARKET BY TECHNOLOGY (USD BILLION), 2020-2029
TABLE 30 COLOMBIA SPIRAL MEMBRANE MARKET BY END USER INDUSTRY (USD BILLION), 2020-2029
TABLE 31 REST OF SOUTH AMERICA SPIRAL MEMBRANE MARKET BY POLYMER TYPE (USD BILLION), 2020-2029
TABLE 32 REST OF SOUTH AMERICA SPIRAL MEMBRANE MARKET BY TECHNOLOGY (USD BILLION), 2020-2029
TABLE 33 REST OF SOUTH AMERICA SPIRAL MEMBRANE MARKET BY END USER INDUSTRY (USD BILLION), 2020-2029
TABLE 34 ASIA-PACIFIC SPIRAL MEMBRANE MARKET BY POLYMER TYPE (USD BILLION), 2020-2029
TABLE 35 ASIA-PACIFIC SPIRAL MEMBRANE MARKET BY TECHNOLOGY (USD BILLION), 2020-2029
TABLE 36 ASIA-PACIFIC SPIRAL MEMBRANE MARKET BY END USER INDUSTRY (USD BILLION), 2020-2029
TABLE 37 ASIA-PACIFIC SPIRAL MEMBRANE MARKET BY COUNTRY (USD BILLION), 2020-2029
TABLE 38 INDIA SPIRAL MEMBRANE MARKET BY POLYMER TYPE (USD BILLION), 2020-2029
TABLE 39 INDIA SPIRAL MEMBRANE MARKET BY TECHNOLOGY (USD BILLION), 2020-2029
TABLE 40 INDIA SPIRAL MEMBRANE MARKET BY END USER INDUSTRY (USD BILLION), 2020-2029
TABLE 41 CHINA SPIRAL MEMBRANE MARKET BY POLYMER TYPE (USD BILLION), 2020-2029
TABLE 42 CHINA SPIRAL MEMBRANE MARKET BY TECHNOLOGY (USD BILLION), 2020-2029
TABLE 43 CHINA SPIRAL MEMBRANE MARKET BY END USER INDUSTRY (USD BILLION), 2020-2029
TABLE 44 JAPAN SPIRAL MEMBRANE MARKET BY POLYMER TYPE (USD BILLION), 2020-2029
TABLE 45 JAPAN SPIRAL MEMBRANE MARKET BY TECHNOLOGY (USD BILLION), 2020-2029
TABLE 46 JAPAN SPIRAL MEMBRANE MARKET BY END USER INDUSTRY (USD BILLION), 2020-2029
TABLE 47 SOUTH KOREA SPIRAL MEMBRANE MARKET BY POLYMER TYPE (USD BILLION), 2020-2029
TABLE 48 SOUTH KOREA SPIRAL MEMBRANE MARKET BY TECHNOLOGY (USD BILLION), 2020-2029
TABLE 49 SOUTH KOREA SPIRAL MEMBRANE MARKET BY END USER INDUSTRY (USD BILLION), 2020-2029
TABLE 50 AUSTRALIA SPIRAL MEMBRANE MARKET BY POLYMER TYPE (USD BILLION), 2020-2029
TABLE 51 AUSTRALIA SPIRAL MEMBRANE MARKET BY TECHNOLOGY (USD BILLION), 2020-2029
TABLE 52 AUSTRALIA SPIRAL MEMBRANE MARKET BY END USER INDUSTRY (USD BILLION), 2020-2029
TABLE 53 SOUTH EAST ASIA SPIRAL MEMBRANE MARKET BY POLYMER TYPE (USD BILLION), 2020-2029
TABLE 54 SOUTH EAST ASIA SPIRAL MEMBRANE BY TYPE (THOUSAND UNITS), 2020-2029
TABLE 55 SOUTH EAST ASIA SPIRAL MEMBRANE MARKET BY TECHNOLOGY (USD BILLION), 2020-2029
TABLE 56 SOUTH EAST ASIA SPIRAL MEMBRANE MARKET BY END USER INDUSTRY (USD BILLION), 2020-2029
TABLE 57 REST OF ASIA PACIFIC SPIRAL MEMBRANE MARKET BY POLYMER TYPE (USD BILLION), 2020-2029
TABLE 58 REST OF ASIA PACIFIC SPIRAL MEMBRANE MARKET BY TECHNOLOGY (USD BILLION), 2020-2029
TABLE 59 REST OF ASIA PACIFIC SPIRAL MEMBRANE MARKET BY END USER INDUSTRY (USD BILLION), 2020-2029
TABLE 60 EUROPE SPIRAL MEMBRANE MARKET BY POLYMER TYPE (USD BILLION), 2020-2029
TABLE 61 EUROPE SPIRAL MEMBRANE MARKET BY TECHNOLOGY (USD BILLION), 2020-2029
TABLE 62 EUROPE SPIRAL MEMBRANE MARKET BY END USER INDUSTRY (USD BILLION), 2020-2029
TABLE 63 EUROPE SPIRAL MEMBRANE MARKET BY COUNTRY (USD BILLION), 2020-2029
TABLE 64 GERMANY SPIRAL MEMBRANE MARKET BY POLYMER TYPE (USD BILLION), 2020-2029
TABLE 65 GERMANY SPIRAL MEMBRANE MARKET BY TECHNOLOGY (USD BILLION), 2020-2029
TABLE 66 GERMANY SPIRAL MEMBRANE MARKET BY END USER INDUSTRY (USD BILLION), 2020-2029
TABLE 67 UK SPIRAL MEMBRANE MARKET BY POLYMER TYPE (USD BILLION), 2020-2029
TABLE 68 UK SPIRAL MEMBRANE MARKET BY TECHNOLOGY (USD BILLION), 2020-2029
TABLE 69 UK SPIRAL MEMBRANE MARKET BY END USER INDUSTRY (USD BILLION), 2020-2029
TABLE 70 FRANCE SPIRAL MEMBRANE MARKET BY POLYMER TYPE (USD BILLION), 2020-2029
TABLE 71 FRANCE SPIRAL MEMBRANE MARKET BY TECHNOLOGY (USD BILLION), 2020-2029
TABLE 72 FRANCE SPIRAL MEMBRANE MARKET BY END USER INDUSTRY (USD BILLION), 2020-2029
TABLE 73 ITALY SPIRAL MEMBRANE MARKET BY POLYMER TYPE (USD BILLION), 2020-2029
TABLE 74 ITALY SPIRAL MEMBRANE MARKET BY TECHNOLOGY (USD BILLION), 2020-2029
TABLE 75 ITALY SPIRAL MEMBRANE MARKET BY END USER INDUSTRY (USD BILLION), 2020-2029
TABLE 76 SPAIN SPIRAL MEMBRANE MARKET BY POLYMER TYPE (USD BILLION), 2020-2029
TABLE 77 SPAIN SPIRAL MEMBRANE MARKET BY TECHNOLOGY (USD BILLION), 2020-2029
TABLE 78 SPAIN SPIRAL MEMBRANE MARKET BY END USER INDUSTRY (USD BILLION), 2020-2029
TABLE 79 RUSSIA SPIRAL MEMBRANE MARKET BY POLYMER TYPE (USD BILLION), 2020-2029
TABLE 80 RUSSIA SPIRAL MEMBRANE MARKET BY TECHNOLOGY (USD BILLION), 2020-2029
TABLE 81 RUSSIA SPIRAL MEMBRANE MARKET BY END USER INDUSTRY (USD BILLION), 2020-2029
TABLE 82 REST OF EUROPE SPIRAL MEMBRANE MARKET BY POLYMER TYPE (USD BILLION), 2020-2029
TABLE 83 REST OF EUROPE SPIRAL MEMBRANE MARKET BY TECHNOLOGY (USD BILLION), 2020-2029
TABLE 84 REST OF EUROPE SPIRAL MEMBRANE MARKET BY END USER INDUSTRY (USD BILLION), 2020-2029
TABLE 85 MIDDLE EAST AND AFRICA SPIRAL MEMBRANE MARKET BY POLYMER TYPE (USD BILLION), 2020-2029
TABLE 86 MIDDLE EAST AND AFRICA SPIRAL MEMBRANE MARKET BY TECHNOLOGY (USD BILLION), 2020-2029
TABLE 87 MIDDLE EAST AND AFRICA SPIRAL MEMBRANE MARKET BY END USER INDUSTRY (USD BILLION), 2020-2029
TABLE 88 MIDDLE EAST AND AFRICA SPIRAL MEMBRANE MARKET BY COUNTRY (USD BILLION), 2020-2029
TABLE 89 UAE SPIRAL MEMBRANE MARKET BY POLYMER TYPE (USD BILLION), 2020-2029
TABLE 90 UAE SPIRAL MEMBRANE MARKET BY TECHNOLOGY (USD BILLION), 2020-2029
TABLE 91 UAE SPIRAL MEMBRANE MARKET BY END USER INDUSTRY (USD BILLION), 2020-2029
TABLE 92 SAUDI ARABIA SPIRAL MEMBRANE MARKET BY POLYMER TYPE (USD BILLION), 2020-2029
TABLE 93 SAUDI ARABIA SPIRAL MEMBRANE MARKET BY TECHNOLOGY (USD BILLION), 2020-2029
TABLE 94 SAUDI ARABIA SPIRAL MEMBRANE MARKET BY END USER INDUSTRY (USD BILLION), 2020-2029
TABLE 95 SOUTH AFRICA SPIRAL MEMBRANE MARKET BY POLYMER TYPE (USD BILLION), 2020-2029
TABLE 96 SOUTH AFRICA SPIRAL MEMBRANE MARKET BY TECHNOLOGY (USD BILLION), 2020-2029
TABLE 97 SOUTH AFRICA SPIRAL MEMBRANE MARKET BY END USER INDUSTRY (USD BILLION), 2020-2029
TABLE 98 REST OF MIDDLE EAST AND AFRICA SPIRAL MEMBRANE MARKET BY POLYMER TYPE (USD BILLION), 2020-2029
TABLE 99 REST OF MIDDLE EAST AND AFRICA SPIRAL MEMBRANE MARKET BY TECHNOLOGY (USD BILLION), 2020-2029
TABLE 100 REST OF MIDDLE EAST AND AFRICA SPIRAL MEMBRANE MARKET BY END USER INDUSTRY (USD BILLION), 2020-2029
LIST OF FIGURES
FIGURE 1 MARKET DYNAMICS
FIGURE 2 MARKET SEGMENTATION
FIGURE 3 REPORT TIMELINES: YEARS CONSIDERED
FIGURE 4 DATA TRIANGULATION
FIGURE 5 BOTTOM-UP APPROACH
FIGURE 6 TOP-DOWN APPROACH
FIGURE 7 RESEARCH FLOW
FIGURE 8 GLOBAL SPIRAL MEMBRANE MARKET BY POLYMER TYPE, USD BILLION, 2020-2029
FIGURE 9 GLOBAL SPIRAL MEMBRANE MAKRET BY TECHNOLOGY, USD BILLION, 2020-2029
FIGURE 10 GLOBAL SPIRAL MEMBRANE MARKET BY END USER INDUSTRY, USD BILLION, 2020-2029
FIGURE 11 GLOBAL SPIRAL MEMBRANE MARKET BY REGION, USD BILLION, 2020-2029
FIGURE 12 PORTER’S FIVE FORCES MODEL
FIGURE 13 SPIRAL MEMBRANE MARKET BY POLYMER TYPE 2021
FIGURE 14 SPIRAL MEMBRANE MAKRET BY TECHNOLOGY 2021
FIGURE 15 SPIRAL MEMBRANE MARKET BY END USER INDUSTRY 2021
FIGURE 16 GLOBAL SPIRAL MEMBRANE MARKET BY REGION 2021
FIGURE 17 MARKET SHARE ANALYSIS
FIGURE 18 ALFA LAVAL AB: COMPANY SNAPSHOT
FIGURE 19 APPLIED MEMBRANES INC.: COMPANY SNAPSHOT
FIGURE 20 AXEON WATER TECHNOLOGIES: COMPANY SNAPSHOT
FIGURE 21 DOW INC.: COMPANY SNAPSHOT
FIGURE 22 DUPONT DE NEMOURS, INC.: COMPANY SNAPSHOT
FIGURE 23 FILEDER FILTER SYSTEMS LTD.: COMPANY SNAPSHOT
FIGURE 24 AKTIENGESELLSCHAFT HYDRANAUTICS: COMPANY SNAPSHOT
FIGURE 25 KOCH SEPARATION SOLUTIONS INC.: COMPANY SNAPSHOT
FIGURE 26 LG CHEM LTD.: COMPANY SNAPSHOT
FIGURE 27 MERCK KGAA: COMPANY SNAPSHOT
FIGURE 28 PALL CORPORATION: COMPANY SNAPSHOT
FIGURE 29 PENTAIR PLC: COMPANY SNAPSHOT
FIGURE 30 SUEZ WATER TECHNOLOGIES & SOLUTIONS: COMPANY SNAPSHOT
FIGURE 31 TORAY INDUSTRIES INC.: COMPANY SNAPSHOT
DOWNLOAD FREE SAMPLE REPORT
License Type
SPEAK WITH OUR ANALYST
Want to know more about the report or any specific requirement?
WANT TO CUSTOMIZE THE REPORT?
Our Clients Speak
We asked them to research ‘ Equipment market’ all over the world, and their whole arrangement was helpful to us. thehealthanalytics.com insightful analysis and reports contributed to our current analysis and in creating a future strategy. Besides, the te
Yosuke Mitsui
Senior Associate Construction Equipment Sales & Marketing
We asked them to research ‘Equipment market’ all over the world, and their whole arrangement was helpful to us. thehealthanalytics.com insightful analysis and reports contributed to our current analysis and in creating a future strategy. Besides, the te


