

Base Year Value ()
x.x %
x.x %
CAGR ()
x.x %
x.x %
Forecast Year Value ()
x.x %
x.x %
Historical Data Period
Largest Region
Forecast Period
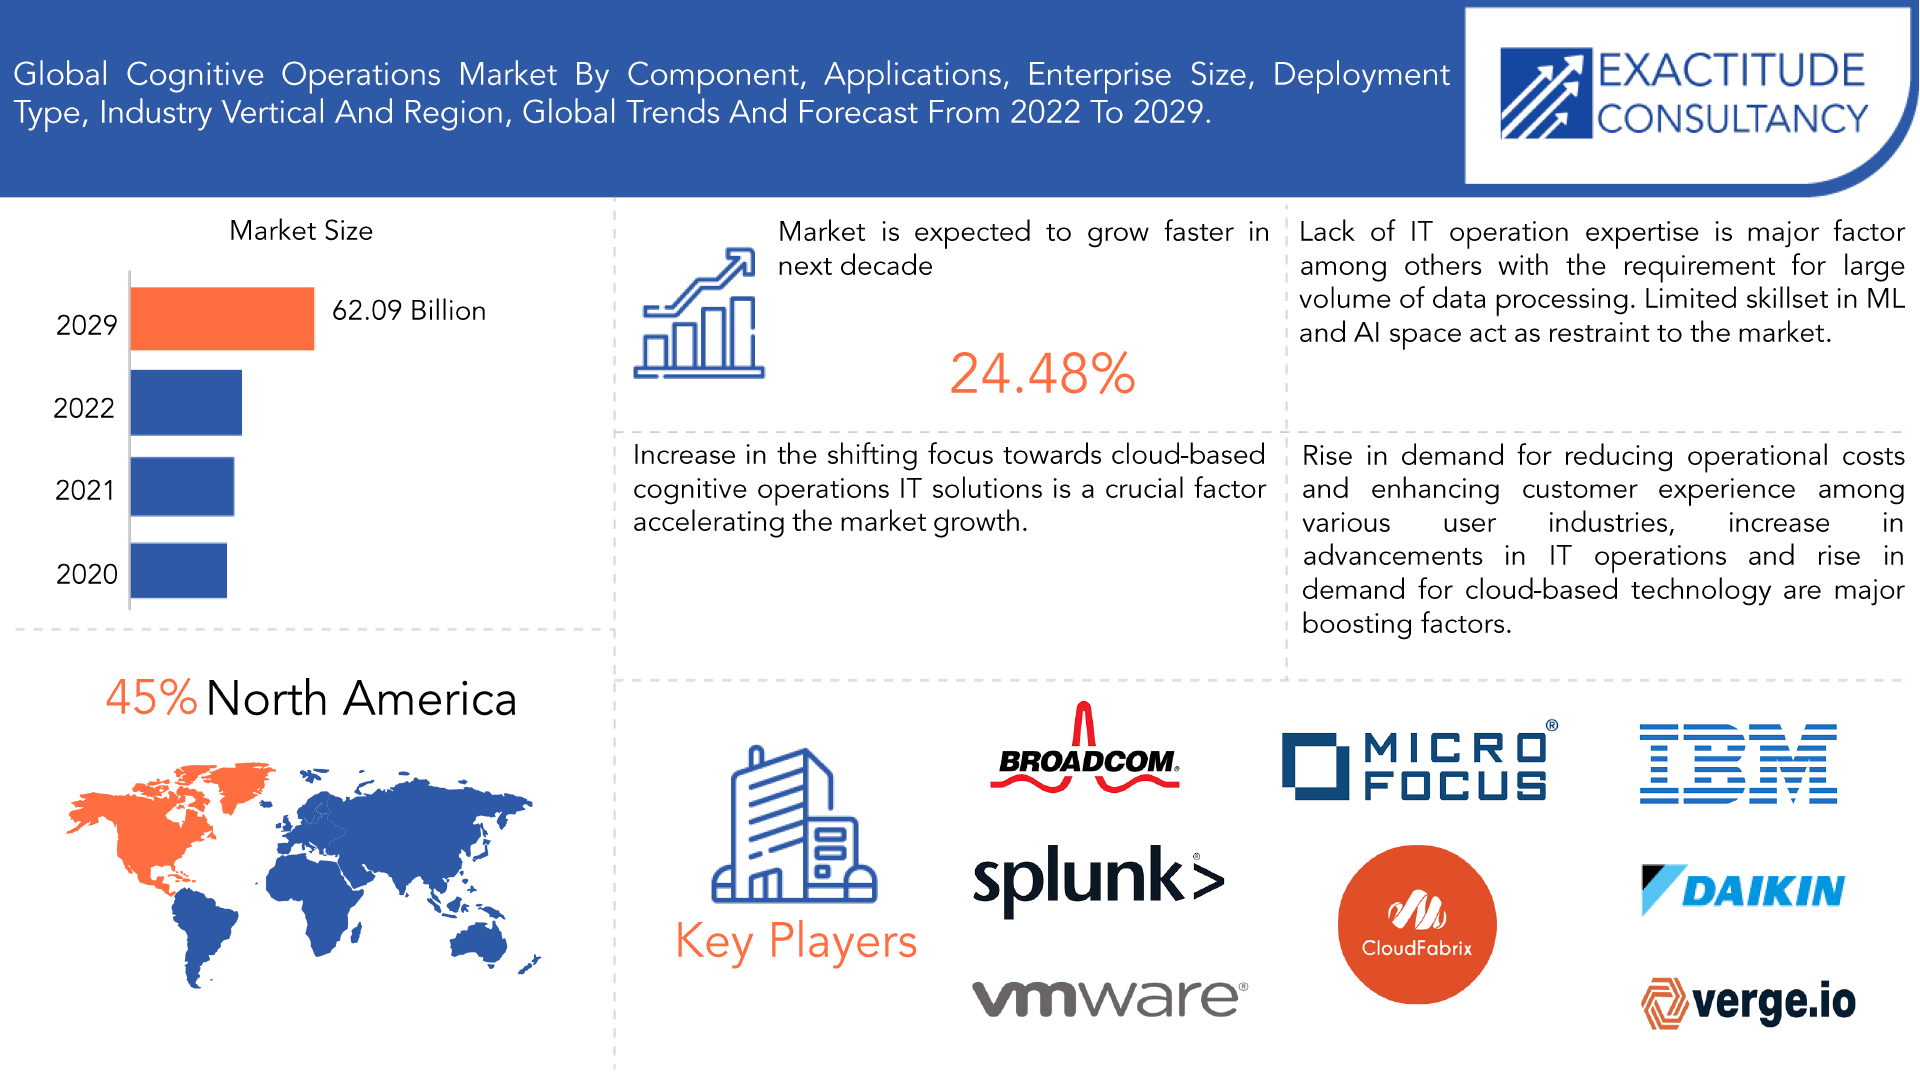
Mercado global de operaciones cognitivas por tipo de implementación (nube, local), por aplicación (análisis de operaciones de TI, gestión de infraestructura, análisis de red, análisis de seguridad), por tamaño de empresa (gran empresa, pymes), por componente (soluciones, servicios), por vertical industrial (BFSI, TI y telecomunicaciones, atención médica y ciencias biológicas, medios y entretenimiento, fabricación, gobierno, comercio minorista y comercio electrónico) y por región, tendencias globales y pronóstico de 2022 a 2029.
Instant access to hundreds of data points and trends
- Market estimates from 2014-2029
- Competitive analysis, industry segmentation, financial benchmarks
- Incorporates SWOT, Porter's Five Forces and risk management frameworks
- PDF report or online database with Word, Excel and PowerPoint export options
- 100% money back guarantee
Descripción general del mercado global de operaciones cognitivas
Se espera que el tamaño del mercado global de operaciones cognitivas crezca a una tasa de crecimiento anual compuesta (CAGR) de más del 24,48 % entre 2021 y 2029. Se espera que alcance más de 8650 millones de USD en 2029 desde un poco más de 62 090 millones de USD en 2020.
Para identificar posibles problemas con soluciones cognitivas en mucho menos tiempo, las operaciones cognitivas hacen uso de la inteligencia artificial . Además, estos sistemas permiten automatizar las operaciones de TI y de negocios para detectar patrones, examinar señales visuales y de voz, proporcionar pronósticos y agilizar procedimientos. Las operaciones cognitivas contemporáneas combinan soluciones de automatización digital de clase empresarial completas en lugar de estar restringidas a pequeños sistemas de automatización independientes. El crecimiento de los ingresos del mercado está siendo impulsado por la creciente demanda de productos de operaciones cognitivas para Internet de las cosas (IoT), recuperación de información y aprendizaje automático (ML). Con la rápida integración de sus sistemas en dispositivos IoT, las operaciones cognitivas son un nuevo paradigma de tecnologías de computación inteligente que ayudan con las operaciones diarias de la empresa. A nivel mundial, una cantidad considerable de empresas con y sin fines de lucro están modernizando sus modelos de servicio e integrando operaciones cognitivas en el ecosistema de Internet de las cosas (IoT). Las operaciones cognitivas se han desarrollado rápidamente como resultado de los avances en IA y ciencia informática, y durante el transcurso del período de proyección, se anticipa que crecerán en popularidad.
| ATRIBUTO | DETALLES |
| Periodo de estudio | 2020-2029 |
| Año base | 2021 |
| Año estimado | 2022 |
| Año pronosticado | 2022-2029 |
| Periodo histórico | 2018-2020 |
| Unidad | Valor (miles de millones de USD) |
| Segmentación | Por tipo de implementación, por aplicación, por tamaño de empresa, por componente, por sector industrial, por región |
| Por tipo de implementación |
|
| Por aplicación |
|
| Por tamaño de empresa |
|
| Por componente |
|
| Por componente |
|
| Por región |
|
El objetivo principal de las operaciones cognitivas es ayudar a las empresas a tomar decisiones. Es la respuesta perfecta para llevar a cabo operaciones empresariales fluidas mediante el uso de capacidades de ML como el análisis predictivo. Dado que el análisis predictivo es una herramienta eficaz para producir resultados correctos, muchos clientes empresariales están utilizando estas eficaces soluciones de análisis predictivo para llevar a cabo las operaciones diarias de la empresa. El procesamiento y la manipulación de un volumen considerable y una gran variedad de datos, incluidos patrones numéricos, textuales y lingüísticos, así como entradas sensoriales como fotos, videos y sonidos en tiempo real, es otro componente importante en el crecimiento del mercado de las operaciones cognitivas. Estas soluciones están impulsando la experiencia del cliente y del empleado, motivando a las empresas a desarrollar nuevos bienes y servicios, identificando nuevas oportunidades comerciales mediante la reducción del riesgo, y más. Se prevé que estos aspectos impulsen la demanda en el mercado de las operaciones cognitivas.
Al desarrollar, implementar y administrar sistemas basados en IA en las operaciones de TI, la mayoría de las organizaciones enfrentan problemas debido a la falta de experiencia y habilidades analíticas. La falta de habilidades analíticas y de trabajadores competentes son los principales problemas a los que se enfrentan las organizaciones. Los datos de las operaciones de TI ahora deben analizarse utilizando algoritmos de aprendizaje automático. Se necesitan conocimientos, competencia y el tipo de capacitación adecuado para construir modelos de aprendizaje automático porque es un proceso difícil.
Como muchas empresas trasladaron sus operaciones al trabajo remoto como resultado de COVID-19, la tecnología de la información experimentó un rápido desarrollo. El creciente uso de Internet para el trabajo a distancia, la educación, las redes sociales y el entretenimiento ha tenido un impacto favorable en el mercado de operaciones cognitivas en COVID-19. La mayoría de las empresas han trasladado sus operaciones en línea, por lo que la demanda de operaciones cognitivas se ha expandido drásticamente con el tiempo. Las industrias de escala masiva han adoptado principalmente soluciones de operaciones cognitivas para procesar y manipular grandes volúmenes de datos, incluida la tecnología de la información, la atención médica y farmacéutica, la cadena de suministro, el comercio electrónico, el comercio minorista y otros. Para detener la propagación de la enfermedad, las empresas y los gobiernos también han utilizado análisis geoespaciales y operaciones cognitivas para la visualización de datos .
[título id="attachment_16323" align="aligncenter" width="1920"]
Frequently Asked Questions
• Who are the key players in the global cognitive operations market?
Some key players operating in the Global Cognitive Operations market include IBM Corporation, Micro Focus International Plc, Broadcom Corporation, VMware Inc., Splunk Inc., CloudFabrix, Verge.io, Daikin, HCK Technologies, CA Technologies.
• What are the factors driving the global cognitive operations market?
The use of adaptive and cognitive solutions in daily life enables experts to easily maintain, monitor, and analyze huge and complicated data sets. The IT Infrastructure is also aided by it. Data is currently expanding quickly across all IT departments. Additionally, the digital transformation is generating a lot of data, such as log data, performance data, configuration data, and events data. Managers of IT operations can utilize this information to improve their operational effectiveness and streamline corporate operations.
• How big is the global cognitive operations market?
The global cognitive operations market size was estimated at USD 8.65 billion in 2020 and is expected to reach USD 62.09 billion in 2029.
• What is the global cognitive operations market growth?
The global cognitive operations market is expected to grow at a compound annual growth rate of 24.48 % from 2022 to 2029 to reach USD 62.09 billion by 2029.
• Which region accounted for the largest global cognitive operations market share?
The North America dominated the global cognitive operations market with a share of 45% in 2021.
Global Cognitive Operations Market Segment Analysis
As a result of the cloud's many advantages, including lower operating costs, easier deployments, and greater scalability, the cloud deployment option is anticipated to increase at a higher CAGR during the projection period. Contrarily, it is anticipated that the on-premises deployment mode will account for a greater share of the cognitive operations market during the projection period since data-sensitive businesses favor on-premises deployment of cognitive operations solutions.
The IT operations analytics (ITOA) application is anticipated to have the biggest market size during the projection period, while the security analytics application is anticipated to develop at the quickest rate in the cognitive operations market. Enterprises may successfully identify, analyses, and address security issues across all IT operating processes with the use of security analytics. ITOA aids enterprises in identifying trends by connecting incident tickets to performance problems and infrastructure changes.
While the Small and Medium-sized Enterprises (SMEs) segment is anticipated to post a higher CAGR during the forecast period, the large enterprises segment is anticipated to account for a greater share of the market during that time. SMEs may obtain real-time data and make predictions about the future thanks to cognitive operations solutions.
It is anticipated that during the forecast period, the solutions sector would represent a bigger market share. The software tools sector is anticipated to have a bigger market share because cognitive operations software tools assist organizations in finding solutions for various IT operations activities, such as monitoring and managing vast and complex environments, more efficiently. During the projected period, however, the services segment is anticipated to expand more quickly.
The BFSI (Banking, Financial Services, and Insurance) sector is predicted to have the greatest market share in the cognitive operations industry among the verticals. During the projected period, the vertical in IT and telecom is anticipated to develop at the greatest CAGR. Cognitive operations solutions are used in the IT and telecom sector to mine the massive amounts of data created by user networks for important insights. The banking industry can analyze huge amounts of data to improve the client experience with the aid of cognitive operations capabilities.
[caption id="attachment_16324" align="aligncenter" width="1920"]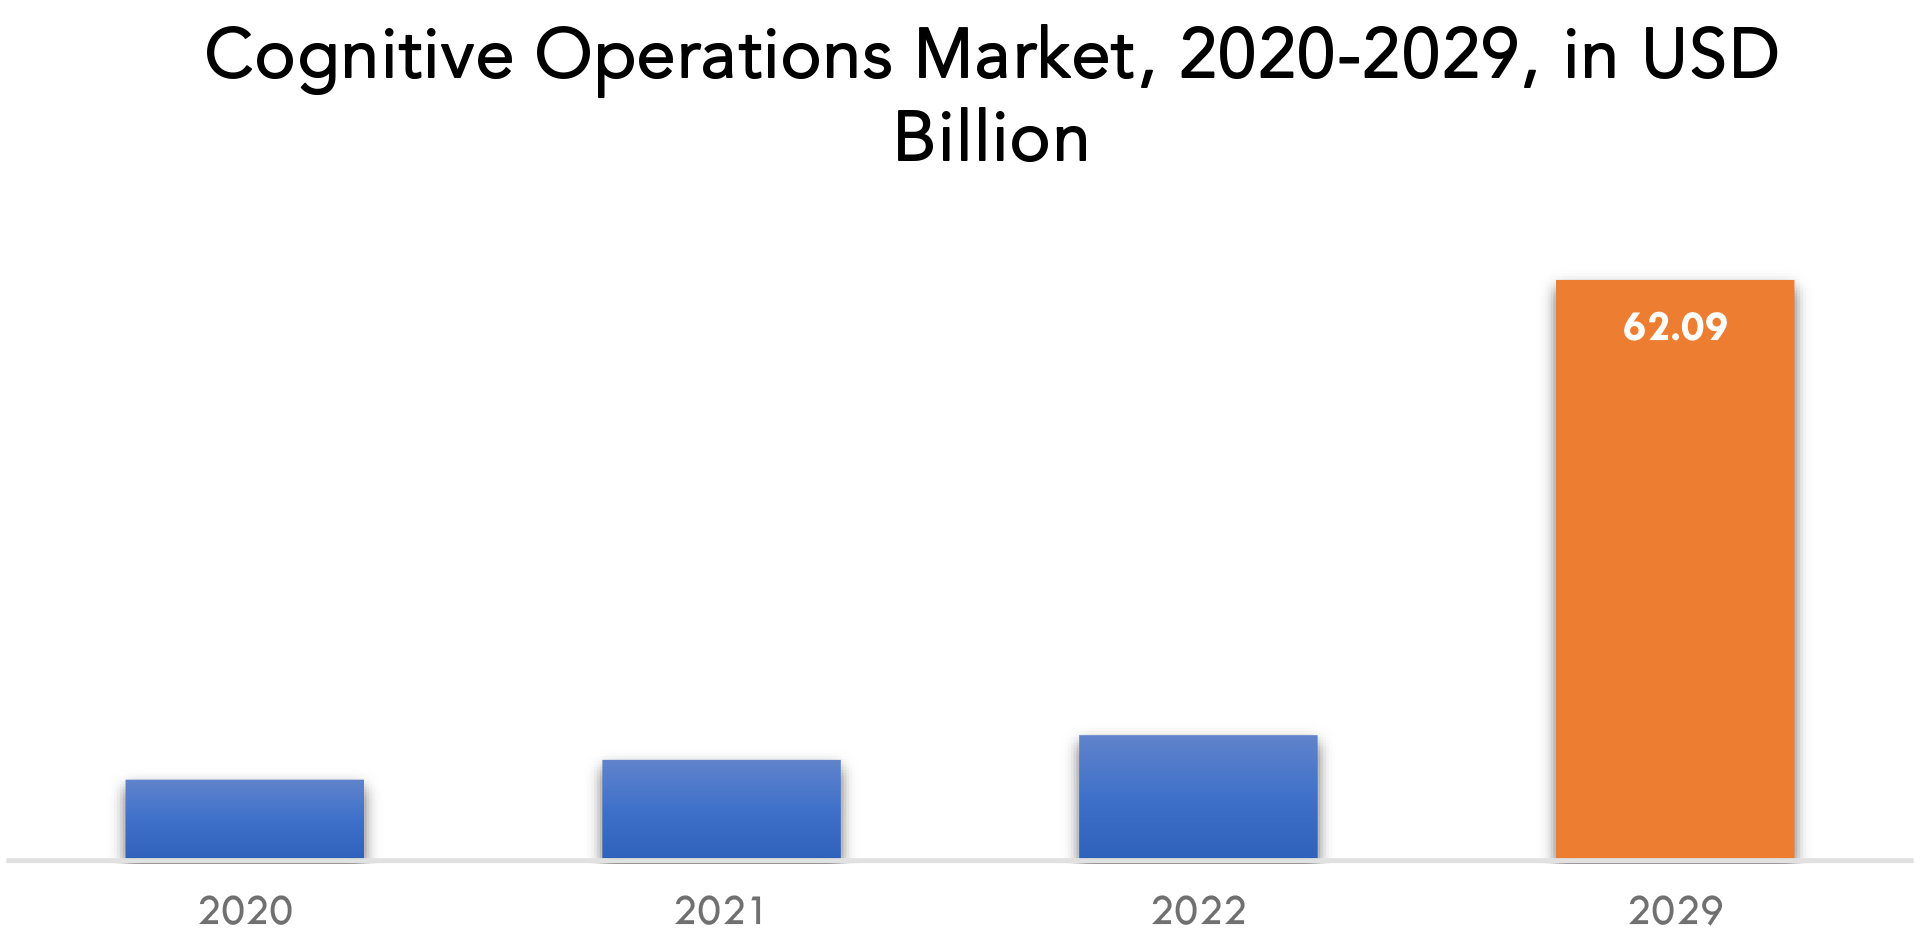
Global Cognitive Operations Market Players
Key competitors from both domestic and international markets compete fiercely in the worldwide global cognitive operations industry include IBM Corporation, Micro Focus International Plc, Broadcom Corporation, VMware Inc., Splunk Inc., CloudFabrix, Verge.io, Daikin, HCK Technologies, CA Technologies.
Recent News:- 12th August 2021, CloudFabrix and Verge.io announce strategic partnership to provide complete data center transformation. This partnership will combine CloudFabrix AI-based asset intelligence & operations with Verge.io data center virtualization operating system to provide a complete data center transformation for enterprise and channel service provider (CSP) organizations.
- 17th June 2021: IBM announced the closing of its acquisition of Turbonomic Inc., an application resource management (ARM) and Network Performance Management (NPM) software provider based in Boston, MA.
Who Should Buy? Or Key stakeholders
- Automotive Industries
- Research Organizations
- Value-added Resellers (VARs)
- Managed Service Provider
- System Integrators
- IT Directors or Consultants
- SMEs
- Cloud Service Providers
- Regulatory Authorities
- Cognitive Operations Solution Providers
- Investors
- Government
- Others
Global Cognitive Operations Market Regional Analysis
The Global Cognitive Operations Market by region includes North America, Asia-Pacific (APAC), Europe, South America, and Middle East & Africa (MEA).
- North America: includes the US, Canada, Mexico
- Asia Pacific: includes China, Japan, South Korea, India, Australia, ASEAN and Rest of APAC
- Europe: includes UK, Germany, France, Italy, Spain, Russia, and Rest of Europe
- South America: includes Brazil, Argentina and Rest of South America
- Middle East & Africa: includes Turkey, UAE, Saudi Arabia, South Africa, and Rest of MEA
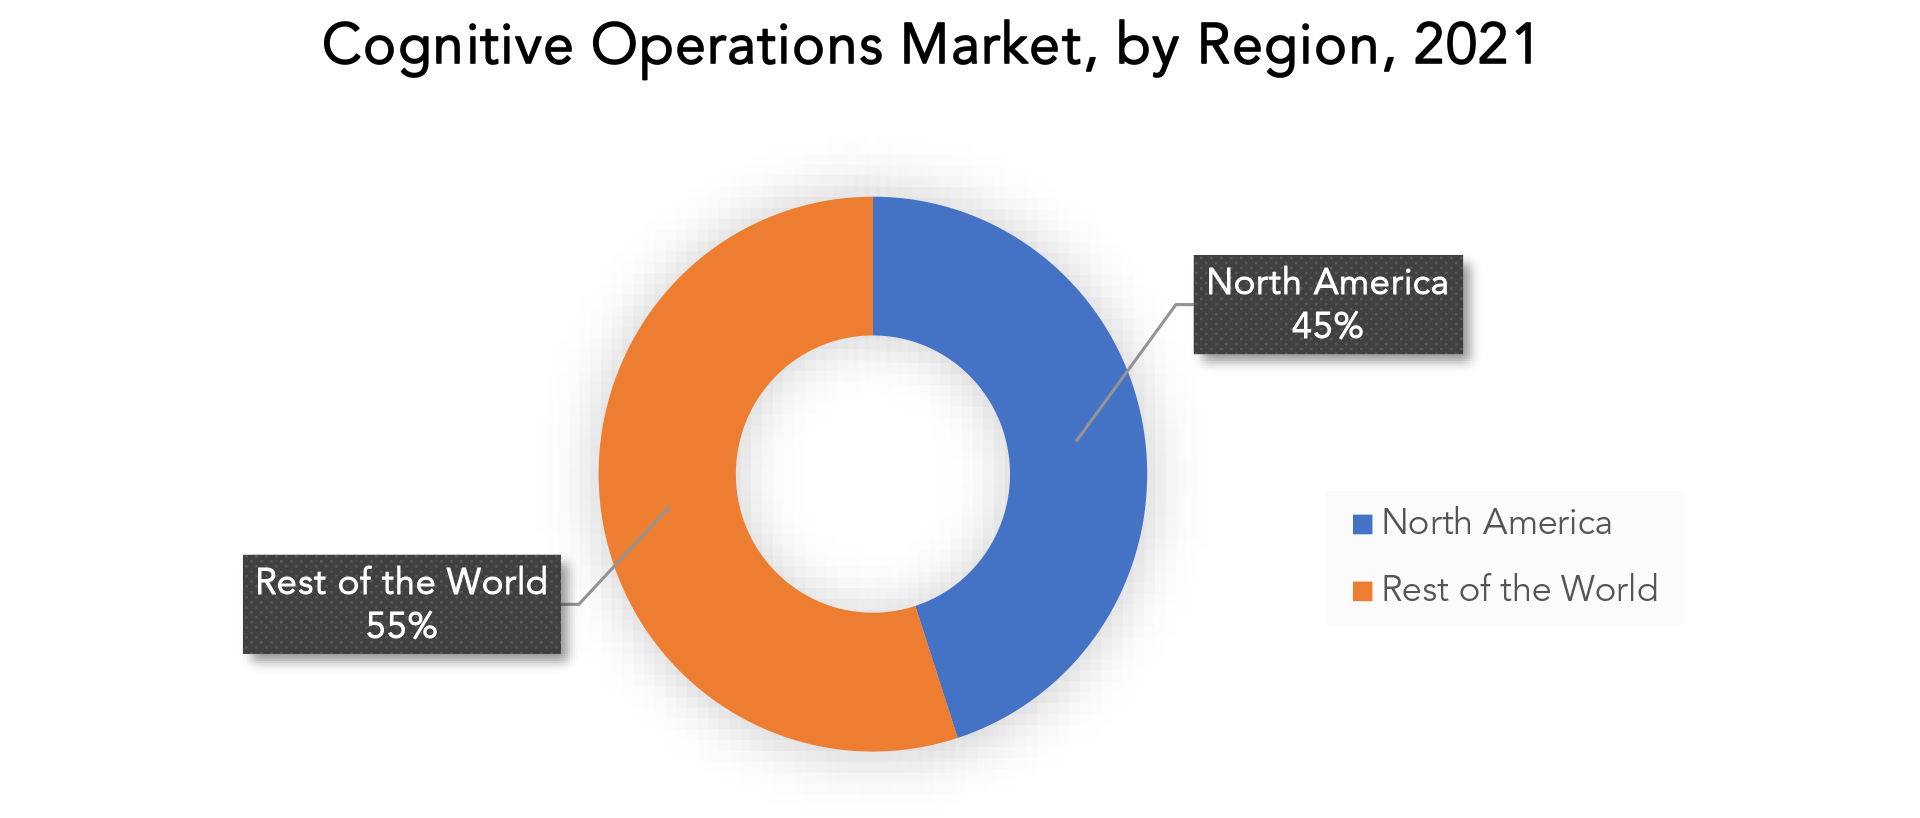
In terms of revenue, the cognitive operations market in 2021 will be dominated by the North American region. Increased adoption of the internet, IT infrastructure, robotics, sophisticated healthcare, and the quick integration of cognitive operations into these business processes have all boosted the market for cognitive operations in this region. The World Bank estimates that in 2020, more than 92% of North Americans will have access to the internet. As a result, internet penetration in this region will drive the market for cognitive operations in a variety of sectors, including fashion and retail, healthcare, manufacturing, transportation, and many others. APAC is expected to have the market's fastest growth.
Key Market Segments: Global Cognitive Operations Market
Global Cognitive Operations Market By Deployment Type, 2020-2029, (USD Billion)- Cloud
- On-Premise
- It Operations Analytics
- Infrastructure Management
- Network Analytics
- Security Analytics
- Large Enterprise
- SMES
- Solutions
- Services
- BFSI
- IT and Telecommunications
- Healthcare
- Media and Entertainment
- Manufacturing
- Retail and E-Commerce
- North America
- Europe
- Asia Pacific
- South America
- Middle East and Africa
Key Question Answered
- What is the expected growth rate of the cognitive operations market over the next 7 years?
- Who are the major players in the cognitive operations market and what is their market share?
- What are the end-user industries driving demand for market and what is their outlook?
- What are the opportunities for growth in emerging markets such as Asia-Pacific, Middle East, and Africa?
- How is the economic environment affecting the cognitive operations market, including factors such as interest rates, inflation, and exchange rates?
- What is the expected impact of government policies and regulations on the cognitive operations market?
- What is the current and forecasted size and growth rate of the global cognitive operations market?
- What are the key drivers of growth in the cognitive operations market?
- What are the distribution channels and supply chain dynamics in the cognitive operations market?
- What are the technological advancements and innovations in the cognitive operations market and their impact on product development and growth?
- What are the regulatory considerations and their impact on the market?
- What are the challenges faced by players in the cognitive operations market and how are they addressing these challenges?
- What are the opportunities for growth and expansion in the cognitive operations market?
- What are the service offerings and specifications of leading players in the market?
- What is the pricing trend of cognitive operations in the market and what is the impact of raw material prices on the price trend?
- INTRODUCCIÓN
- DEFINICIÓN DE MERCADO
- SEGMENTACIÓN DEL MERCADO
- CRONOGRAMAS DE INVESTIGACIÓN
- SUPUESTOS Y LIMITACIONES
- METODOLOGÍA DE LA INVESTIGACIÓN
- MINERÍA DE DATOS
- INVESTIGACIÓN SECUNDARIA
- INVESTIGACIÓN PRIMARIA
- ASESORAMIENTO DE EXPERTOS EN LA MATERIA
- CONTROLES DE CALIDAD
- REVISIÓN FINAL
- TRIANGULACIÓN DE DATOS
- ENFOQUE DE ABAJO HACIA ARRIBA
- ENFOQUE DE ARRIBA HACIA ABAJO
- FLUJO DE INVESTIGACIÓN
- FUENTES DE DATOS
- MINERÍA DE DATOS
- RESUMEN EJECUTIVO
- PANORAMA DEL MERCADO
- PERSPECTIVAS DEL MERCADO GLOBAL DE OPERACIONES COGNITIVAS
- IMPULSORES DEL MERCADO
- RESTRICCIONES DEL MERCADO
- OPORTUNIDADES DE MERCADO
- IMPACTO DEL COVID-19 EN EL MERCADO DE OPERACIONES COGNITIVAS
- MODELO DE LAS CINCO FUERZAS DE PORTER
- THREAT FROM NEW ENTRANTS
- THREAT FROM SUBSTITUTES
- BARGAINING POWER OF SUPPLIERS
- BARGAINING POWER OF CUSTOMERS
- DEGREE OF COMPETITION
- INDUSTRY VALUE CHAIN ANALYSIS
- PERSPECTIVAS DEL MERCADO GLOBAL DE OPERACIONES COGNITIVAS
- GLOBAL COGNITIVE OPERATIONS MARKET BY DEPLOYMENT TYPE, 2020-2029, (USD BILLION)
- CLOUD
- ON-PREMISE
- GLOBAL COGNITIVE OPERATIONS MARKET BY APPLICATION, 2020-2029, (USD BILLION)
- IT OPERATIONS ANALYTICS
- INFRASTRUCTURE MANAGEMENT
- NETWORK ANALYTICS
- SECURITY ANALYTICS
- GLOBAL COGNITIVE OPERATIONS MARKET BY ENTERPRISE SIZE, 2020-2029, (USD BILLION)
- LARGE ENTERPRISE
- SMES
- GLOBAL COGNITIVE OPERATIONS MARKET BY COMPONENT, 2020-2029, (USD BILLION)
- SOLUTIONS
- SERVICES
- GLOBAL COGNITIVE OPERATIONS MARKET BY INDUSTRIAL VERTICAL, 2020-2029, (USD BILLION)
- BFSI
- IT AND TELECOMMUNICATIONS
- HEALTHCARE
- MEDIA AND ENTERTAINMENT
- MANUFACTURING
- RETAIL AND E-COMMERCE
- GLOBAL COGNITIVE OPERATIONS MARKET BY REGION, 2020-2029, (USD BILLION), (THOUSAND UNITS)
- NORTH AMERICA
- US
- CANADA
- MEXICO
- SOUTH AMERICA
- BRAZIL
- ARGENTINA
- COLOMBIA
- REST OF SOUTH AMERICA
- EUROPE
- GERMANY
- UK
- FRANCE
- ITALY
- SPAIN
- RUSSIA
- REST OF EUROPE
- ASIA PACIFIC
- INDIA
- CHINA
- JAPAN
- SOUTH KOREA
- AUSTRALIA
- SOUTH-EAST ASIA
- REST OF ASIA PACIFIC
- MIDDLE EAST AND AFRICA
- UAE
- SAUDI ARABIA
- SOUTH AFRICA
- REST OF MIDDLE EAST AND AFRICA
- NORTH AMERICA
- COMPANY PROFILES*
(BUSINESS OVERVIEW, COMPANY SNAPSHOT, PRODUCTS OFFERED, RECENT DEVELOPMENTS)
- IBM CORPORATION
- MICRO FOCUS INTERNATIONAL PLC
- BROADCOM CORPORATION
- VMWARE INC.
- SPLUNK INC.
- CLOUDFABRIX
- IO
- DAIKIN
- HCL TECHNOLOGIES
- CA TECHNOLOGIES
*THE COMPANY LIST IS INDICATIVE
LIST OF TABLES
TABLE 1 GLOBAL COGNITIVE OPERATIONS MARKET BY DEPLOYMENT TYPE (USD BILLION) 2020-2029
TABLE 2 GLOBAL COGNITIVE OPERATIONS MARKET BY APPLICATION (USD BILLION) 2020-2029
TABLE 3 GLOBAL COGNITIVE OPERATIONS MARKET BY ENTERPRISE SIZE (USD BILLION) 2020-2029
TABLE 4 GLOBAL COGNITIVE OPERATIONS MARKET BY COMPONENT (USD BILLION) 2020-2029
TABLE 5 GLOBAL COGNITIVE OPERATIONS MARKET BY INDUSTRY VERTICAL (USD BILLION) 2020-2029
TABLE 6 GLOBAL COGNITIVE OPERATIONS MARKET BY REGION (USD BILLION) 2020-2029
TABLE 7 NORTH AMERICA COGNITIVE OPERATIONS MARKET BY COUNTRY (USD BILLION) 2020-2029
TABLE 8 NORTH AMERICA COGNITIVE OPERATIONS MARKET BY DEPLOYMENT TYPE (USD BILLION) 2020-2029
TABLE 9 NORTH AMERICA COGNITIVE OPERATIONS MARKET BY APPLICATION (USD BILLION) 2020-2029
TABLE 10 NORTH AMERICA COGNITIVE OPERATIONS MARKET BY ENTERPRISE SIZE (USD BILLION) 2020-2029
TABLE 11 NORTH AMERICA COGNITIVE OPERATIONS MARKET BY COMPONENT (USD BILLION) 2020-2029
TABLE 12 NORTH AMERICA COGNITIVE OPERATIONS MARKET BY INDUSTRY VERTICAL (USD BILLION) 2020-2029
TABLE 13 US COGNITIVE OPERATIONS MARKET BY DEPLOYMENT TYPE (USD BILLION) 2020-2029
TABLE 14 US COGNITIVE OPERATIONS MARKET BY APPLICATION (USD BILLION) 2020-2029
TABLE 15 US COGNITIVE OPERATIONS MARKET BY ENTERPRISE SIZE (USD BILLION) 2020-2029
TABLE 16 US COGNITIVE OPERATIONS MARKET BY COMPONENT (USD BILLION) 2020-2029
TABLE 17 US COGNITIVE OPERATIONS MARKET BY INDUSTRY VERTICAL (USD BILLION) 2020-2029
TABLE 18 CANADA COGNITIVE OPERATIONS MARKET BY DEPLOYMENT TYPE (USD BILLION) 2020-2029
TABLE 19 CANADA COGNITIVE OPERATIONS MARKET BY APPLICATION (USD BILLION) 2020-2029
TABLE 20 CANADA COGNITIVE OPERATIONS MARKET BY ENTERPRISE SIZE (USD BILLION) 2020-2029
TABLE 21 CANADA COGNITIVE OPERATIONS MARKET BY COMPONENT (USD BILLION) 2020-2029
TABLE 22 CANADA COGNITIVE OPERATIONS MARKET BY INDUSTRY VERTICAL (USD BILLION) 2020-2029
TABLE 23 MEXICO COGNITIVE OPERATIONS MARKET BY DEPLOYMENT TYPE (USD BILLION) 2020-2029
TABLE 24 MEXICO COGNITIVE OPERATIONS MARKET BY APPLICATION (USD BILLION) 2020-2029
TABLE 25 MEXICO COGNITIVE OPERATIONS MARKET BY ENTERPRISE SIZE (USD BILLION) 2020-2029
TABLE 26 MEXICO COGNITIVE OPERATIONS MARKET BY COMPONENT (USD BILLION) 2020-2029
TABLE 27 MEXICO COGNITIVE OPERATIONS MARKET BY INDUSTRY VERTICAL (USD BILLION) 2020-2029
TABLE 28 SOUTH AMERICA COGNITIVE OPERATIONS MARKET BY COUNTRY (USD BILLION) 2020-2029
TABLE 29 SOUTH AMERICA COGNITIVE OPERATIONS MARKET BY DEPLOYMENT TYPE (USD BILLION) 2020-2029
TABLE 30 SOUTH AMERICA COGNITIVE OPERATIONS MARKET BY APPLICATION (USD BILLION) 2020-2029
TABLE 31 SOUTH AMERICA COGNITIVE OPERATIONS MARKET BY ENTERPRISE SIZE (USD BILLION) 2020-2029
TABLE 32 SOUTH AMERICA COGNITIVE OPERATIONS MARKET BY COMPONENT (USD BILLION) 2020-2029
TABLE 33 SOUTH AMERICA COGNITIVE OPERATIONS MARKET BY INDUSTRY VERTICAL (USD BILLION) 2020-2029
TABLE 34 BRAZIL COGNITIVE OPERATIONS MARKET BY DEPLOYMENT TYPE (USD BILLION) 2020-2029
TABLE 35 BRAZIL COGNITIVE OPERATIONS MARKET BY APPLICATION (USD BILLION) 2020-2029
TABLE 36 BRAZIL COGNITIVE OPERATIONS MARKET BY ENTERPRISE SIZE (USD BILLION) 2020-2029
TABLE 37 BRAZIL COGNITIVE OPERATIONS MARKET BY COMPONENT (USD BILLION) 2020-2029
TABLE 38 BRAZIL COGNITIVE OPERATIONS MARKET BY INDUSTRY VERTICAL (USD BILLION) 2020-2029
TABLE 39 ARGENTINA COGNITIVE OPERATIONS MARKET BY DEPLOYMENT TYPE (USD BILLION) 2020-2029
TABLE 40 ARGENTINA COGNITIVE OPERATIONS MARKET BY APPLICATION (USD BILLION) 2020-2029
TABLE 41 ARGENTINA COGNITIVE OPERATIONS MARKET BY ENTERPRISE SIZE (USD BILLION) 2020-2029
TABLE 42 ARGENTINA COGNITIVE OPERATIONS MARKET BY COMPONENT (USD BILLION) 2020-2029
TABLE 43 ARGENTINA COGNITIVE OPERATIONS MARKET BY INDUSTRY VERTICAL (USD BILLION) 2020-2029
TABLE 44 COLOMBIA COGNITIVE OPERATIONS MARKET BY DEPLOYMENT TYPE (USD BILLION) 2020-2029
TABLE 45 COLOMBIA COGNITIVE OPERATIONS MARKET BY APPLICATION (USD BILLION) 2020-2029
TABLE 46 COLOMBIA COGNITIVE OPERATIONS MARKET BY ENTERPRISE SIZE (USD BILLION) 2020-2029
TABLE 47 COLOMBIA COGNITIVE OPERATIONS MARKET BY COMPONENT (USD BILLION) 2020-2029
TABLE 48 COLOMBIA COGNITIVE OPERATIONS MARKET BY INDUSTRY VERTICAL (USD BILLION) 2020-2029
TABLE 49 REST OF SOUTH AMERICA COGNITIVE OPERATIONS MARKET BY DEPLOYMENT TYPE (USD BILLION) 2020-2029
TABLE 50 REST OF SOUTH AMERICA COGNITIVE OPERATIONS MARKET BY APPLICATION (USD BILLION) 2020-2029
TABLE 51 REST OF SOUTH AMERICA COGNITIVE OPERATIONS MARKET BY ENTERPRISE SIZE (USD BILLION) 2020-2029
TABLE 52 REST OF SOUTH AMERICA COGNITIVE OPERATIONS MARKET BY COMPONENT (USD BILLION) 2020-2029
TABLE 53 REST OF SOUTH AMERICA COGNITIVE OPERATIONS MARKET BY INDUSTRY VERTICAL (USD BILLION) 2020-2029
TABLE 54 ASIA-PACIFIC COGNITIVE OPERATIONS MARKET BY COUNTRY (USD BILLION) 2020-2029
TABLE 55 ASIA-PACIFIC COGNITIVE OPERATIONS MARKET BY DEPLOYMENT TYPE (USD BILLION) 2020-2029
TABLE 56 ASIA-PACIFIC COGNITIVE OPERATIONS MARKET BY APPLICATION (USD BILLION) 2020-2029
TABLE 57 ASIA-PACIFIC COGNITIVE OPERATIONS MARKET BY ENTERPRISE SIZE (USD BILLION) 2020-2029
TABLE 58 ASIA-PACIFIC COGNITIVE OPERATIONS MARKET BY COMPONENT (USD BILLION) 2020-2029
TABLE 59 ASIA-PACIFIC COGNITIVE OPERATIONS MARKET BY INDUSTRY VERTICAL (USD BILLION) 2020-2029
TABLE 60 INDIA COGNITIVE OPERATIONS MARKET BY DEPLOYMENT TYPE (USD BILLION) 2020-2029
TABLE 61 INDIA COGNITIVE OPERATIONS MARKET BY APPLICATION (USD BILLION) 2020-2029
TABLE 62 INDIA COGNITIVE OPERATIONS MARKET BY ENTERPRISE SIZE (USD BILLION) 2020-2029
TABLE 63 INDIA COGNITIVE OPERATIONS MARKET BY COMPONENT (USD BILLION) 2020-2029
TABLE 64 INDIA COGNITIVE OPERATIONS MARKET BY INDUSTRY VERTICAL (USD BILLION) 2020-2029
TABLE 65 CHINA COGNITIVE OPERATIONS MARKET BY DEPLOYMENT TYPE (USD BILLION) 2020-2029
TABLE 66 CHINA COGNITIVE OPERATIONS MARKET BY APPLICATION (USD BILLION) 2020-2029
TABLE 67 CHINA COGNITIVE OPERATIONS MARKET BY ENTERPRISE SIZE (USD BILLION) 2020-2029
TABLE 68 CHINA COGNITIVE OPERATIONS MARKET BY COMPONENT (USD BILLION) 2020-2029
TABLE 69 CHINA COGNITIVE OPERATIONS MARKET BY INDUSTRY VERTICAL (USD BILLION) 2020-2029
TABLE 70 JAPAN COGNITIVE OPERATIONS MARKET BY DEPLOYMENT TYPE (USD BILLION) 2020-2029
TABLE 71 JAPAN COGNITIVE OPERATIONS MARKET BY APPLICATION (USD BILLION) 2020-2029
TABLE 72 JAPAN COGNITIVE OPERATIONS MARKET BY ENTERPRISE SIZE (USD BILLION) 2020-2029
TABLE 73 JAPAN COGNITIVE OPERATIONS MARKET BY COMPONENT (USD BILLION) 2020-2029
TABLE 74 JAPAN COGNITIVE OPERATIONS MARKET BY INDUSTRY VERTICAL (USD BILLION) 2020-2029
TABLE 75 SOUTH KOREA COGNITIVE OPERATIONS MARKET BY DEPLOYMENT TYPE (USD BILLION) 2020-2029
TABLE 76 SOUTH KOREA COGNITIVE OPERATIONS MARKET BY APPLICATION (USD BILLION) 2020-2029
TABLE 77 SOUTH KOREA COGNITIVE OPERATIONS MARKET BY ENTERPRISE SIZE (USD BILLION) 2020-2029
TABLE 78 SOUTH KOREA COGNITIVE OPERATIONS MARKET BY COMPONENT (USD BILLION) 2020-2029
TABLE 79 SOUTH KOREA COGNITIVE OPERATIONS MARKET BY INDUSTRY VERTICAL (USD BILLION) 2020-2029
TABLE 80 AUSTRALIA COGNITIVE OPERATIONS MARKET BY DEPLOYMENT TYPE (USD BILLION) 2020-2029
TABLE 81 AUSTRALIA COGNITIVE OPERATIONS MARKET BY APPLICATION (USD BILLION) 2020-2029
TABLE 82 AUSTRALIA COGNITIVE OPERATIONS MARKET BY ENTERPRISE SIZE (USD BILLION) 2020-2029
TABLE 83 AUSTRALIA COGNITIVE OPERATIONS MARKET BY COMPONENT (USD BILLION) 2020-2029
TABLE 84 AUSTRALIA COGNITIVE OPERATIONS MARKET BY INDUSTRY VERTICAL (USD BILLION) 2020-2029
TABLE 85 SOUTH-EAST ASIA COGNITIVE OPERATIONS MARKET BY DEPLOYMENT TYPE (USD BILLION) 2020-2029
TABLE 86 SOUTH-EAST ASIA COGNITIVE OPERATIONS MARKET BY APPLICATION (USD BILLION) 2020-2029
TABLE 87 SOUTH-EAST ASIA COGNITIVE OPERATIONS MARKET BY ENTERPRISE SIZE (USD BILLION) 2020-2029
TABLE 88 SOUTH-EAST ASIA COGNITIVE OPERATIONS MARKET BY COMPONENT (USD BILLION) 2020-2029
TABLE 89 SOUTH-EAST ASIA COGNITIVE OPERATIONS MARKET BY INDUSTRY VERTICAL (USD BILLION) 2020-2029
TABLE 90 REST OF ASIA PACIFIC COGNITIVE OPERATIONS MARKET BY DEPLOYMENT TYPE (USD BILLION) 2020-2029
TABLE 91 REST OF ASIA PACIFIC COGNITIVE OPERATIONS MARKET BY APPLICATION (USD BILLION) 2020-2029
TABLE 92 REST OF ASIA PACIFIC COGNITIVE OPERATIONS MARKET BY ENTERPRISE SIZE (USD BILLION) 2020-2029
TABLE 93 REST OF ASIA PACIFIC COGNITIVE OPERATIONS MARKET BY COMPONENT (USD BILLION) 2020-2029
TABLE 94 REST OF ASIA PACIFIC COGNITIVE OPERATIONS MARKET BY INDUSTRY VERTICAL (USD BILLION) 2020-2029
TABLE 95 EUROPE COGNITIVE OPERATIONS MARKET BY COUNTRY (USD BILLION) 2020-2029
TABLE 96 ASIA-PACIFIC COGNITIVE OPERATIONS MARKET BY DEPLOYMENT TYPE (USD BILLION) 2020-2029
TABLE 97 ASIA-PACIFIC COGNITIVE OPERATIONS MARKET BY APPLICATION (USD BILLION) 2020-2029
TABLE 98 ASIA-PACIFIC COGNITIVE OPERATIONS MARKET BY ENTERPRISE SIZE (USD BILLION) 2020-2029
TABLE 99 ASIA-PACIFIC COGNITIVE OPERATIONS MARKET BY COMPONENT (USD BILLION) 2020-2029
TABLE 100 ASIA-PACIFIC COGNITIVE OPERATIONS MARKET BY INDUSTRY VERTICAL (USD BILLION) 2020-2029
TABLE 101 GERMANY COGNITIVE OPERATIONS MARKET BY DEPLOYMENT TYPE (USD BILLION) 2020-2029
TABLE 102 GERMANY COGNITIVE OPERATIONS MARKET BY APPLICATION (USD BILLION) 2020-2029
TABLE 103 GERMANY COGNITIVE OPERATIONS MARKET BY ENTERPRISE SIZE (USD BILLION) 2020-2029
TABLE 104 GERMANY COGNITIVE OPERATIONS MARKET BY COMPONENT (USD BILLION) 2020-2029
TABLE 105 GERMANY COGNITIVE OPERATIONS MARKET BY INDUSTRY VERTICAL (USD BILLION) 2020-2029
TABLE 106 UK COGNITIVE OPERATIONS MARKET BY DEPLOYMENT TYPE (USD BILLION) 2020-2029
TABLE 107 UK COGNITIVE OPERATIONS MARKET BY APPLICATION (USD BILLION) 2020-2029
TABLE 108 UK COGNITIVE OPERATIONS MARKET BY ENTERPRISE SIZE (USD BILLION) 2020-2029
TABLE 109 UK COGNITIVE OPERATIONS MARKET BY COMPONENT (USD BILLION) 2020-2029
TABLE 110 UK COGNITIVE OPERATIONS MARKET BY INDUSTRY VERTICAL (USD BILLION) 2020-2029
TABLE 111 FRANCE COGNITIVE OPERATIONS MARKET BY DEPLOYMENT TYPE (USD BILLION) 2020-2029
TABLE 112 FRANCE COGNITIVE OPERATIONS MARKET BY APPLICATION (USD BILLION) 2020-2029
TABLE 113 FRANCE COGNITIVE OPERATIONS MARKET BY ENTERPRISE SIZE (USD BILLION) 2020-2029
TABLE 114 FRANCE COGNITIVE OPERATIONS MARKET BY COMPONENT (USD BILLION) 2020-2029
TABLE 115 FRANCE COGNITIVE OPERATIONS MARKET BY INDUSTRY VERTICAL (USD BILLION) 2020-2029
TABLE 116 ITALY COGNITIVE OPERATIONS MARKET BY DEPLOYMENT TYPE (USD BILLION) 2020-2029
TABLE 117 ITALY COGNITIVE OPERATIONS MARKET BY APPLICATION (USD BILLION) 2020-2029
TABLE 118 ITALY COGNITIVE OPERATIONS MARKET BY ENTERPRISE SIZE (USD BILLION) 2020-2029
TABLE 119 ITALY COGNITIVE OPERATIONS MARKET BY COMPONENT (USD BILLION) 2020-2029
TABLE 120 ITALY COGNITIVE OPERATIONS MARKET BY INDUSTRY VERTICAL (USD BILLION) 2020-2029
TABLE 121 SPAIN COGNITIVE OPERATIONS MARKET BY DEPLOYMENT TYPE (USD BILLION) 2020-2029
TABLE 122 SPAIN COGNITIVE OPERATIONS MARKET BY APPLICATION (USD BILLION) 2020-2029
TABLE 123 SPAIN COGNITIVE OPERATIONS MARKET BY ENTERPRISE SIZE (USD BILLION) 2020-2029
TABLE 124 SPAIN COGNITIVE OPERATIONS MARKET BY COMPONENT (USD BILLION) 2020-2029
TABLE 125 SPAIN COGNITIVE OPERATIONS MARKET BY INDUSTRY VERTICAL (USD BILLION) 2020-2029
TABLE 126 RUSSIA COGNITIVE OPERATIONS MARKET BY DEPLOYMENT TYPE (USD BILLION) 2020-2029
TABLE 127 RUSSIA COGNITIVE OPERATIONS MARKET BY APPLICATION (USD BILLION) 2020-2029
TABLE 128 RUSSIA COGNITIVE OPERATIONS MARKET BY ENTERPRISE SIZE (USD BILLION) 2020-2029
TABLE 129 RUSSIA COGNITIVE OPERATIONS MARKET BY COMPONENT (USD BILLION) 2020-2029
TABLE 130 RUSSIA COGNITIVE OPERATIONS MARKET BY INDUSTRY VERTICAL (USD BILLION) 2020-2029
TABLE 131 REST OF EUROPE COGNITIVE OPERATIONS MARKET BY DEPLOYMENT TYPE (USD BILLION) 2020-2029
TABLE 132 REST OF EUROPE COGNITIVE OPERATIONS MARKET BY APPLICATION (USD BILLION) 2020-2029
TABLE 133 REST OF EUROPE COGNITIVE OPERATIONS MARKET BY ENTERPRISE SIZE (USD BILLION) 2020-2029
TABLE 134 REST OF EUROPE COGNITIVE OPERATIONS MARKET BY COMPONENT (USD BILLION) 2020-2029
TABLE 135 REST OF EUROPE COGNITIVE OPERATIONS MARKET BY INDUSTRY VERTICAL (USD BILLION) 2020-2029
TABLE 136 MIDDLE EAST AND AFRICA COGNITIVE OPERATIONS MARKET BY COUNTRY (USD BILLION) 2020-2029
TABLE 137 MIDDLE EAST AND AFRICA COGNITIVE OPERATIONS MARKET BY DEPLOYMENT TYPE (USD BILLION) 2020-2029
TABLE 138 MIDDLE EAST AND AFRICA COGNITIVE OPERATIONS MARKET BY APPLICATION (USD BILLION) 2020-2029
TABLE 139 MIDDLE EAST AND AFRICA COGNITIVE OPERATIONS MARKET BY ENTERPRISE SIZE (USD BILLION) 2020-2029
TABLE 140 MIDDLE EAST AND AFRICA COGNITIVE OPERATIONS MARKET BY COMPONENT (USD BILLION) 2020-2029
TABLE 141 MIDDLE EAST AND AFRICA COGNITIVE OPERATIONS MARKET BY INDUSTRY VERTICAL (USD BILLION) 2020-2029
TABLE 142 UAE COGNITIVE OPERATIONS MARKET BY DEPLOYMENT TYPE (USD BILLION) 2020-2029
TABLE 143 UAE COGNITIVE OPERATIONS MARKET BY APPLICATION (USD BILLION) 2020-2029
TABLE 144 UAE COGNITIVE OPERATIONS MARKET BY ENTERPRISE SIZE (USD BILLION) 2020-2029
TABLE 145 UAE COGNITIVE OPERATIONS MARKET BY COMPONENT (USD BILLION) 2020-2029
TABLE 146 UAE COGNITIVE OPERATIONS MARKET BY INDUSTRY VERTICAL (USD BILLION) 2020-2029
TABLE 147 SAUDI ARABIA COGNITIVE OPERATIONS MARKET BY DEPLOYMENT TYPE (USD BILLION) 2020-2029
TABLE 148 SAUDI ARABIA COGNITIVE OPERATIONS MARKET BY APPLICATION (USD BILLION) 2020-2029
TABLE 149 SAUDI ARABIA COGNITIVE OPERATIONS MARKET BY ENTERPRISE SIZE (USD BILLION) 2020-2029
TABLE 150 SAUDI ARABIA COGNITIVE OPERATIONS MARKET BY COMPONENT (USD BILLION) 2020-2029
TABLE 151 SAUDI ARABIA COGNITIVE OPERATIONS MARKET BY INDUSTRY VERTICAL (USD BILLION) 2020-2029
TABLE 152 SOUTH AFRICA COGNITIVE OPERATIONS MARKET BY DEPLOYMENT TYPE (USD BILLION) 2020-2029
TABLE 153 SOUTH AFRICA COGNITIVE OPERATIONS MARKET BY APPLICATION (USD BILLION) 2020-2029
TABLE 154 SOUTH AFRICA COGNITIVE OPERATIONS MARKET BY ENTERPRISE SIZE (USD BILLION) 2020-2029
TABLE 155 SOUTH AFRICA COGNITIVE OPERATIONS MARKET BY COMPONENT (USD BILLION) 2020-2029
TABLE 156 SOUTH AFRICA COGNITIVE OPERATIONS MARKET BY INDUSTRY VERTICAL (USD BILLION) 2020-2029
TABLE 157 REST OF MIDDLE EAST AND AFRICA COGNITIVE OPERATIONS MARKET BY DEPLOYMENT TYPE (USD BILLION) 2020-2029
TABLE 158 REST OF MIDDLE EAST AND AFRICA COGNITIVE OPERATIONS MARKET BY APPLICATION (USD BILLION) 2020-2029
TABLE 159 REST OF MIDDLE EAST AND AFRICA COGNITIVE OPERATIONS MARKET BY ENTERPRISE SIZE (USD BILLION) 2020-2029
TABLE 160 REST OF MIDDLE EAST AND AFRICA COGNITIVE OPERATIONS MARKET BY COMPONENT (USD BILLION) 2020-2029
TABLE 161 REST OF MIDDLE EAST AND AFRICA COGNITIVE OPERATIONS MARKET BY INDUSTRY VERTICAL (USD BILLION) 2020-2029
LIST OF FIGURES
FIGURE 1 MARKET DYNAMICS
FIGURE 2 MARKET SEGMENTATION
FIGURE 3 REPORT TIMELINES: YEARS CONSIDERED
FIGURE 4 DATA TRIANGULATION
FIGURE 5 BOTTOM-UP APPROACH
FIGURE 6 TOP-DOWN APPROACH
FIGURE 7 RESEARCH FLOW
FIGURE 8 GLOBAL COGNITIVE OPERATIONS MARKET BY DEPLOYMENT TYPE, USD BILLION, 2020-2029
FIGURE 9 GLOBAL COGNITIVE OPERATIONS MARKET BY APPLICATION, USD BILLION, 2020-2029
FIGURE 10 GLOBAL COGNITIVE OPERATIONS MARKET BY ENTERPRISE SIZE, USD BILLION, 2020-2029
FIGURE 11 GLOBAL COGNITIVE OPERATIONS MARKET BY COMPONENT, USD BILLION, 2020-2029
FIGURE 12 GLOBAL COGNITIVE OPERATIONS MARKET BY INDUSTRIAL VERTICAL, USD BILLION, 2020-2029
FIGURE 13 GLOBAL COGNITIVE OPERATIONS MARKET BY REGION, USD BILLION, 2020-2029
FIGURE 14 PORTER’S FIVE FORCES MODEL
FIGURE 15 GLOBAL COGNITIVE OPERATIONS MARKET BY DEPLOYMENT TYPE, USD BILLION, 2021
FIGURE 16 GLOBAL COGNITIVE OPERATIONS MARKET BY APPLICATION, USD BILLION, 2021
FIGURE 17 GLOBAL COGNITIVE OPERATIONS MARKET BY ENTERPRISE SIZE, USD BILLION, 2021
FIGURE 18 GLOBAL COGNITIVE OPERATIONS MARKET BY COMPONENT, USD BILLION, 2021
FIGURE 19 GLOBAL COGNITIVE OPERATIONS MARKET BY INDUSTRIAL VERTICAL, USD BILLION, 2021
FIGURE 20 GLOBAL COGNITIVE OPERATIONS MARKET BY REGION, USD BILLION, 2021
FIGURE 21 NORTH AMERICA COGNITIVE OPERATIONS MARKET SNAPSHOT
FIGURE 22 EUROPE COGNITIVE OPERATIONS MARKET SNAPSHOT
FIGURE 23 SOUTH AMERICA COGNITIVE OPERATIONS MARKET SNAPSHOT
FIGURE 24 ASIA PACIFIC COGNITIVE OPERATIONS MARKET SNAPSHOT
FIGURE 25 MIDDLE EAST ASIA AND AFRICA COGNITIVE OPERATIONS MARKET SNAPSHOT
FIGURE 26 MARKET SHARE ANALYSIS
FIGURE 27 IBM CORPORATION: COMPANY SNAPSHOT
FIGURE 28 MICRO FOCUS INTERNATIONAL PLC: COMPANY SNAPSHOT
FIGURE 29 BROADCOM CORPORATION: COMPANY SNAPSHOT
FIGURE 30 VMWARE INC.: COMPANY SNAPSHOT
FIGURE 31 SPLUNK INC.: COMPANY SNAPSHOT
FIGURE 32 CLOUDFABRIX: COMPANY SNAPSHOT
FIGURE 33 VERGE.IO: COMPANY SNAPSHOT
FIGURE 34 DAIKIN: COMPANY SNAPSHOT
FIGURE 35 HCL TECHNOLOGIES: COMPANY SNAPSHOT
FIGURE 36 CA TECHNOLOGIES: COMPANY SNAPSHOT
DOWNLOAD FREE SAMPLE REPORT
License Type
SPEAK WITH OUR ANALYST
Want to know more about the report or any specific requirement?
WANT TO CUSTOMIZE THE REPORT?
Our Clients Speak
We asked them to research ‘ Equipment market’ all over the world, and their whole arrangement was helpful to us. thehealthanalytics.com insightful analysis and reports contributed to our current analysis and in creating a future strategy. Besides, the te
Yosuke Mitsui
Senior Associate Construction Equipment Sales & Marketing
We asked them to research ‘Equipment market’ all over the world, and their whole arrangement was helpful to us. thehealthanalytics.com insightful analysis and reports contributed to our current analysis and in creating a future strategy. Besides, the te


