

Base Year Value ()
x.x %
x.x %
CAGR ()
x.x %
x.x %
Forecast Year Value ()
x.x %
x.x %
Historical Data Period
Largest Region
Forecast Period
Mercado de materiales portátiles por tipo (siliconas, poliuretanos, elastómeros fluorados, otros), aplicación (electrónica de consumo, médica, industrial, otros) y región (Norteamérica, Europa, Sudamérica, Oriente Medio y África, Asia Pacífico) Tendencias globales y pronóstico de 2022 a 2029
Instant access to hundreds of data points and trends
- Market estimates from 2014-2029
- Competitive analysis, industry segmentation, financial benchmarks
- Incorporates SWOT, Porter's Five Forces and risk management frameworks
- PDF report or online database with Word, Excel and PowerPoint export options
- 100% money back guarantee
Descripción general del mercado de materiales portátiles
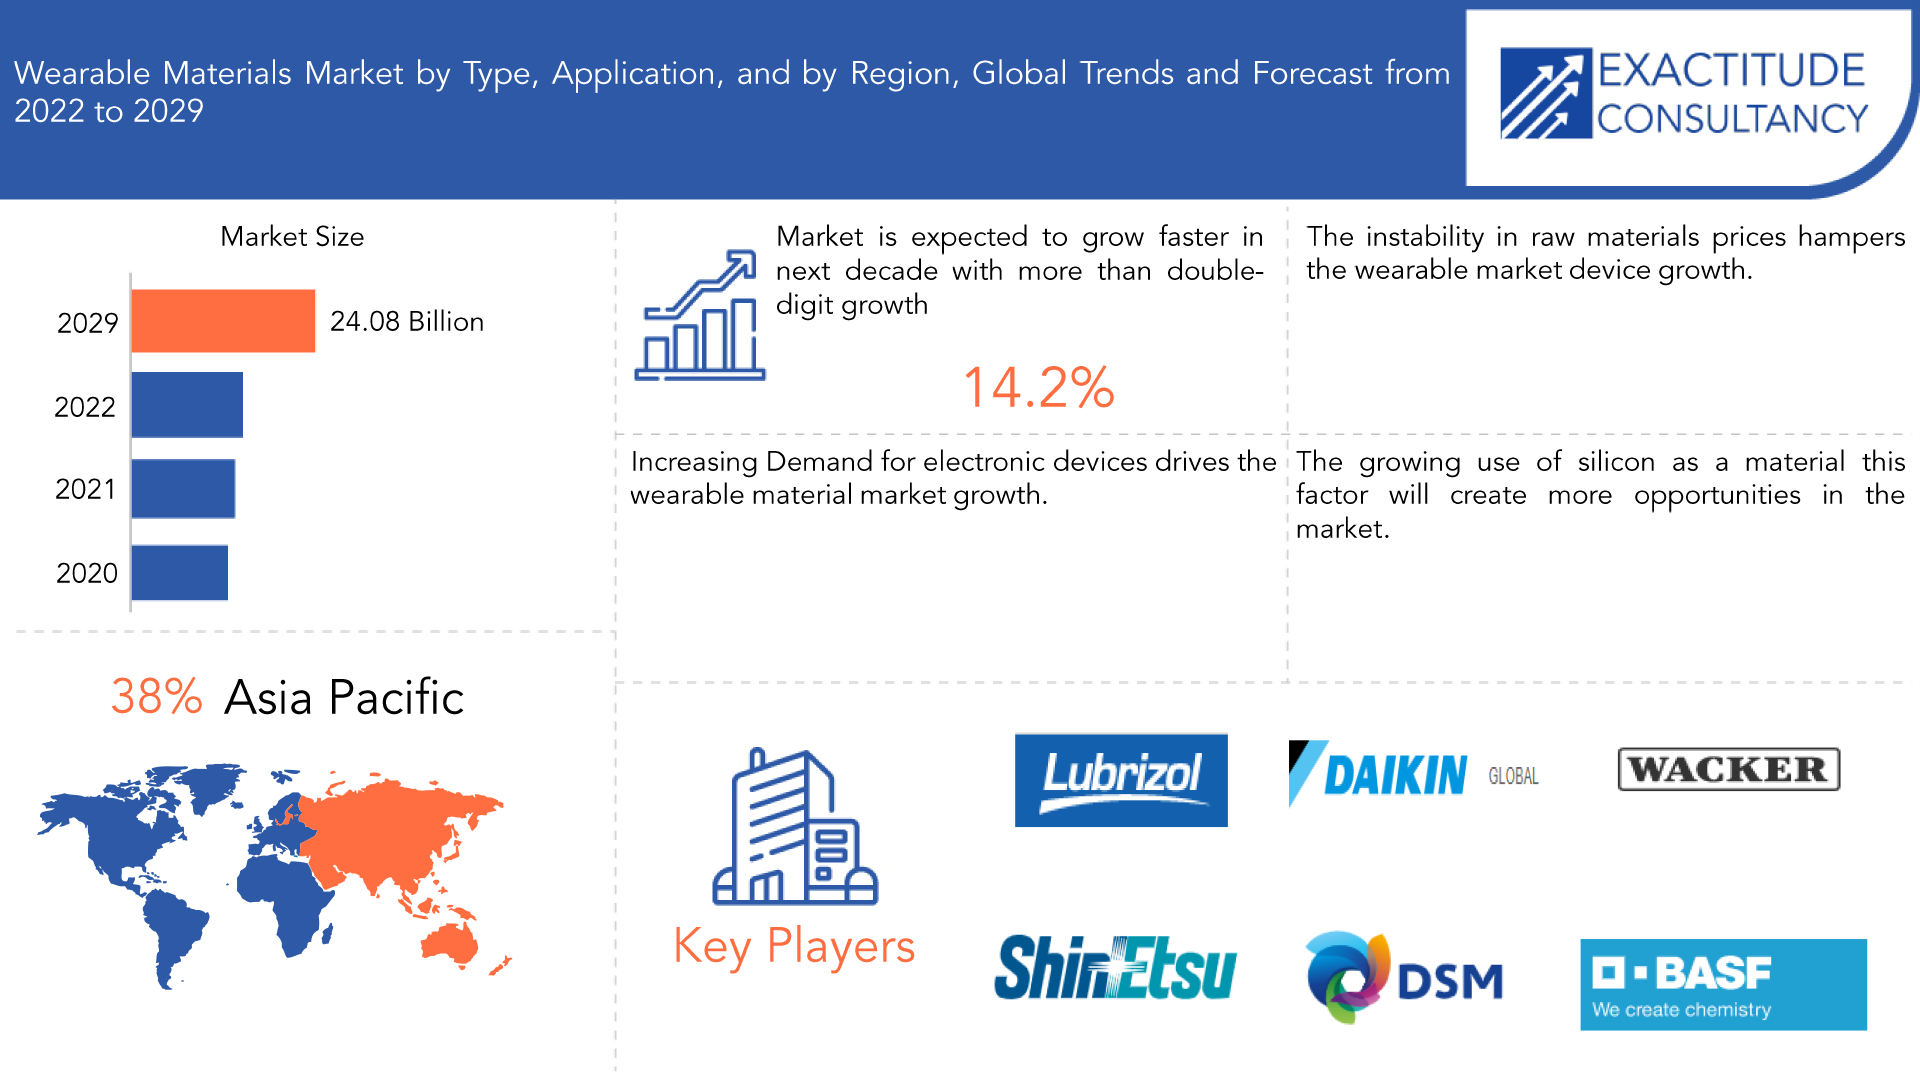
Se espera que el mercado mundial de materiales portátiles crezca a una tasa anual compuesta del 14,2 % entre 2020 y 2029. Se espera que alcance más de 24 080 millones de dólares en 2029, frente a los 1600 millones de dólares de 2020.
Un producto o dispositivo con capacidades informáticas integradas que ayudan al usuario a mejorar sus tareas diarias se denomina material ponible. Los materiales diseñados para usarse sobre el cuerpo se denominan materiales ponibles. La ropa , la ropa deportiva y la indumentaria médica son solo algunas aplicaciones de este tipo de materiales. Las tecnologías o dispositivos electrónicos que se pueden usar cómodamente sobre el cuerpo se conocen como wearables. Estos dispositivos tecnológicos ponibles se utilizan para rastrear datos en tiempo real. Tienen sensores de movimiento que capturan una imagen de su actividad diaria y la conectan con computadoras portátiles o dispositivos móviles.
| ATRIBUTO | DETALLES |
| Periodo de estudio | 2020-2029 |
| Año base | 2021 |
| Año estimado | 2022 |
| Año pronosticado | 2022-2029 |
| Periodo histórico | 2018-2020 |
| Unidad | Valor (miles de millones de USD), (kilotones) |
| Segmentación | Por tipo, por aplicación, por región |
| Por tipo |
|
| Por aplicación |
|
| Por región |
|
Los materiales portátiles son importantes porque pueden mantener a quienes los usan cómodos y seguros. Además, pueden aumentar la seguridad o el rendimiento al participar en una variedad de actividades. Varios artículos de alta gama están hechos de una variedad de materiales portátiles, que incluyen siliconas, poliuretanos , elastómeros fluorados y tereftalato de polietileno. Los relojes inteligentes, los rastreadores de actividad, los auriculares y los cascos son solo algunos ejemplos de los numerosos dispositivos electrónicos que utilizan ampliamente materiales portátiles. Muchos productos electrónicos, incluidos relojes inteligentes, rastreadores de actividad, auriculares y cascos, dependen en gran medida de materiales portátiles. Con el aumento de la producción y las ventas de productos electrónicos, la necesidad de productos electrónicos está aumentando a nivel internacional, y se prevé que este sea un factor que impulse la expansión del mercado en los próximos años.
El mercado de los materiales para vestir se verá afectado de forma significativa por factores como la reducción de los costes de los dispositivos gracias a la aparición de numerosos fabricantes, el aumento de la concienciación de los consumidores sobre las actividades relacionadas con la salud y el aumento del uso de sistemas de seguimiento de pacientes entre clientes de distintos perfiles de edad. Por otra parte, se prevé que el aumento de la inversión en la creación de un ecosistema vinculado presente perspectivas de mercado lucrativas para los materiales para vestir.
Se espera que el creciente uso de tecnología portátil en el sector de la salud aumente significativamente la demanda de materiales portátiles durante el período de pronóstico. La electrónica portátil tiene una demanda creciente en los países en desarrollo, lo que aumenta el uso de materiales portátiles. La industria de materiales portátiles está impulsada por el aumento de los ingresos disponibles en las economías emergentes y la mayor demanda de dispositivos portátiles asequibles. La pandemia ha aumentado el uso de tecnología portátil en la atención médica porque estos productos tienen ventajas y beneficios tanto para los pacientes como para los profesionales de la salud. Algunas de estas ventajas incluyen el monitoreo de la salud mediante estadísticas vitales en tiempo real y la detección temprana de enfermedades o eventos de riesgo. Dado que los consumidores dependen de estos dispositivos para el trabajo remoto, el seguimiento de la salud, las actividades de ejercicio y otros usos, las tecnologías portátiles y los auriculares han experimentado un rápido crecimiento.
La demanda de wearables asequibles y el aumento de los ingresos disponibles en los países emergentes han contribuido al crecimiento del mercado mundial de materiales wearables. Además, el uso creciente de tecnologías wearables en el campo médico para rastrear e identificar diversos problemas corporales es una de las variables que se prevé que impulsen la posible expansión del mercado en los próximos años. El uso creciente de dispositivos conectados y la Internet de las cosas (IoT) es otro factor importante que se prevé que impulse el mercado de materiales wearables durante el período de pronóstico.
[título id="attachment_18022" align="aligncenter" width="1920"]
Frequently Asked Questions
• What is the worth of the global Wearable Materials market?
The global wearable materials market is expected to grow at 14.2 % CAGR from 2020 to 2029. It is expected to reach above USD 24.08 billion by 2029 from USD 1.6 billion in 2020.
• What is the size of the Asia Pacific Wearable Materials industry?
Asia Pacific held more than 38% of the Wearable Materials market revenue share in 2020. Due to an increase in vendors offering goods with competitive features, China is anticipated to be one of the most significant nations in the Asia Pacific area market.
• What are some of the market's driving forces?
Increasing demand for fitness tracking wearable devices, Increasing popularity of the Internet of Things (IoT), and growing adoption of wearable materials in the medical sector are some factors that help to propel the market growth in the wearable materials
• Which are the top companies to hold the market share in the Wearable Materials market?
The wearable materials market key players include BASF, DowDuPont, Wacker Chemie, DSM, Arkema, Eastman Corporation, Shin-Etsu, Elkem, Momentive Performance Materials, Lubrizol, Alphabet Inc, Samsung Electronics Co., Ltd, Sony Cor.
Key Market Segments: Wearable Materials Market
Wearable Materials Market By Type, 2020-2029, (USD Billion), (Kilotons)- Silicones
- Fluor Elastomers
- Polyurethanes
- Others
- Consumer Electronics
- Medical
- Industrial
- Others
- North America
- Asia Pacific
- Europe
- Latin America
- Middle East And Africa
Exactitude Consultancy Services Key Objectives:
- Increasing sales and market share
- Developing new technology
- Improving profitability
- Entering new markets
- Enhancing brand reputation
Key Question Answered
- What is the current size of the wearable materials market?
- What is the expected growth rate of the wearable materials market over the next 5 years?
- Who are the major players in the wearable materials market and what is their market share?
- What are the end-user industries driving demand for the market and what is their outlook?
- What are the opportunities for growth in emerging markets such as Asia-pacific, the middle east, and Africa?
- How is the economic environment affecting the wearable materials market, including factors such as interest rates, inflation, and exchange rates?
- What is the expected impact of government policies and regulations on the wearable materials market?
- What is the current and forecasted size and growth rate of the global wearable materials market?
- What are the key drivers of growth in the wearable materials market?
- Who are the major players in the market and what is their market share?
- What are the wearable materials market's distribution channels and supply chain dynamics?
- What are the technological advancements and innovations in the wearable materials market and their impact on product development and growth?
- What are the regulatory considerations and their impact on the market?
- What are the challenges faced by players in the wearable materials market and how are they addressing these challenges?
- What are the opportunities for growth and expansion in the wearable materials market?
- What are the Product offerings specifications of leading players in the market?
- What is the pricing trend of wearable materials in the market?
Wearable Materials Market Segment Analysis
The global wearable materials market is segmented based on application, type, and region. By type, the market is bifurcated into Silicones, Polyurethanes, Fluor elastomers, and others. By application, the market is bifurcated into consumer electronics, medical, Industrial, and Others.
Based on the type of silicone segment dominating the market. Silicon and oxygen are combined to form silicones. They are easily moldable into any shape, lightweight, flexible, and inert to water and air. The most popular kind of silicone is silicone rubber, which is used in products like cookware, shower curtains, gaskets, and other places where a stretchy rubber-like materials is required. Silicone is regarded as biocompatible and has a wide range of uses in skin care products, such as peel-and-stick skin care products and wearable medical devices made of silicone with biomedical grade. In addition, they are significantly more permeable than any other organic polymer, increasing patient comfort. These materials provide more comfort and a better fit by easily conforming to body shapes.
Based on the application consumer electronics segment is dominating the market. In 2022, the consumer electronics application category dominated the market and accounted for the highest revenue share of more than 48.95%. A significant proportion of this market can be attributed to the rise in wearable technologies, such as fitness bands and AR/VR headsets. Numerous producers, like Apple Inc., Garmin Ltd., Omron, and Nemaura, focus on developing devices that give data that includes both clinical and non-clinical information. For instance, Nemaura's sugar beet Wearable Technology allows frequent blood glucose monitoring in diabetic patients, eliminating the need for daily finger-prick calibration. The rising popularity of health and fitness trackers is the factor driving this industry. The industrial application segment of the wearable materials market is anticipated to develop the greatest share during the forecast period.
[caption id="attachment_18024" align="aligncenter" width="1920"]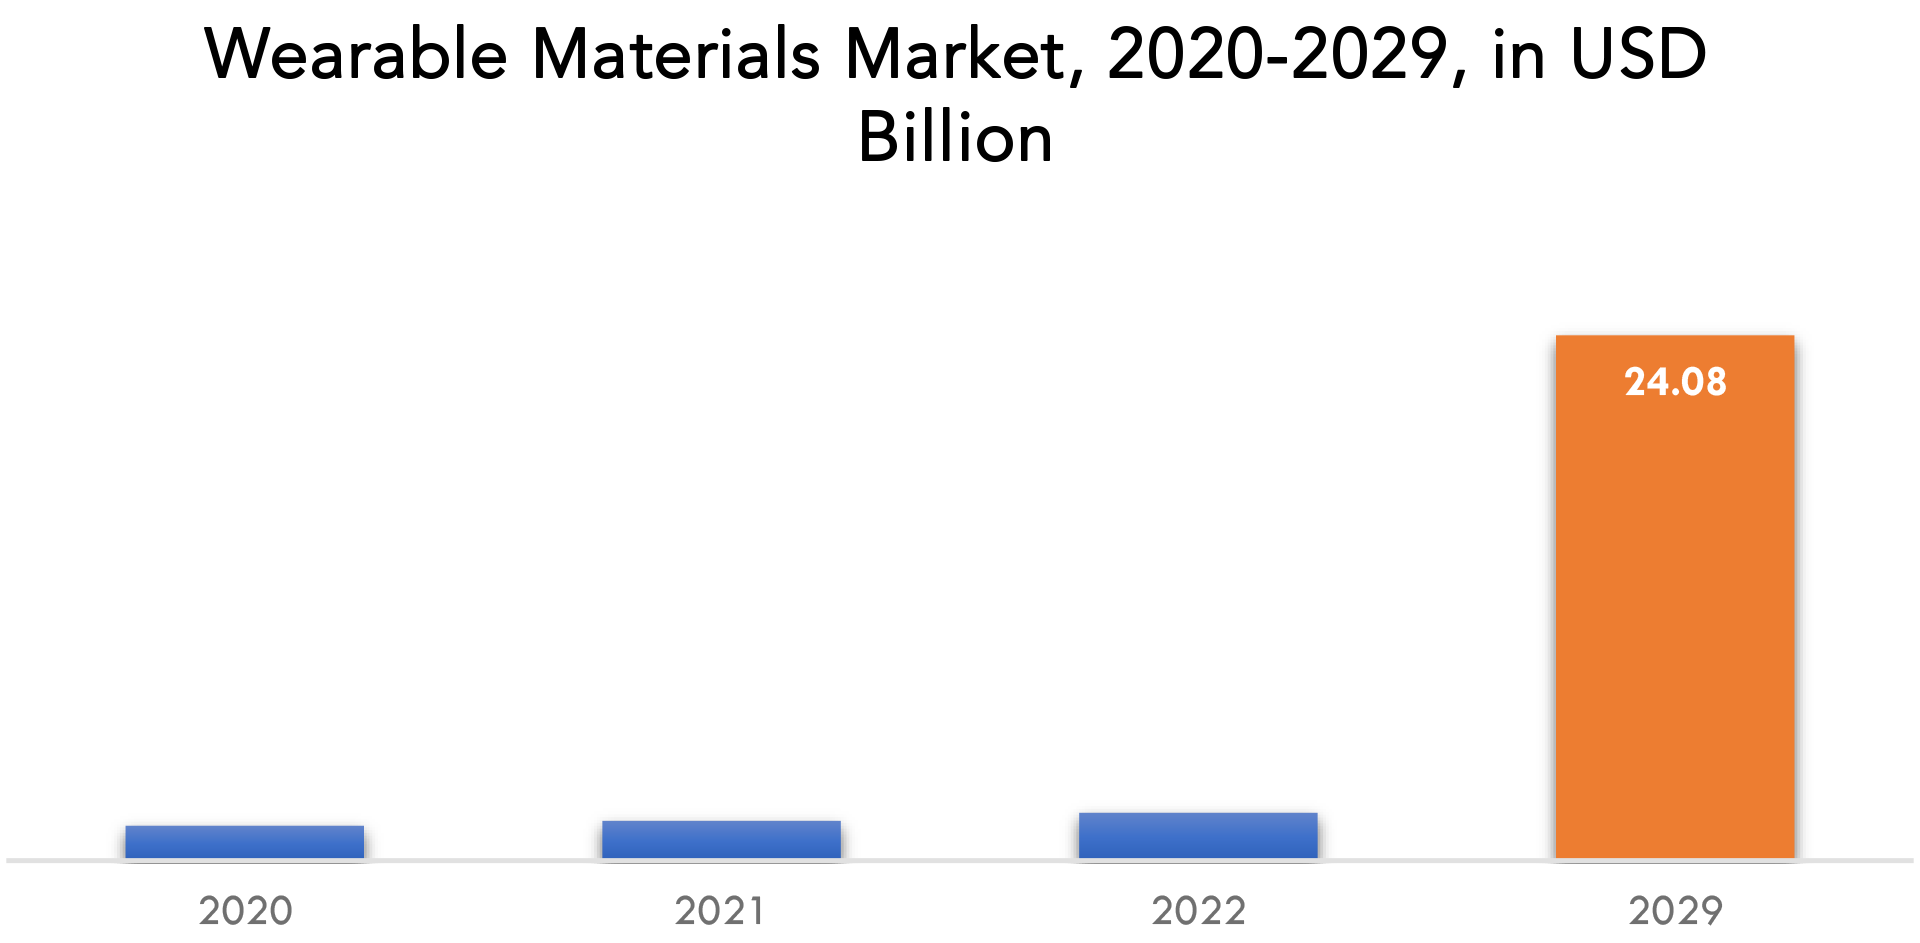
Wearable Materials Market Key Players
The wearable materials market key players include BASF, DowDuPont, Wacker Chemie, DSM, Arkema, Eastman Corporation, Shin-Etsu, Elkem, Momentive Performance Materials, Emerald Performance Materials, Daikin Chemicals, Solvay, 3M, Covestro, Lubrizol, Alphabet Inc, Samsung Electronics Co., Ltd, Sony Cor.
Industry Development:
Shin-Etsu Chemical announced the creation of electrophysiological dry electrodes and high-elasticity wiring materials for cutting-edge wearable technology in December 2021. Elkem announced its investment plan to increase the production of specialized silicones at its upstream plant in France by 20,000 metric tons in October 2021. This increase in silicone production will help meet the demands of medical equipment and healthcare.Who Should Buy? Or Key stakeholders
- Wearable Materials Supplier
- Raw Materials Manufacturers
- Research Organizations
- Medical Industry
- Electrical & Electronics Industry
- Supply Chain Industries
- Investors
- Regulatory Authorities
- Industrial Sectors
- Others
Wearable Materials Market Regional Analysis
The wearable materials market by region includes North America, Asia-Pacific (APAC), Europe, South America, and Middle East & Africa (MEA).
- North America: includes the US, Canada, Mexico
- Asia Pacific: includes China, Japan, South Korea, India, Australia, ASEAN, and the Rest of APAC
- Europe: includes the UK, Germany, France, Italy, Spain, Russia, and the Rest of Europe
- South America: includes Brazil, Argentina, and the Rest of South America
- Middle East & Africa: includes Turkey, UAE, Saudi Arabia, South Africa, and the Rest of MEA
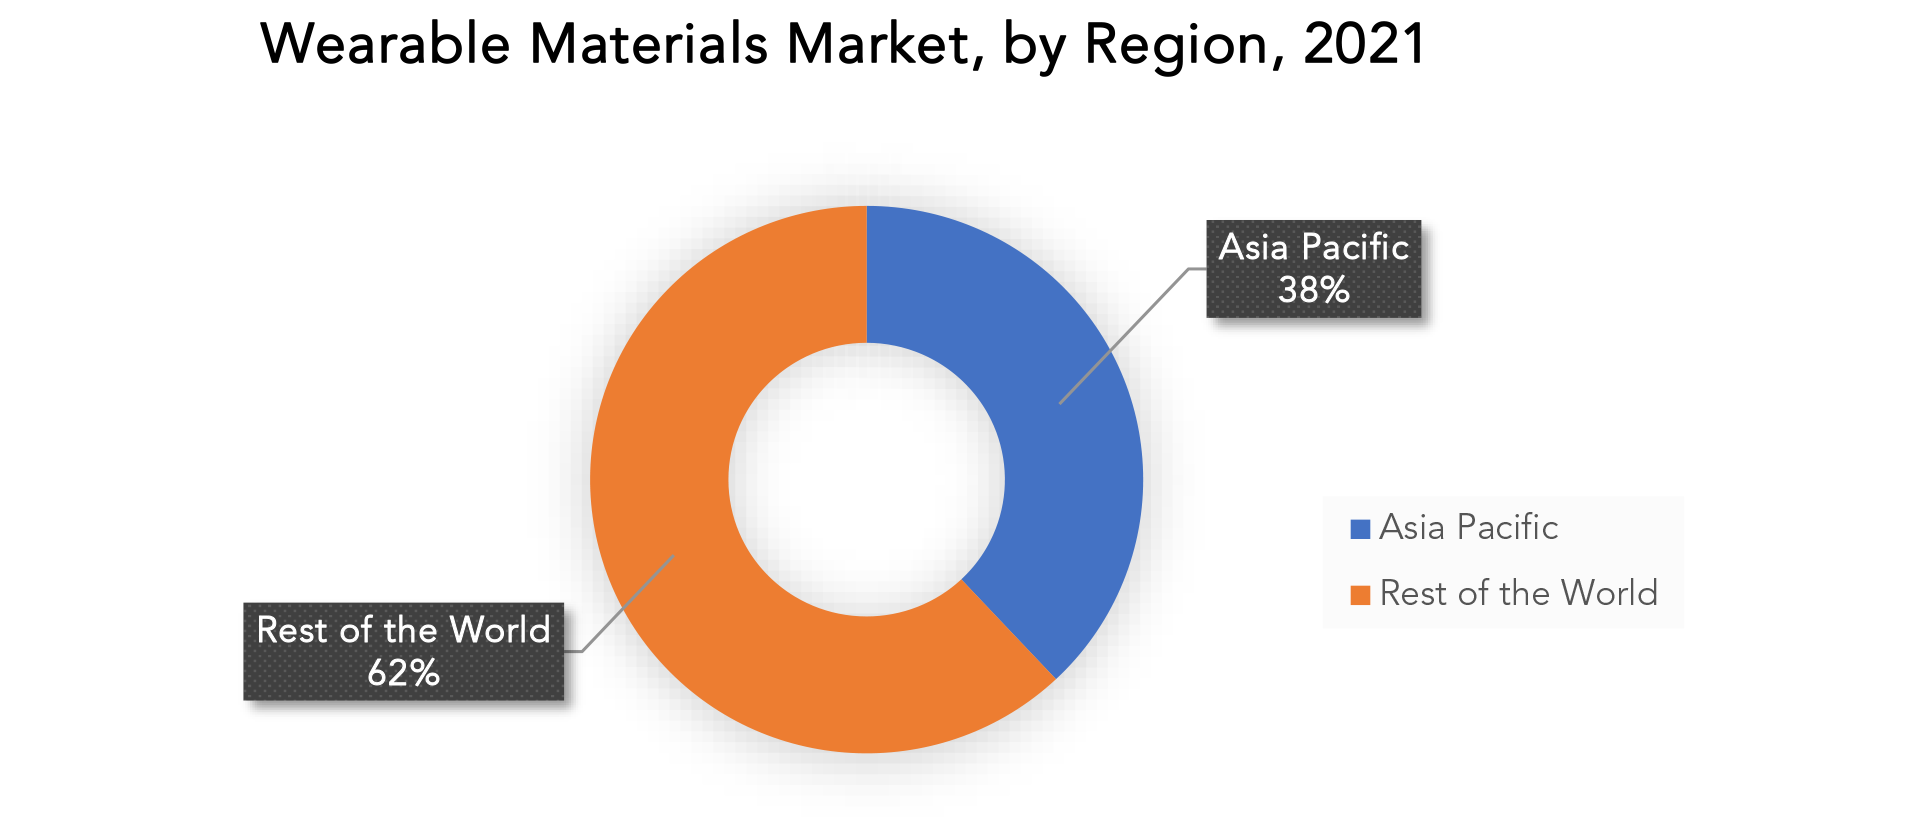
Asia Pacific accounted for the largest market in the wearable materials market. Due to an increase in vendors offering goods with competitive features, China is anticipated to be one of the most significant nations in the Asia Pacific area market. The declining costs of smartphones, which are forecast to reduce even further shortly, are also expected to fuel demand for wearable technology in the nation. Manufacturers can lower product prices with increased production volumes due to the increasing demand from various target client groups.
The market for wearable materials in the region is being driven by the expanding electronics sector and the rapidly rising disposable income in the area. In addition, favorable government initiatives for manufacturing & export promotion are also expected to boost regional growth over the next few years such as the Make in India initiative undertaken by the Indian Government which will create a business-friendly environment thereby driving industry expansion at a faster pace than in North America or Europe during 2022 - 2029 period.
North America accounted for the second largest market in the wearable devices market. Major growth factors for the regional market have been the high adoption of technology and the simplicity with which freshly released goods are made available. In the region, there is a larger need for devices that support wellness, enable preventive care, and help in managing chronic illnesses. 30% of Americans use wearable medical equipment, according to the National Library of Medicine.
- INTRODUCCIÓN
- DEFINICIÓN DE MERCADO
- SEGMENTACIÓN DEL MERCADO
- CRONOGRAMAS DE INVESTIGACIÓN
- SUPUESTOS Y LIMITACIONES
- METODOLOGÍA DE LA INVESTIGACIÓN
- MINERÍA DE DATOS
- INVESTIGACIÓN SECUNDARIA
- INVESTIGACIÓN PRIMARIA
- ASESORAMIENTO DE EXPERTOS EN LA MATERIA
- CONTROLES DE CALIDAD
- REVISIÓN FINAL
- TRIANGULACIÓN DE DATOS
- ENFOQUE DE ABAJO HACIA ARRIBA
- ENFOQUE DE ARRIBA HACIA ABAJO
- FLUJO DE INVESTIGACIÓN
- FUENTES DE DATOS
- MINERÍA DE DATOS
- RESUMEN EJECUTIVO
- PANORAMA DEL MERCADO
- PERSPECTIVAS DEL MERCADO MUNDIAL DE MATERIALES PORTÁTILES
- IMPULSORES DEL MERCADO
- RESTRICCIONES DEL MERCADO
- OPORTUNIDADES DE MERCADO
- IMPACTO DEL COVID-19 EN EL MERCADO DE MATERIALES PORTÁTILES
- MODELO DE LAS CINCO FUERZAS DE PORTER
- AMENAZA DE NUEVOS INGRESANTES
- AMENAZA DE SUSTITUTOS
- PODER DE NEGOCIACIÓN DE LOS PROVEEDORES
- PODER DE NEGOCIACIÓN DE LOS CLIENTES
- GRADO DE COMPETENCIA
- ANÁLISIS DE LA CADENA DE VALOR DE LA INDUSTRIA
- PERSPECTIVAS DEL MERCADO MUNDIAL DE MATERIALES PORTÁTILES
- MERCADO GLOBAL DE MATERIALES PORTÁTILES POR TIPO, 2020-2029, (MILES DE MILLONES DE USD), (KILOTONELADAS)
- SILICONA
- ELASTÓMEROS DE FLUOR
- POLIURETANOS
- OTROS
- MERCADO GLOBAL DE MATERIALES PORTÁTILES POR APLICACIÓN, 2020-2029, (MILES DE MILLONES DE USD) (KILOTONELADAS)
- ELECTRÓNICA DE CONSUMO
- MÉDICO
- INDUSTRIAL
- OTHERS
- GLOBAL WEARABLE MATERIALS MARKET BY REGION, 2020-2029, (USD BILLION), (KILOTONS)
- NORTH AMERICA
- US
- CANADA
- MEXICO
- SOUTH AMERICA
- BRAZIL
- ARGENTINA
- COLOMBIA
- REST OF SOUTH AMERICA
- EUROPE
- GERMANY
- UK
- FRANCE
- ITALY
- SPAIN
- RUSSIA
- REST OF EUROPE
- ASIA PACIFIC
- INDIA
- CHINA
- JAPAN
- SOUTH KOREA
- AUSTRALIA
- SOUTH-EAST ASIA
- REST OF ASIA PACIFIC
- MIDDLE EAST AND AFRICA
- UAE
- SAUDI ARABIA
- SOUTH AFRICA
- REST OF MIDDLE EAST AND AFRICA
- NORTH AMERICA
- COMPANY PROFILES*
(BUSINESS OVERVIEW, COMPANY SNAPSHOT, PRODUCTS OFFERED, RECENT DEVELOPMENTS)
- BASF
- DOWDUPONT
- WACKER CHEMIE
- DSM
- ARKEMA
- EASTMAN CORPORATION
- SHIN-ETSU
- ELKEM
- MOMENTIVE PERFORMANCE MATERIALS
- LUBRIZOL
*THE COMPANY LIST IS INDICATIVE
LIST OF TABLES
TABLE 1 GLOBAL WEARABLE MATERIAL MARKET BY TYPE (USD BILLION) 2020-2029
TABLE 2 GLOBAL WEARABLE MATERIAL MARKET BY TYPE (KILOTONS) 2020-2029
TABLE 3 GLOBAL WEARABLE MATERIAL MARKET BY APPLICATION (USD BILLION) 2020-2029
TABLE 4 GLOBAL WEARABLE MATERIAL MARKET BY APPLICATION (KILOTONS) 2020-2029
TABLE 5 GLOBAL WEARABLE MATERIAL MARKET BY REGION (USD BILLION) 2020-2029
TABLE 6 GLOBAL WEARABLE MATERIAL MARKET BY REGION (KILOTONS) 2020-2029
TABLE 7 NORTH AMERICA WEARABLE MATERIAL MARKET BY COUNTRY (USD BILLION) 2020-2029
TABLE 8 NORTH AMERICA WEARABLE MATERIAL MARKET BY COUNTRY (KILOTONS) 2020-2029
TABLE 9 NORTH AMERICA WEARABLE MATERIAL MARKET BY TYPE (USD BILLION) 2020-2029
TABLE 10 NORTH AMERICA WEARABLE MATERIAL MARKET BY TYPE (KILOTONS) 2020-2029
TABLE 11 NORTH AMERICA WEARABLE MATERIAL MARKET BY APPLICATION (USD BILLION) 2020-2029
TABLE 12 NORTH AMERICA WEARABLE MATERIAL MARKET BY APPLICATION (KILOTONS) 2020-2029
TABLE 13 US WEARABLE MATERIAL MARKET BY TYPE (USD BILLION) 2020-2029
TABLE 14 US WEARABLE MATERIAL MARKET BY TYPE (KILOTONS) 2020-2029
TABLE 15 US WEARABLE MATERIAL MARKET BY APPLICATION (USD BILLION) 2020-2029
TABLE 16 US WEARABLE MATERIAL MARKET BY APPLICATION (KILOTONS) 2020-2029
TABLE 17 CANADA WEARABLE MATERIAL MARKET BY TYPE (USD BILLION) 2020-2029
TABLE 18 CANADA WEARABLE MATERIAL MARKET BY TYPE (KILOTONS) 2020-2029
TABLE 19 CANADA WEARABLE MATERIAL MARKET BY APPLICATION (USD BILLION) 2020-2029
TABLE 20 CANADA WEARABLE MATERIAL MARKET BY APPLICATION (KILOTONS) 2020-2029
TABLE 21 MEXICO WEARABLE MATERIAL MARKET BY TYPE (USD BILLION) 2020-2029
TABLE 22 MEXICO WEARABLE MATERIAL MARKET BY TYPE (KILOTONS) 2020-2029
TABLE 23 MEXICO WEARABLE MATERIAL MARKET BY APPLICATION (USD BILLION) 2020-2029
TABLE 24 MEXICO WEARABLE MATERIAL MARKET BY APPLICATION (KILOTONS) 2020-2029
TABLE 25 SOUTH AMERICA WEARABLE MATERIAL MARKET BY COUNTRY (USD BILLION) 2020-2029
TABLE 26 SOUTH AMERICA WEARABLE MATERIAL MARKET BY COUNTRY (KILOTONS) 2020-2029
TABLE 27 SOUTH AMERICA WEARABLE MATERIAL MARKET BY TYPE (USD BILLION) 2020-2029
TABLE 28 SOUTH AMERICA WEARABLE MATERIAL MARKET BY TYPE (KILOTONS) 2020-2029
TABLE 29 SOUTH AMERICA WEARABLE MATERIAL MARKET BY APPLICATION (USD BILLION) 2020-2029
TABLE 30 SOUTH AMERICA WEARABLE MATERIAL MARKET BY APPLICATION (KILOTONS) 2020-2029
TABLE 31 BRAZIL WEARABLE MATERIAL MARKET BY TYPE (USD BILLION) 2020-2029
TABLE 32 BRAZIL WEARABLE MATERIAL MARKET BY TYPE (KILOTONS) 2020-2029
TABLE 33 BRAZIL WEARABLE MATERIAL MARKET BY APPLICATION (USD BILLION) 2020-2029
TABLE 34 BRAZIL WEARABLE MATERIAL MARKET BY APPLICATION (KILOTONS) 2020-2029
TABLE 35 ARGENTINA WEARABLE MATERIAL MARKET BY TYPE (USD BILLION) 2020-2029
TABLE 36 ARGENTINA WEARABLE MATERIAL MARKET BY TYPE (KILOTONS) 2020-2029
TABLE 37 ARGENTINA WEARABLE MATERIAL MARKET BY APPLICATION (USD BILLION) 2020-2029
TABLE 38 ARGENTINA WEARABLE MATERIAL MARKET BY APPLICATION (KILOTONS) 2020-2029
TABLE 39 COLOMBIA WEARABLE MATERIAL MARKET BY TYPE (USD BILLION) 2020-2029
TABLE 40 COLOMBIA WEARABLE MATERIAL MARKET BY TYPE (KILOTONS) 2020-2029
TABLE 41 COLOMBIA WEARABLE MATERIAL MARKET BY APPLICATION (USD BILLION) 2020-2029
TABLE 42 COLOMBIA WEARABLE MATERIAL MARKET BY APPLICATION (KILOTONS) 2020-2029
TABLE 43 REST OF THE SOUTH AMERICA WEARABLE MATERIAL MARKET BY TYPE (USD BILLION) 2020-2029
TABLE 44 REST OF THE SOUTH AMERICA WEARABLE MATERIAL MARKET BY TYPE (KILOTONS) 2020-2029
TABLE 45 REST OF THE SOUTH AMERICA WEARABLE MATERIAL MARKET BY APPLICATION (USD BILLION) 2020-2029
TABLE 46 REST OF THE SOUTH AMERICA WEARABLE MATERIAL MARKET BY APPLICATION (KILOTONS) 2020-2029
TABLE 47 ASIA-PACIFIC WEARABLE MATERIAL MARKET BY COUNTRY (USD BILLION) 2020-2029
TABLE 48 ASIA-PACIFIC WEARABLE MATERIAL MARKET BY COUNTRY (KILOTONS) 2020-2029
TABLE 49 ASIA-PACIFIC WEARABLE MATERIAL MARKET BY TYPE (USD BILLION) 2020-2029
TABLE 50 ASIA-PACIFIC WEARABLE MATERIAL MARKET BY TYPE (KILOTONS) 2020-2029
TABLE 51 ASIA-PACIFIC WEARABLE MATERIAL MARKET BY APPLICATION (USD BILLION) 2020-2029
TABLE 52 ASIA-PACIFIC WEARABLE MATERIAL MARKET BY APPLICATION (KILOTONS) 2020-2029
TABLE 53 INDIA WEARABLE MATERIAL MARKET BY TYPE (USD BILLION) 2020-2029
TABLE 54 INDIA WEARABLE MATERIAL MARKET BY TYPE (KILOTONS) 2020-2029
TABLE 55 INDIA WEARABLE MATERIAL MARKET BY APPLICATION (USD BILLION) 2020-2029
TABLE 56 INDIA WEARABLE MATERIAL MARKET BY APPLICATION (KILOTONS) 2020-2029
TABLE 57 CHINA WEARABLE MATERIAL MARKET BY TYPE (USD BILLION) 2020-2029
TABLE 58 CHINA WEARABLE MATERIAL MARKET BY TYPE (KILOTONS) 2020-2029
TABLE 59 CHINA WEARABLE MATERIAL MARKET BY APPLICATION (USD BILLION) 2020-2029
TABLE 60 CHINA WEARABLE MATERIAL MARKET BY APPLICATION (KILOTONS) 2020-2029
TABLE 61 JAPAN WEARABLE MATERIAL MARKET BY TYPE (USD BILLION) 2020-2029
TABLE 62 JAPAN WEARABLE MATERIAL MARKET BY TYPE (KILOTONS) 2020-2029
TABLE 63 JAPAN WEARABLE MATERIAL MARKET BY APPLICATION (USD BILLION) 2020-2029
TABLE 64 JAPAN WEARABLE MATERIAL MARKET BY APPLICATION (KILOTONS) 2020-2029
TABLE 65 SOUTH KOREA WEARABLE MATERIAL MARKET BY TYPE (USD BILLION) 2020-2029
TABLE 66 SOUTH KOREA WEARABLE MATERIAL MARKET BY TYPE (KILOTONS) 2020-2029
TABLE 67 SOUTH KOREA WEARABLE MATERIAL MARKET BY APPLICATION (USD BILLION) 2020-2029
TABLE 68 SOUTH KOREA WEARABLE MATERIAL MARKET BY APPLICATION (KILOTONS) 2020-2029
TABLE 69 AUSTRALIA WEARABLE MATERIAL MARKET BY TYPE (USD BILLION) 2020-2029
TABLE 70 AUSTRALIA WEARABLE MATERIAL MARKET BY TYPE (KILOTONS) 2020-2029
TABLE 71 AUSTRALIA WEARABLE MATERIAL MARKET BY APPLICATION (USD BILLION) 2020-2029
TABLE 72 AUSTRALIA WEARABLE MATERIAL MARKET BY APPLICATION (KILOTONS) 2020-2029
TABLE 73 SOUTH-EAST ASIA WEARABLE MATERIAL MARKET BY TYPE (USD BILLION) 2020-2029
TABLE 74 SOUTH-EAST ASIA WEARABLE MATERIAL MARKET BY TYPE (KILOTONS) 2020-2029
TABLE 75 SOUTH-EAST ASIA WEARABLE MATERIAL MARKET BY APPLICATION (USD BILLION) 2020-2029
TABLE 76 SOUTH-EAST ASIA WEARABLE MATERIAL MARKET BY APPLICATION (KILOTONS) 2020-2029
TABLE 77 REST OF THE ASIA PACIFIC WEARABLE MATERIAL MARKET BY TYPE (USD BILLION) 2020-2029
TABLE 78 REST OF THE ASIA PACIFIC WEARABLE MATERIAL MARKET BY TYPE (KILOTONS) 2020-2029
TABLE 79 REST OF THE ASIA PACIFIC WEARABLE MATERIAL MARKET BY APPLICATION (USD BILLION) 2020-2029
TABLE 80 REST OF THE ASIA PACIFIC WEARABLE MATERIAL MARKET BY APPLICATION (KILOTONS) 2020-2029
TABLE 81 EUROPE WEARABLE MATERIAL MARKET BY COUNTRY (USD BILLION) 2020-2029
TABLE 82 EUROPE WEARABLE MATERIAL MARKET BY COUNTRY (KILOTONS) 2020-2029
TABLE 83 ASIA-PACIFIC WEARABLE MATERIAL MARKET BY TYPE (USD BILLION) 2020-2029
TABLE 84 ASIA-PACIFIC WEARABLE MATERIAL MARKET BY TYPE (KILOTONS) 2020-2029
TABLE 85 ASIA-PACIFIC WEARABLE MATERIAL MARKET BY APPLICATION (USD BILLION) 2020-2029
TABLE 86 ASIA-PACIFIC WEARABLE MATERIAL MARKET BY APPLICATION (KILOTONS) 2020-2029
TABLE 87 GERMANY WEARABLE MATERIAL MARKET BY TYPE (USD BILLION) 2020-2029
TABLE 88 GERMANY WEARABLE MATERIAL MARKET BY TYPE (KILOTONS) 2020-2029
TABLE 89 GERMANY WEARABLE MATERIAL MARKET BY APPLICATION (USD BILLION) 2020-2029
TABLE 90 GERMANY WEARABLE MATERIAL MARKET BY APPLICATION (KILOTONS) 2020-2029
TABLE 91 UK WEARABLE MATERIAL MARKET BY TYPE (USD BILLION) 2020-2029
TABLE 92 UK WEARABLE MATERIAL MARKET BY TYPE (KILOTONS) 2020-2029
TABLE 93 UK WEARABLE MATERIAL MARKET BY APPLICATION (USD BILLION) 2020-2029
TABLE 94 UK WEARABLE MATERIAL MARKET BY APPLICATION (KILOTONS) 2020-2029
TABLE 95 FRANCE WEARABLE MATERIAL MARKET BY TYPE (USD BILLION) 2020-2029
TABLE 96 FRANCE WEARABLE MATERIAL MARKET BY TYPE (KILOTONS) 2020-2029
TABLE 97 FRANCE WEARABLE MATERIAL MARKET BY APPLICATION (USD BILLION) 2020-2029
TABLE 98 FRANCE WEARABLE MATERIAL MARKET BY APPLICATION (KILOTONS) 2020-2029
TABLE 99 ITALY WEARABLE MATERIAL MARKET BY TYPE (USD BILLION) 2020-2029
TABLE 100 ITALY WEARABLE MATERIAL MARKET BY TYPE (KILOTONS) 2020-2029
TABLE 101 ITALY WEARABLE MATERIAL MARKET BY APPLICATION (USD BILLION) 2020-2029
TABLE 102 ITALY WEARABLE MATERIAL MARKET BY APPLICATION (KILOTONS) 2020-2029
TABLE 103 SPAIN WEARABLE MATERIAL MARKET BY TYPE (USD BILLION) 2020-2029
TABLE 104 SPAIN WEARABLE MATERIAL MARKET BY TYPE (KILOTONS) 2020-2029
TABLE 105 SPAIN WEARABLE MATERIAL MARKET BY APPLICATION (USD BILLION) 2020-2029
TABLE 106 SPAIN WEARABLE MATERIAL MARKET BY APPLICATION (KILOTONS) 2020-2029
TABLE 107 RUSSIA WEARABLE MATERIAL MARKET BY TYPE (USD BILLION) 2020-2029
TABLE 108 RUSSIA WEARABLE MATERIAL MARKET BY TYPE (KILOTONS) 2020-2029
TABLE 109 RUSSIA WEARABLE MATERIAL MARKET BY APPLICATION (USD BILLION) 2020-2029
TABLE 110 RUSSIA WEARABLE MATERIAL MARKET BY APPLICATION (KILOTONS) 2020-2029
TABLE 111 REST OF EUROPE WEARABLE MATERIAL MARKET BY TYPE (USD BILLION) 2020-2029
TABLE 112 REST OF EUROPE WEARABLE MATERIAL MARKET BY TYPE (KILOTONS) 2020-2029
TABLE 113 REST OF EUROPE WEARABLE MATERIAL MARKET BY APPLICATION (USD BILLION) 2020-2029
TABLE 114 REST OF EUROPE WEARABLE MATERIAL MARKET BY APPLICATION (KILOTONS) 2020-2029
TABLE 115 MIDDLE EAST AND AFRICA WEARABLE MATERIAL MARKET BY COUNTRY (USD BILLION) 2020-2029
TABLE 116 MIDDLE EAST AND AFRICA WEARABLE MATERIAL MARKET BY COUNTRY (KILOTONS) 2020-2029
TABLE 117 MIDDLE EAST AND AFRICA WEARABLE MATERIAL MARKET BY TYPE (USD BILLION) 2020-2029
TABLE 118 MIDDLE EAST AND AFRICA WEARABLE MATERIAL MARKET BY TYPE (KILOTONS) 2020-2029
TABLE 119 MIDDLE EAST AND AFRICA WEARABLE MATERIAL MARKET BY APPLICATION (USD BILLION) 2020-2029
TABLE 120 MIDDLE EAST AND AFRICA WEARABLE MATERIAL MARKET BY APPLICATION (KILOTONS) 2020-2029
TABLE 121 UAE WEARABLE MATERIAL MARKET BY TYPE (USD BILLION) 2020-2029
TABLE 122 UAE WEARABLE MATERIAL MARKET BY TYPE (KILOTONS) 2020-2029
TABLE 123 UAE WEARABLE MATERIAL MARKET BY APPLICATION (USD BILLION) 2020-2029
TABLE 124 UAE WEARABLE MATERIAL MARKET BY APPLICATION (KILOTONS) 2020-2029
TABLE 125 SAUDI ARABIA WEARABLE MATERIAL MARKET BY TYPE (USD BILLION) 2020-2029
TABLE 126 SAUDI ARABIA WEARABLE MATERIAL MARKET BY TYPE (KILOTONS) 2020-2029
TABLE 127 SAUDI ARABIA WEARABLE MATERIAL MARKET BY APPLICATION (USD BILLION) 2020-2029
TABLE 128 SAUDI ARABIA WEARABLE MATERIAL MARKET BY APPLICATION (KILOTONS) 2020-2029
TABLE 129 SOUTH AFRICA WEARABLE MATERIAL MARKET BY TYPE (USD BILLION) 2020-2029
TABLE 130 SOUTH AFRICA WEARABLE MATERIAL MARKET BY TYPE (KILOTONS) 2020-2029
TABLE 131 SOUTH AFRICA WEARABLE MATERIAL MARKET BY APPLICATION (USD BILLION) 2020-2029
TABLE 132 SOUTH AFRICA WEARABLE MATERIAL MARKET BY APPLICATION (KILOTONS) 2020-2029
TABLE 133 REST OF THE MIDDLE EAST AND AFRICA WEARABLE MATERIAL MARKET BY TYPE (USD BILLION) 2020-2029
TABLE 134 REST OF THE MIDDLE EAST AND AFRICA WEARABLE MATERIAL MARKET BY TYPE (KILOTONS) 2020-2029
TABLE 135 REST OF THE MIDDLE EAST AND AFRICA WEARABLE MATERIAL MARKET BY APPLICATION (USD BILLION) 2020-2029
TABLE 136 REST OF THE MIDDLE EAST AND AFRICA WEARABLE MATERIAL MARKET BY APPLICATION (KILOTONS) 2020-2029
LIST OF FIGURES
FIGURE 1 MARKET DYNAMICS
FIGURE 2 MARKET SEGMENTATION
FIGURE 3 REPORT TIMELINES: YEARS CONSIDERED
FIGURE 4 DATA TRIANGULATION
FIGURE 5 BOTTOM-UP APPROACH
FIGURE 6 TOP-DOWN APPROACH
FIGURE 7 RESEARCH FLOW
FIGURE 8 GLOBAL WEARABLE MATERIALS MARKET BY TYPE, USD BILLION, 2020-2029
FIGURE 9 GLOBAL WEARABLE MATERIALS MARKET BY APPLICATION, USD BILLION, 2020-2029
FIGURE 10 GLOBAL WEARABLE MATERIALS MARKET BY REGION, USD BILLION, 2020-2029
FIGURE 11 PORTER’S FIVE FORCES MODEL
FIGURE 12 GLOBAL WEARABLE MATERIALS MARKET BY TYPE, USD BILLION, 2021
FIGURE 13 GLOBAL WEARABLE MATERIALS MARKET BY APPLICATION, USD BILLION, 2021
FIGURE 12 GLOBAL WEARABLE MATERIALS MARKET BY REGION, USD BILLION, 2021
FIGURE 12 NORTH AMERICA WEARABLE MATERIALS MARKET SNAPSHOT
FIGURE 13 EUROPE WEARABLE MATERIALS MARKET SNAPSHOT
FIGURE 14 SOUTH AMERICA WEARABLE MATERIALS MARKET SNAPSHOT
FIGURE 15 ASIA PACIFIC WEARABLE MATERIALS MARKET SNAPSHOT
FIGURE 16 MIDDLE EAST ASIA AND AFRICA WEARABLE MATERIALS MARKET SNAPSHOT
FIGURE 17 MARKET SHARE ANALYSIS
FIGURE 18 BASF: COMPANY SNAPSHOT
FIGURE 19 DOWDUPONT: COMPANY SNAPSHOT
FIGURE 20 WACKER CHEMIE: COMPANY SNAPSHOT
FIGURE 21 DSM: COMPANY SNAPSHOT
FIGURE 22 EASTMAN CORPORATION: COMPANY SNAPSHOT
FIGURE 23 SHIN-ETSU: COMPANY SNAPSHOT
FIGURE 24 ELKEM: COMPANY SNAPSHOT
FIGURE 25 MOMENTIVE PERFORMANCE MATERIALS: COMPANY SNAPSHOT
FIGURE 26 LUBRIZOL: COMPANY SNAPSHOT
FIGURE 27 DAIKIN CHEMICALS: COMPANY SNAPSHOT
DOWNLOAD FREE SAMPLE REPORT
License Type
SPEAK WITH OUR ANALYST
Want to know more about the report or any specific requirement?
WANT TO CUSTOMIZE THE REPORT?
Our Clients Speak
We asked them to research ‘ Equipment market’ all over the world, and their whole arrangement was helpful to us. thehealthanalytics.com insightful analysis and reports contributed to our current analysis and in creating a future strategy. Besides, the te
Yosuke Mitsui
Senior Associate Construction Equipment Sales & Marketing
We asked them to research ‘Equipment market’ all over the world, and their whole arrangement was helpful to us. thehealthanalytics.com insightful analysis and reports contributed to our current analysis and in creating a future strategy. Besides, the te


