

Base Year Value ()
x.x %
x.x %
CAGR ()
x.x %
x.x %
Forecast Year Value ()
x.x %
x.x %
Historical Data Period
Largest Region
Forecast Period
Mercado de cenizas volantes por tipo (clase F, clase C), por aplicación (cemento Portland y hormigón, ladrillos y bloques, construcción de carreteras, agricultura, otros) y región, tendencias globales y pronóstico de 2022 a 2029
Instant access to hundreds of data points and trends
- Market estimates from 2014-2029
- Competitive analysis, industry segmentation, financial benchmarks
- Incorporates SWOT, Porter's Five Forces and risk management frameworks
- PDF report or online database with Word, Excel and PowerPoint export options
- 100% money back guarantee
Descripción general del mercado de cenizas volantes
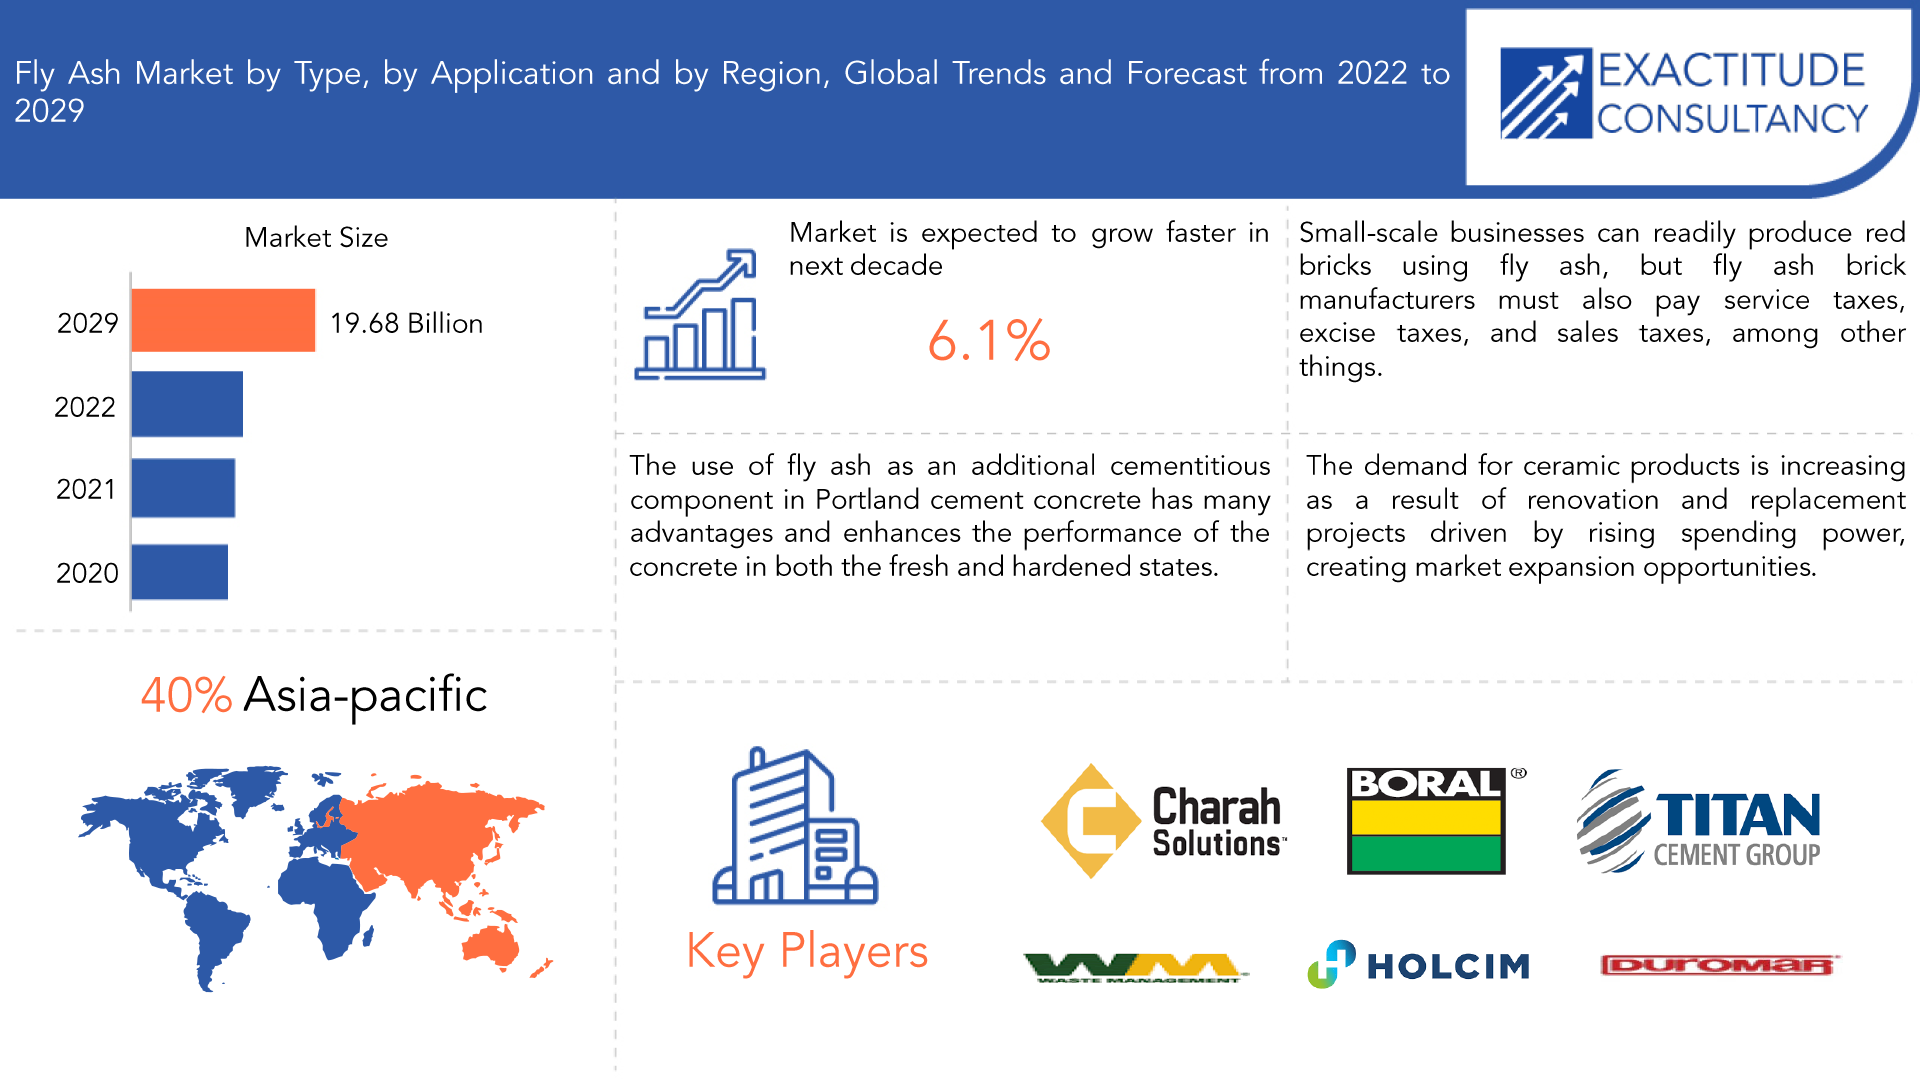
Se espera que el mercado de cenizas volantes crezca a una tasa anual compuesta del 6,1 % entre 2022 y 2029. Se espera que alcance más de 19 680 millones de dólares en 2029 desde los 11 550 millones de dólares en 2020.
Las cámaras de combustión de carbón liberan una sustancia fina llamada ceniza volante, también conocida como ceniza de combustión, que se detiene mediante dispositivos de control de emisiones, como depuradores, precipitadores electrostáticos y filtros de tela. La eliminación de las enormes cantidades de ceniza que se producen en las distintas centrales térmicas se ha convertido en uno de los mayores desafíos medioambientales. Las cenizas de combustión, que antes se producían al quemar carbón en las centrales eléctricas, ahora solo se pueden utilizar en vertederos y se cree que tienen un valor extremadamente bajo. Su aplicación como aditivo puzolánico en el cemento ha convertido su utilidad en el cemento en un descubrimiento importante.
| ATRIBUTO | DETALLES |
| Periodo de estudio | 2020-2029 |
| Año base | 2021 |
| Año estimado | 2022 |
| Año pronosticado | 2022-2029 |
| Periodo histórico | 2018-2020 |
| Unidad | Valor (miles de millones de USD) (kilotones) |
| Segmentación | Por tipo, por aplicación, por región |
| Por tipo |
|
| Por aplicación |
|
| Por región |
|
Tanto la producción de ladrillos como la de cemento de puzolana Portland utilizan en gran medida cenizas. Además de preservar el suelo, también ayudan al medio ambiente porque no producen gases de efecto invernadero, lo que reduce su impacto en el medio ambiente. Varias partes, incluidos institutos académicos y de investigación y desarrollo, así como departamentos y ministerios gubernamentales, tienen la tarea de promover el uso de estas cenizas en los materiales de construcción. Las estructuras gubernamentales, incluidos bancos e instituciones financieras, institutos de investigación, proveedores de servicios tecnológicos, constructores comerciales, departamentos gubernamentales y organizaciones de la sociedad civil, utilizan cenizas de carbón en materiales de construcción para apoyar la expansión de las aplicaciones de construcción. Además, la expansión de la comercialización está impulsando el uso de cemento para proyectos de infraestructura impulsados por el crecimiento económico. Uno de los principales obstáculos para el crecimiento de los ingresos del mercado son las estrictas leyes gubernamentales sobre vertederos y calidad del aire.
Dado que las cenizas volantes son una alternativa más asequible al cemento y reducen las emisiones de carbono, su demanda en el sector de la construcción es un factor importante en la expansión del mercado. También se prevé una expansión del mercado mundial como resultado de la creciente demanda de electricidad y el mayor uso de centrales eléctricas a carbón. La demanda de productos cerámicos está aumentando como resultado de los proyectos de renovación y sustitución impulsados por el aumento del poder adquisitivo, lo que crea oportunidades de expansión del mercado.
La epidemia de COVID-19 ha tenido un efecto conflictivo en el mercado de cenizas volantes. Por un lado, la desaceleración económica mundial relacionada con la pandemia ha provocado una disminución de la actividad de la construcción, lo que ha afectado al mercado de cenizas volantes. Como resultado de la creciente atención de la pandemia a los materiales de construcción respetuosos con el medio ambiente, las cenizas volantes tienen el potencial de reemplazar al cemento en algunos proyectos de construcción. La pandemia también ha obstaculizado las cadenas de suministro internacionales, causando falta de materias primas y dificultades en el envío. Esto ha tenido un impacto en la producción y distribución de cenizas volantes, causando oscilaciones de precios y problemas en la cadena de suministro. En general, la forma en que el sector de la construcción se recupere y el énfasis que se ponga en los materiales de construcción sostenibles en el mundo pospandémico determinarán los efectos a largo plazo de la pandemia en el negocio de las cenizas volantes.
[título id="attachment_18590" align="aligncenter" width="1920"]
Frequently Asked Questions
• What is the worth of fly ash market?
The fly ash market is expected to grow at 6.1% CAGR from 2022 to 2029. It is expected to reach above USD 19.68 Billion by 2029 from USD 11.55 Billion in 2020.
• What is the size of the asia pacific in fly ash market?
Asia Pacific held more than 40% of the Fly Ash Market revenue share in 2021 and will witness expansion in the forecast period.
• What are some of the fly ash market's driving forces?
Rising demand for fly ash bricks in the building sector is anticipated to drive the market. In addition to shielding the soil, this ash benefits the environment because it does not emit greenhouse gases while being produced. To encourage the use of this product in construction materials, a variety of stakeholders, including governmental organizations and ministries, academic institutions, and research and development centers, are involved. The effort to manufacture more ecologically friendly concrete by using less cement and partially substituting by-products material for cement is also anticipated to have an impact on the market potential for fly ash bricks.
• Which are the top companies to hold the market share in fly ash market?
The Market research report covers the analysis of Market players. Key companies profiled in the report include Charah Solutions, Inc., Boral Limited, Waste Management, Inc., SEFA, Holcim, Titan Cement Group, Duromar, Inc, Aggregate Industries, Ashtech, Lafarge S.A.
• Which is the largest regional market for fly ash market?
The greatest revenue share was accounted for by asia pacific. The region's expanding population is putting a strain on its infrastructure and necessitating further construction of roads, residential structures, and rail networks. To close the gap between the region's current infrastructure and what is needed, there is a critical need to invest in new infrastructure. Thus, it is anticipated that the governments of the nations in the Asia Pacific region will be driving the worldwide fly ash market with their road infrastructure initiatives.
Fly Ash Market Segment Analysis
Fly ash market is segmented based on type, application and region.
Based on type, a significant portion of the market was made up of class F, which is due to the Portland cement industry's growing use of the product to create mass concrete and mixes with high strength. Additionally, advantages of the product, such as high compressive strength, improved resistance to ASR (Alkali silica reaction), decreased permeability and water demand, and less heat generation during hydration, are expected to increase its adoption and subsequently propel revenue growth of this market.
Based on application, a significant portion of the market was made up of bricks & blocks. Fly ash gives bricks and blocks a significant amount of compressive strength. High-quality fly ash bricks are frequently used to build brick masonry structures and make an excellent alternative to regular clay bricks. Fly ash provides blocks with a superior mold, sharper corners, and a superb gloss and texture. By reducing carbon dioxide emissions by ninety, these bricks and blocks can help preserve natural resources and enhance environmental preservation. They are becoming more and more in demand as a carbon dioxide-efficient material, and this demand is expected to rise over the course of the projected period.
[caption id="attachment_18606" align="aligncenter" width="1920"]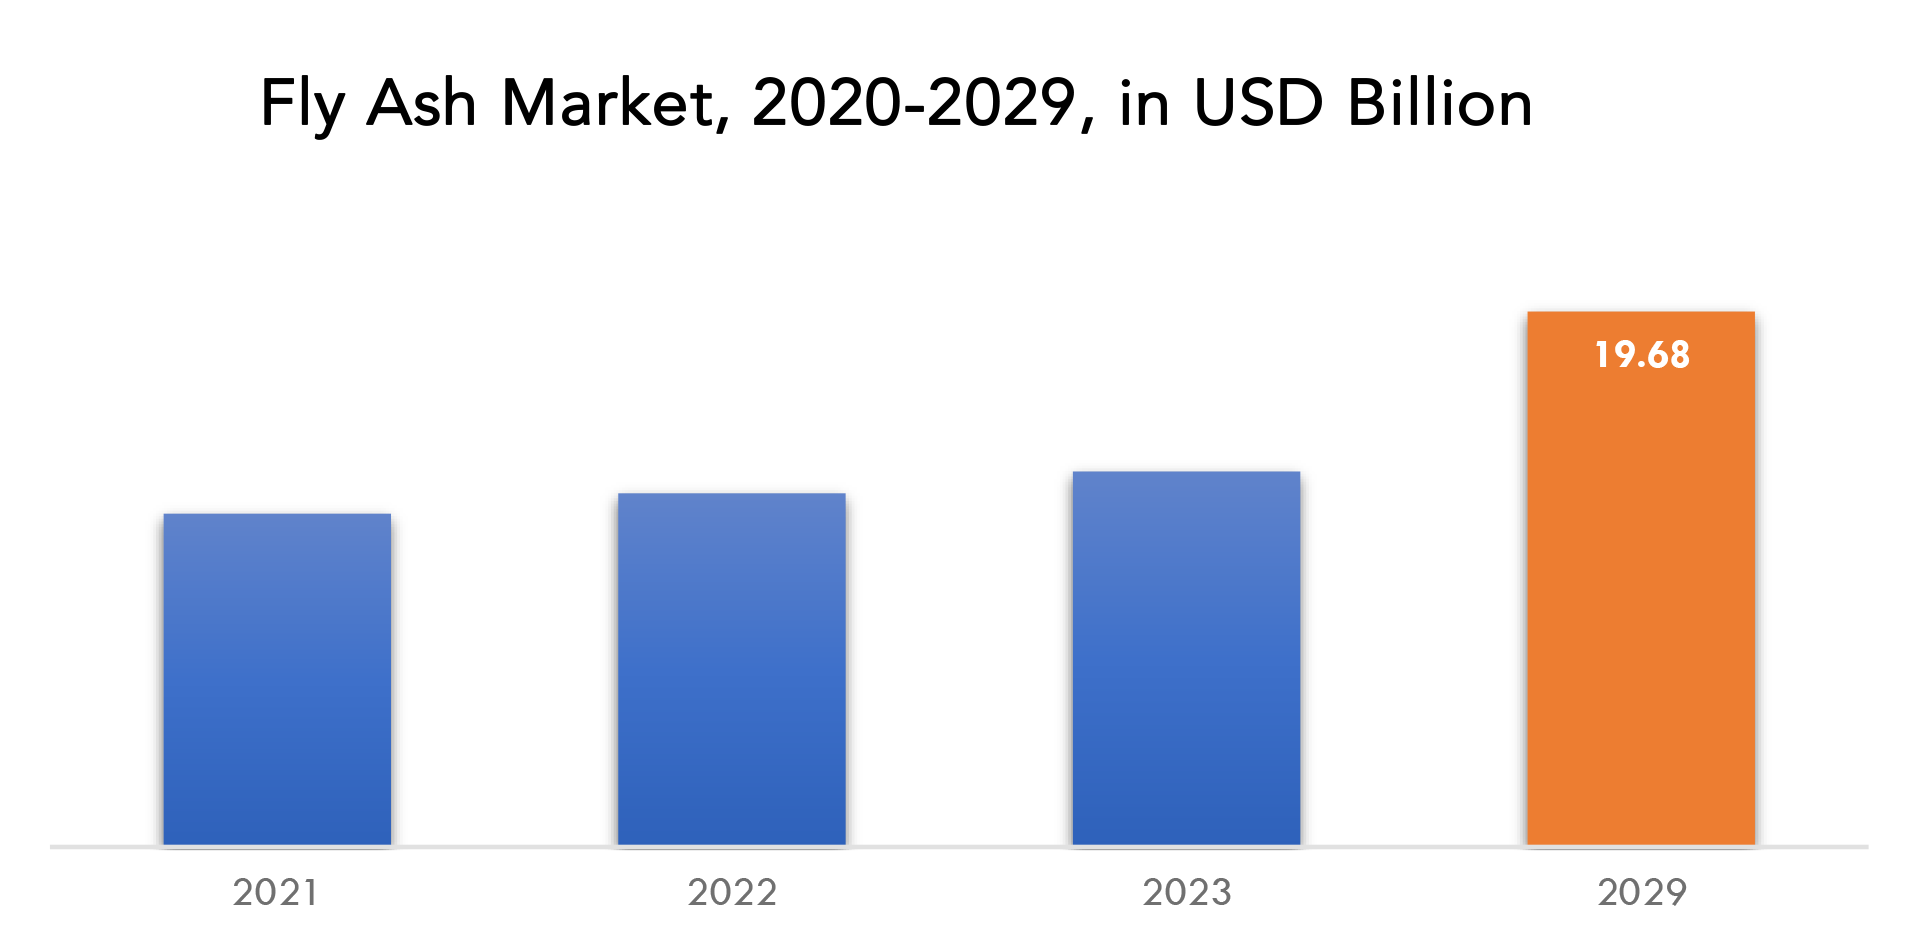
Fly Ash Market Players
The market research report covers the analysis of market players. Key companies profiled in the report include Charah Solutions, Inc., Boral Limited, Waste Management, Inc., SEFA, Holcim, Titan Cement Group, Duromar, Inc, Aggregate Industries, Ashtech, Lafarge S.A.
Recent News- On October 2022, Charah Solutions awarded multi-year ash pond closure project from Midwest utility partner
- On May 2021, Geelong high school students learn how to become safer drivers, with help from Boral and Road Safety Education Limited
Who Should Buy? Or Key stakeholders
- Investors
- Manufacturing Companies
- Construction Industry
- End user companies
- Research and Development
- Chemical Laboratories
- Environment, Health and Safety Professionals
- Regulatory Authorities
- Others
Fly Ash Market Regional Analysis
The fly ash market by region includes north america, asia-pacific (APAC), europe, south america, and middle east & africa (MEA).
- North America: includes the US, Canada, Mexico
- Asia Pacific: includes China, Japan, South Korea, India, Australia, ASEAN, and Rest of APAC
- Europe: includes UK, Germany, France, Italy, Spain, Russia, and Rest of Europe
- South America: includes Brazil, Argentina, and Rest of South America
- Middle East & Africa: includes Turkey, UAE, Saudi Arabia, South Africa, and Rest of MEA
The greatest revenue share in 2021 over 40% was accounted for by Asia Pacific. Because the use of fly ash in the infrastructure sector is expanding, and since the area is actively developing more infrastructure. In this area, China, India, Malaysia, South Korea, and Australia are the top fly ash consumers. Energy saving and the avoidance of fly ash disposal in ponds and landfills are top priorities for the governments of the region. When building with PMAYG (Pradhan Mantri Awaas Yojana Gramin) funds, the Indian government is also encouraging the use of fly ash-based building products, including cement, concrete, and bricks. By using eco-friendly building materials, this programme primarily aims to reduce the negative effects of construction materials on the environment and address the issue of natural resource scarcity.
[caption id="attachment_18608" align="aligncenter" width="1920"]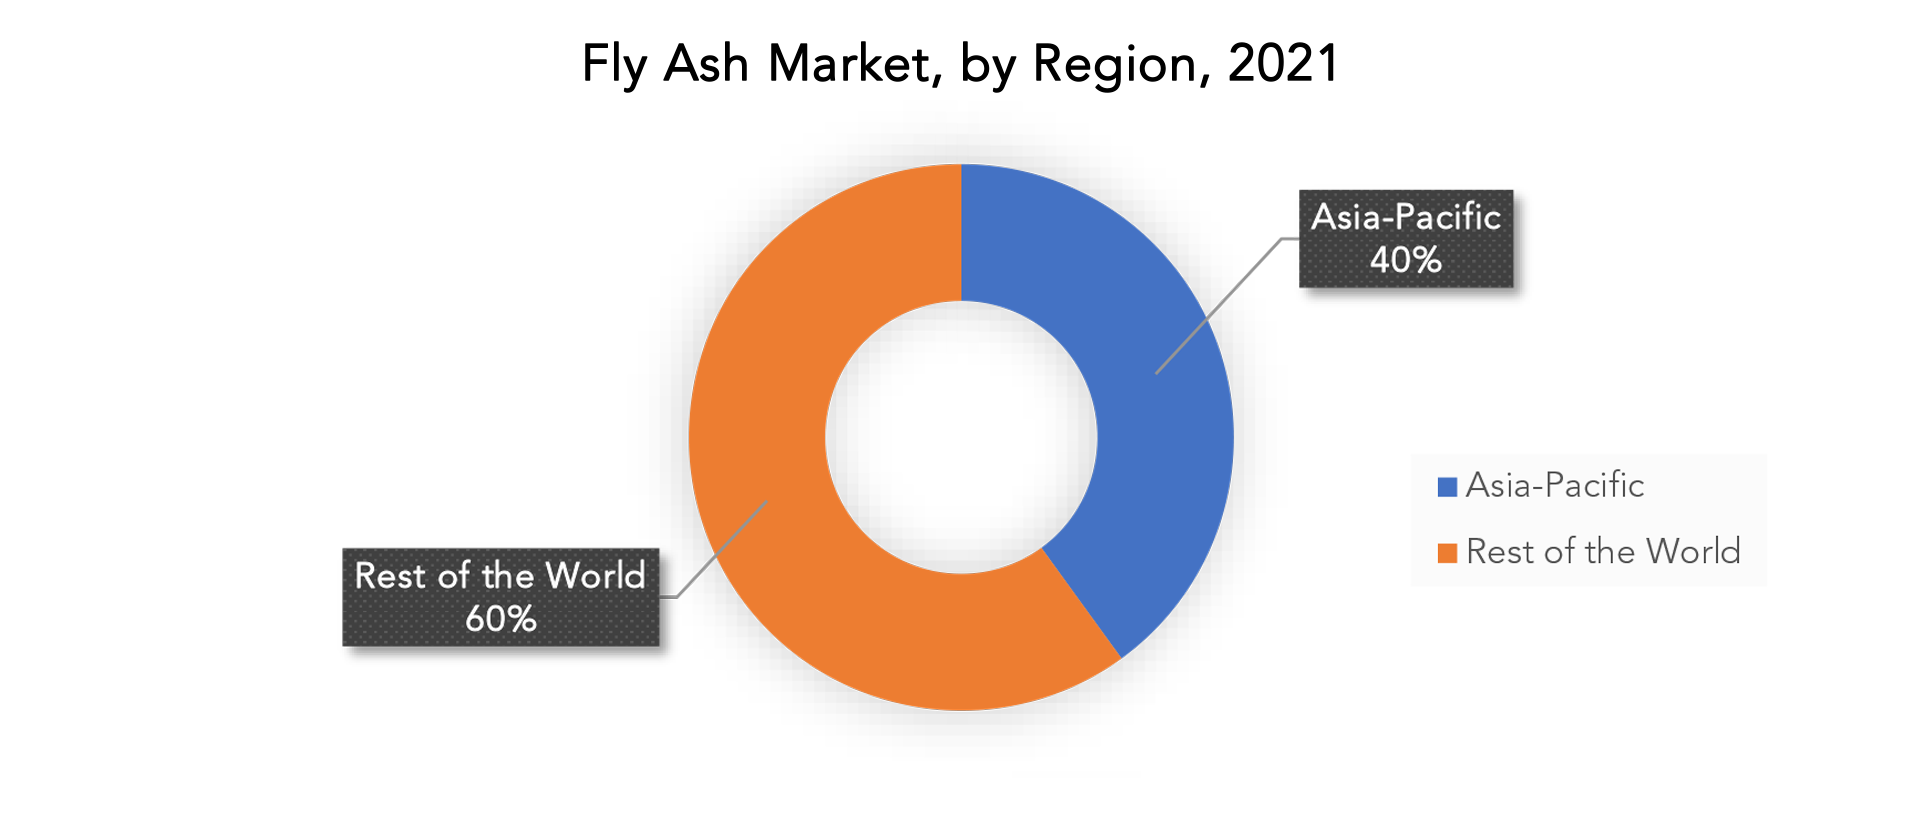
Key Market Segments
Fly Ash Market by Type, 2020-2029, (USD Billion), (Kilotons)- Class F
- Class C
- Portland Cement & Concrete
- Bricks & Blocks
- Road Construction
- Agriculture
- Others
- North America
- Asia Pacific
- Europe
- South America
- Middle East And Africa
Exactitude Consultancy Services Key Objectives
- Increasing sales and Market share
- Developing new technology
- Improving profitability
- Entering new markets
- Enhancing brand reputation
Key Question Answered
- What is the expected growth rate of the fly ash market over the next 7 years?
- Who are the major players in the fly ash market and what is their market share?
- What are the end-user industries driving demand for market and what is their outlook?
- What are the opportunities for growth in emerging markets such as asia-pacific, middle east, and africa?
- How is the economic environment affecting the fly ash market, including factors such as interest rates, inflation, and exchange rates?
- What is the expected impact of government policies and regulations on the fly ash market?
- What is the current and forecasted size and growth rate of the global fly ash market?
- What are the key drivers of growth in the fly ash market?
- Who are the major players in the market and what is their market share?
- What are the distribution channels and supply chain dynamics in the fly ash market?
- What are the technological advancements and innovations in the fly ash market and their impact on product development and growth?
- What are the regulatory considerations and their impact on the market?
- What are the challenges faced by players in the fly ash market and how are they addressing these challenges?
- What are the opportunities for growth and expansion in the fly ash market?
- What are the products offerings and specifications of leading players in the market?
- INTRODUCCIÓN
- DEFINICIÓN DE MERCADO
- SEGMENTACIÓN DEL MERCADO
- CRONOGRAMAS DE INVESTIGACIÓN
- SUPUESTOS Y LIMITACIONES
- METODOLOGÍA DE LA INVESTIGACIÓN
- MINERÍA DE DATOS
- INVESTIGACIÓN SECUNDARIA
- INVESTIGACIÓN PRIMARIA
- ASESORAMIENTO DE EXPERTOS EN LA MATERIA
- CONTROLES DE CALIDAD
- REVISIÓN FINAL
- TRIANGULACIÓN DE DATOS
- ENFOQUE DE ABAJO HACIA ARRIBA
- ENFOQUE DE ARRIBA HACIA ABAJO
- FLUJO DE INVESTIGACIÓN
- FUENTES DE DATOS
- MINERÍA DE DATOS
- RESUMEN EJECUTIVO
- PANORAMA DEL MERCADO
- PERSPECTIVAS DEL MERCADO MUNDIAL DE CENIZAS VOLANTES
- IMPULSORES DEL MERCADO
- RESTRICCIONES DEL MERCADO
- OPORTUNIDADES DE MERCADO
- IMPACTO DEL COVID-19 EN EL MERCADO DE CENIZAS VOLANTES
- MODELO DE LAS CINCO FUERZAS DE PORTER
- AMENAZA DE NUEVOS INGRESANTES
- AMENAZA DE SUSTITUTOS
- PODER DE NEGOCIACIÓN DE LOS PROVEEDORES
- PODER DE NEGOCIACIÓN DE LOS CLIENTES
- GRADO DE COMPETENCIA
- ANÁLISIS DE LA CADENA DE VALOR DE LA INDUSTRIA
- PERSPECTIVAS DEL MERCADO MUNDIAL DE CENIZAS VOLANTES
- MERCADO MUNDIAL DE CENIZAS VOLANTES POR TIPO, 2020-2029, (MILES DE MILLONES DE USD), (KILOTONELADAS)
- CLASE F
- CLASE C
- MERCADO MUNDIAL DE CENIZAS VOLANTES POR APLICACIÓN, 2020-2029, (MILES DE MILLONES DE USD), (KILOTONELADAS)
- CEMENTO Y HORMIGÓN PORTLAND
- LADRILLOS Y BLOQUES
- CONSTRUCCIÓN DE CARRETERAS
- AGRICULTURA
- OTROS
- MERCADO MUNDIAL DE CENIZAS VOLANTES POR REGIÓN, 2020-2029, (MILES DE MILLONES DE USD), (KILOTONELADAS)
- AMÉRICA DEL NORTE
- A NOSOTROS
- CANADÁ
- MÉXICO
- SUDAMERICA
- BRASIL
- ARGENTINA
- COLOMBIA
- RESTO DE SUDAMÉRICA
- EUROPA
- ALEMANIA
- Reino Unido
- FRANCIA
- ITALIA
- ESPAÑA
- RUSIA
- RESTO DE EUROPA
- ASIA PACÍFICO
- INDIA
- PORCELANA
- JAPÓN
- COREA DEL SUR
- AUSTRALIA
- ASIA SUDESTE
- RESTO DE ASIA PACÍFICO
- ORIENTE MEDIO Y ÁFRICA
- Emiratos Árabes Unidos
- ARABIA SAUDITA
- SUDÁFRICA
- RESTO DE ORIENTE MEDIO Y ÁFRICA
- AMÉRICA DEL NORTE
- PERFILES DE EMPRESAS* (DESCRIPCIÓN GENERAL DEL NEGOCIO, RESEÑA DE LA EMPRESA, PRODUCTOS OFRECIDOS, DESARROLLOS RECIENTES)
- SOLUCIONES CHARAH, INC.
- BORAL LIMITADA
- GESTIÓN DE RESIDUOS, INC.
- SEFA
- HOLCIM
- GRUPO CEMENTO TITAN
- DUROMAR, INC
- INDUSTRIAS DE AGREGADOS
- ASHTECH
- LAFARGE S.A. *THE COMPANY LIST IS INDICATIVE
LIST OF TABLES
TABLE 1 GLOBAL FLY ASH MARKET BY TYPE (USD BILLION), 2020-2029
TABLE 2 GLOBAL FLY ASH MARKET BY TYPE (KILOTONS), 2020-2029
TABLE 3 GLOBAL FLY ASH MARKET BY APPLICATION (USD BILLION), 2020-2029
TABLE 4 GLOBAL FLY ASH MARKET BY APPLICATION (KILOTONS), 2020-2029
TABLE 5 GLOBAL FLY ASH MARKET BY REGION (USD BILLION), 2020-2029
TABLE 6 GLOBAL FLY ASH MARKET BY REGION (KILOTONS), 2020-2029
TABLE 7 NORTH AMERICA FLY ASH MARKET BY TYPE (USD BILLION), 2020-2029
TABLE 8 NORTH AMERICA FLY ASH MARKET BY TYPE (KILOTONS), 2020-2029
TABLE 9 NORTH AMERICA FLY ASH MARKET BY APPLICATION (USD BILLION), 2020-2029
TABLE 10 NORTH AMERICA FLY ASH MARKET BY APPLICATION (KILOTONS), 2020-2029
TABLE 11 NORTH AMERICA FLY ASH MARKET BY COUNTRY (USD BILLION), 2020-2029
TABLE 12 NORTH AMERICA FLY ASH MARKET BY COUNTRY (KILOTONS), 2020-2029
TABLE 13 US FLY ASH MARKET BY TYPE (USD BILLION), 2020-2029
TABLE 14 US FLY ASH MARKET BY TYPE (KILOTONS), 2020-2029
TABLE 15 US FLY ASH MARKET BY APPLICATION (USD BILLION), 2020-2029
TABLE 16 US FLY ASH MARKET BY APPLICATION (KILOTONS), 2020-2029
TABLE 17 CANADA FLY ASH MARKET BY TYPE (USD BILLION), 2020-2029
TABLE 18 CANADA FLY ASH MARKET BY TYPE (KILOTONS), 2020-2029
TABLE 19 CANADA FLY ASH MARKET BY APPLICATION (USD BILLION), 2020-2029
TABLE 20 CANADA FLY ASH MARKET BY APPLICATION (KILOTONS), 2020-2029
TABLE 21 MEXICO FLY ASH MARKET BY TYPE (USD BILLION), 2020-2029
TABLE 22 MEXICO FLY ASH MARKET BY TYPE (KILOTONS), 2020-2029
TABLE 23 MEXICO FLY ASH MARKET BY APPLICATION (USD BILLION), 2020-2029
TABLE 24 MEXICO FLY ASH MARKET BY APPLICATION (KILOTONS), 2020-2029
TABLE 25 SOUTH AMERICA FLY ASH MARKET BY TYPE (USD BILLION), 2020-2029
TABLE 26 SOUTH AMERICA FLY ASH MARKET BY TYPE (KILOTONS), 2020-2029
TABLE 27 SOUTH AMERICA FLY ASH MARKET BY APPLICATION (USD BILLION), 2020-2029
TABLE 28 SOUTH AMERICA FLY ASH MARKET BY APPLICATION (KILOTONS), 2020-2029
TABLE 29 SOUTH AMERICA FLY ASH MARKET BY COUNTRY (USD BILLION), 2020-2029
TABLE 30 SOUTH AMERICA FLY ASH MARKET BY COUNTRY (KILOTONS), 2020-2029
TABLE 31 BRAZIL FLY ASH MARKET BY TYPE (USD BILLION), 2020-2029
TABLE 32 BRAZIL FLY ASH MARKET BY TYPE (KILOTONS), 2020-2029
TABLE 33 BRAZIL FLY ASH MARKET BY APPLICATION (USD BILLION), 2020-2029
TABLE 34 BRAZIL FLY ASH MARKET BY APPLICATION (KILOTONS), 2020-2029
TABLE 35 ARGENTINA FLY ASH MARKET BY TYPE (USD BILLION), 2020-2029
TABLE 36 ARGENTINA FLY ASH MARKET BY TYPE (KILOTONS), 2020-2029
TABLE 37 ARGENTINA FLY ASH MARKET BY APPLICATION (USD BILLION), 2020-2029
TABLE 38 ARGENTINA FLY ASH MARKET BY APPLICATION (KILOTONS), 2020-2029
TABLE 39 COLOMBIA FLY ASH MARKET BY TYPE (USD BILLION), 2020-2029
TABLE 40 COLOMBIA FLY ASH MARKET BY TYPE (KILOTONS), 2020-2029
TABLE 41 COLOMBIA FLY ASH MARKET BY APPLICATION (USD BILLION), 2020-2029
TABLE 42 COLOMBIA FLY ASH MARKET BY APPLICATION (KILOTONS), 2020-2029
TABLE 43 REST OF SOUTH AMERICA FLY ASH MARKET BY TYPE (USD BILLION), 2020-2029
TABLE 44 REST OF SOUTH AMERICA FLY ASH MARKET BY TYPE (KILOTONS), 2020-2029
TABLE 45 REST OF SOUTH AMERICA FLY ASH MARKET BY APPLICATION (USD BILLION), 2020-2029
TABLE 46 REST OF SOUTH AMERICA FLY ASH MARKET BY APPLICATION (KILOTONS), 2020-2029
TABLE 47 ASIA-PACIFIC FLY ASH MARKET BY TYPE (USD BILLION), 2020-2029
TABLE 48 ASIA-PACIFIC FLY ASH MARKET BY TYPE (KILOTONS), 2020-2029
TABLE 49 ASIA-PACIFIC FLY ASH MARKET BY APPLICATION (USD BILLION), 2020-2029
TABLE 50 ASIA-PACIFIC FLY ASH MARKET BY APPLICATION (KILOTONS), 2020-2029
TABLE 51 ASIA-PACIFIC FLY ASH MARKET BY COUNTRY (USD BILLION), 2020-2029
TABLE 52 ASIA-PACIFIC FLY ASH MARKET BY COUNTRY (KILOTONS), 2020-2029
TABLE 53 INDIA FLY ASH MARKET BY TYPE (USD BILLION), 2020-2029
TABLE 54 INDIA FLY ASH MARKET BY TYPE (KILOTONS), 2020-2029
TABLE 55 INDIA FLY ASH MARKET BY APPLICATION (USD BILLION), 2020-2029
TABLE 56 INDIA FLY ASH MARKET BY APPLICATION (KILOTONS), 2020-2029
TABLE 57 CHINA FLY ASH MARKET BY TYPE (USD BILLION), 2020-2029
TABLE 58 CHINA FLY ASH MARKET BY TYPE (KILOTONS), 2020-2029
TABLE 59 CHINA FLY ASH MARKET BY APPLICATION (USD BILLION), 2020-2029
TABLE 60 CHINA FLY ASH MARKET BY APPLICATION (KILOTONS), 2020-2029
TABLE 61 JAPAN FLY ASH MARKET BY TYPE (USD BILLION), 2020-2029
TABLE 62 JAPAN FLY ASH MARKET BY TYPE (KILOTONS), 2020-2029
TABLE 63 JAPAN FLY ASH MARKET BY APPLICATION (USD BILLION), 2020-2029
TABLE 64 JAPAN FLY ASH MARKET BY APPLICATION (KILOTONS), 2020-2029
TABLE 65 SOUTH KOREA FLY ASH MARKET BY TYPE (USD BILLION), 2020-2029
TABLE 66 SOUTH KOREA FLY ASH MARKET BY TYPE (KILOTONS), 2020-2029
TABLE 67 SOUTH KOREA FLY ASH MARKET BY APPLICATION (USD BILLION), 2020-2029
TABLE 68 SOUTH KOREA FLY ASH MARKET BY APPLICATION (KILOTONS), 2020-2029
TABLE 69 AUSTRALIA FLY ASH MARKET BY TYPE (USD BILLION), 2020-2029
TABLE 70 AUSTRALIA FLY ASH MARKET BY TYPE (KILOTONS), 2020-2029
TABLE 71 AUSTRALIA FLY ASH MARKET BY APPLICATION (USD BILLION), 2020-2029
TABLE 72 AUSTRALIA FLY ASH MARKET BY APPLICATION (KILOTONS), 2020-2029
TABLE 73 SOUTH EAST ASIA FLY ASH MARKET BY TYPE (USD BILLION), 2020-2029
TABLE 74 SOUTH EAST ASIA FLY ASH MARKET BY TYPE (KILOTONS), 2020-2029
TABLE 75 SOUTH EAST ASIA FLY ASH MARKET BY APPLICATION (USD BILLION), 2020-2029
TABLE 76 SOUTH EAST ASIA FLY ASH MARKET BY APPLICATION (KILOTONS), 2020-2029
TABLE 77 REST OF ASIA PACIFIC FLY ASH MARKET BY TYPE (USD BILLION), 2020-2029
TABLE 78 REST OF ASIA PACIFIC FLY ASH MARKET BY TYPE (KILOTONS), 2020-2029
TABLE 79 REST OF ASIA PACIFIC FLY ASH MARKET BY APPLICATION (USD BILLION), 2020-2029
TABLE 80 REST OF ASIA PACIFIC FLY ASH MARKET BY APPLICATION (KILOTONS), 2020-2029
TABLE 81 EUROPE FLY ASH MARKET BY TYPE (USD BILLION), 2020-2029
TABLE 82 EUROPE FLY ASH MARKET BY TYPE (KILOTONS), 2020-2029
TABLE 83 EUROPE FLY ASH MARKET BY APPLICATION (USD BILLION), 2020-2029
TABLE 84 EUROPE FLY ASH MARKET BY APPLICATION (KILOTONS), 2020-2029
TABLE 85 EUROPE FLY ASH MARKET BY COUNTRY (USD BILLION), 2020-2029
TABLE 86 EUROPE FLY ASH MARKET BY COUNTRY (KILOTONS), 2020-2029
TABLE 87 GERMANY FLY ASH MARKET BY TYPE (USD BILLION), 2020-2029
TABLE 88 GERMANY FLY ASH MARKET BY TYPE (KILOTONS), 2020-2029
TABLE 89 GERMANY FLY ASH MARKET BY APPLICATION (USD BILLION), 2020-2029
TABLE 90 GERMANY FLY ASH MARKET BY APPLICATION (KILOTONS), 2020-2029
TABLE 91 UK FLY ASH MARKET BY TYPE (USD BILLION), 2020-2029
TABLE 92 UK FLY ASH MARKET BY TYPE (KILOTONS), 2020-2029
TABLE 93 UK FLY ASH MARKET BY APPLICATION (USD BILLION), 2020-2029
TABLE 94 UK FLY ASH MARKET BY APPLICATION (KILOTONS), 2020-2029
TABLE 95 FRANCE FLY ASH MARKET BY TYPE (USD BILLION), 2020-2029
TABLE 96 FRANCE FLY ASH MARKET BY TYPE (KILOTONS), 2020-2029
TABLE 97 FRANCE FLY ASH MARKET BY APPLICATION (USD BILLION), 2020-2029
TABLE 98 FRANCE FLY ASH MARKET BY APPLICATION (KILOTONS), 2020-2029
TABLE 99 ITALY FLY ASH MARKET BY TYPE (USD BILLION), 2020-2029
TABLE 100 ITALY FLY ASH MARKET BY TYPE (KILOTONS), 2020-2029
TABLE 101 ITALY FLY ASH MARKET BY APPLICATION (USD BILLION), 2020-2029
TABLE 102 ITALY FLY ASH MARKET BY APPLICATION (KILOTONS), 2020-2029
TABLE 103 SPAIN FLY ASH MARKET BY TYPE (USD BILLION), 2020-2029
TABLE 104 SPAIN FLY ASH MARKET BY TYPE (KILOTONS), 2020-2029
TABLE 105 SPAIN FLY ASH MARKET BY APPLICATION (USD BILLION), 2020-2029
TABLE 106 SPAIN FLY ASH MARKET BY APPLICATION (KILOTONS), 2020-2029
TABLE 107 RUSSIA FLY ASH MARKET BY TYPE (USD BILLION), 2020-2029
TABLE 108 RUSSIA FLY ASH MARKET BY TYPE (KILOTONS), 2020-2029
TABLE 109 RUSSIA FLY ASH MARKET BY APPLICATION (USD BILLION), 2020-2029
TABLE 110 RUSSIA FLY ASH MARKET BY APPLICATION (KILOTONS), 2020-2029
TABLE 111 REST OF EUROPE FLY ASH MARKET BY TYPE (USD BILLION), 2020-2029
TABLE 112 REST OF EUROPE FLY ASH MARKET BY TYPE (KILOTONS), 2020-2029
TABLE 113 REST OF EUROPE FLY ASH MARKET BY APPLICATION (USD BILLION), 2020-2029
TABLE 114 REST OF EUROPE FLY ASH MARKET BY APPLICATION (KILOTONS), 2020-2029
TABLE 115 MIDDLE EAST AND AFRICA FLY ASH MARKET BY TYPE (USD BILLION), 2020-2029
TABLE 116 MIDDLE EAST AND AFRICA FLY ASH MARKET BY TYPE (KILOTONS), 2020-2029
TABLE 117 MIDDLE EAST AND AFRICA FLY ASH MARKET BY APPLICATION (USD BILLION), 2020-2029
TABLE 118 MIDDLE EAST AND AFRICA FLY ASH MARKET BY APPLICATION (KILOTONS), 2020-2029
TABLE 119 MIDDLE EAST AND AFRICA FLY ASH MARKET BY COUNTRY (USD BILLION), 2020-2029
TABLE 120 MIDDLE EAST AND AFRICA FLY ASH MARKET BY COUNTRY (KILOTONS), 2020-2029
TABLE 121 UAE FLY ASH MARKET BY TYPE (USD BILLION), 2020-2029
TABLE 122 UAE FLY ASH MARKET BY TYPE (KILOTONS), 2020-2029
TABLE 123 UAE FLY ASH MARKET BY APPLICATION (USD BILLION), 2020-2029
TABLE 124 UAE FLY ASH MARKET BY APPLICATION (KILOTONS), 2020-2029
TABLE 125 SAUDI ARABIA FLY ASH MARKET BY TYPE (USD BILLION), 2020-2029
TABLE 126 SAUDI ARABIA FLY ASH MARKET BY TYPE (KILOTONS), 2020-2029
TABLE 127 SAUDI ARABIA FLY ASH MARKET BY APPLICATION (USD BILLION), 2020-2029
TABLE 128 SAUDI ARABIA FLY ASH MARKET BY APPLICATION (KILOTONS), 2020-2029
TABLE 129 SOUTH AFRICA FLY ASH MARKET BY TYPE (USD BILLION), 2020-2029
TABLE 130 SOUTH AFRICA FLY ASH MARKET BY TYPE (KILOTONS), 2020-2029
TABLE 131 SOUTH AFRICA FLY ASH MARKET BY APPLICATION (USD BILLION), 2020-2029
TABLE 132 SOUTH AFRICA FLY ASH MARKET BY APPLICATION (KILOTONS), 2020-2029
TABLE 133 REST OF MIDDLE EAST AND AFRICA FLY ASH MARKET BY TYPE (USD BILLION), 2020-2029
TABLE 134 REST OF MIDDLE EAST AND AFRICA FLY ASH MARKET BY TYPE (KILOTONS), 2020-2029
TABLE 135 REST OF MIDDLE EAST AND AFRICA FLY ASH MARKET BY APPLICATION (USD BILLION), 2020-2029
TABLE 136 REST OF MIDDLE EAST AND AFRICA FLY ASH MARKET BY APPLICATION (KILOTONS), 2020-2029
LIST OF FIGURES
FIGURE 1 MARKET DYNAMICS
FIGURE 2 MARKET SEGMENTATION
FIGURE 3 REPORT TIMELINES: YEARS CONSIDERED
FIGURE 4 DATA TRIANGULATION
FIGURE 5 BOTTOM-UP APPROACH
FIGURE 6 TOP-DOWN APPROACH
FIGURE 7 RESEARCH FLOW
FIGURE 8 GLOBAL FLY ASH MARKET BY TYPE, USD BILLION, 2020-2029
FIGURE 9 GLOBAL FLY ASH MARKET BY APPLICATION, USD BILLION, 2020-2029
FIGURE 10 GLOBAL FLY ASH MARKET BY REGION, USD BILLION, 2020-2029
FIGURE 11 PORTER’S FIVE FORCES MODEL
FIGURE 12 GLOBAL FLY ASH MARKET BY TYPE, USD BILLION, 2021
FIGURE 13 GLOBAL FLY ASH MARKET BY APPLICATION, USD BILLION, 2021
FIGURE 14 GLOBAL FLY ASH MARKET BY REGION, USD BILLION, 2021
FIGURE 15 MARKET SHARE ANALYSIS
FIGURE 16 CHARAH SOLUTIONS, INC.: COMPANY SNAPSHOT
FIGURE 17 BORAL LIMITED: COMPANY SNAPSHOT
FIGURE 18 WASTE MANAGEMENT, INC.: COMPANY SNAPSHOT
FIGURE 19 SEFA: COMPANY SNAPSHOT
FIGURE 20 HOLCIM: COMPANY SNAPSHOT
FIGURE 21 TITAN CEMENT GROUP: COMPANY SNAPSHOT
FIGURE 22 DUROMAR, INC: COMPANY SNAPSHOT
FIGURE 23 AGGREGATE INDUSTRIES: COMPANY SNAPSHOT
FIGURE 24 ASHTECH: COMPANY SNAPSHOT
FIGURE 25 LAFARGE S.A.: COMPANY SNAPSHOT
DOWNLOAD FREE SAMPLE REPORT
License Type
SPEAK WITH OUR ANALYST
Want to know more about the report or any specific requirement?
WANT TO CUSTOMIZE THE REPORT?
Our Clients Speak
We asked them to research ‘ Equipment market’ all over the world, and their whole arrangement was helpful to us. thehealthanalytics.com insightful analysis and reports contributed to our current analysis and in creating a future strategy. Besides, the te
Yosuke Mitsui
Senior Associate Construction Equipment Sales & Marketing
We asked them to research ‘Equipment market’ all over the world, and their whole arrangement was helpful to us. thehealthanalytics.com insightful analysis and reports contributed to our current analysis and in creating a future strategy. Besides, the te


