

Base Year Value ()
x.x %
x.x %
CAGR ()
x.x %
x.x %
Forecast Year Value ()
x.x %
x.x %
Historical Data Period
Largest Region
Forecast Period
Mercado de catalizadores de oro por tipo (catalizadores de oro homogéneos, catalizadores de oro heterogéneos), aplicación (industrial, comercial, otros), usuario final (fabricación de productos químicos, productos farmacéuticos, petroquímicos, aplicaciones ambientales, energía y pilas de combustible, electrónica y comunicación) y por región Tendencias globales y pronóstico de 2022 a 2029
Instant access to hundreds of data points and trends
- Market estimates from 2014-2029
- Competitive analysis, industry segmentation, financial benchmarks
- Incorporates SWOT, Porter's Five Forces and risk management frameworks
- PDF report or online database with Word, Excel and PowerPoint export options
- 100% money back guarantee
Descripción general del mercado de catalizadores de oro
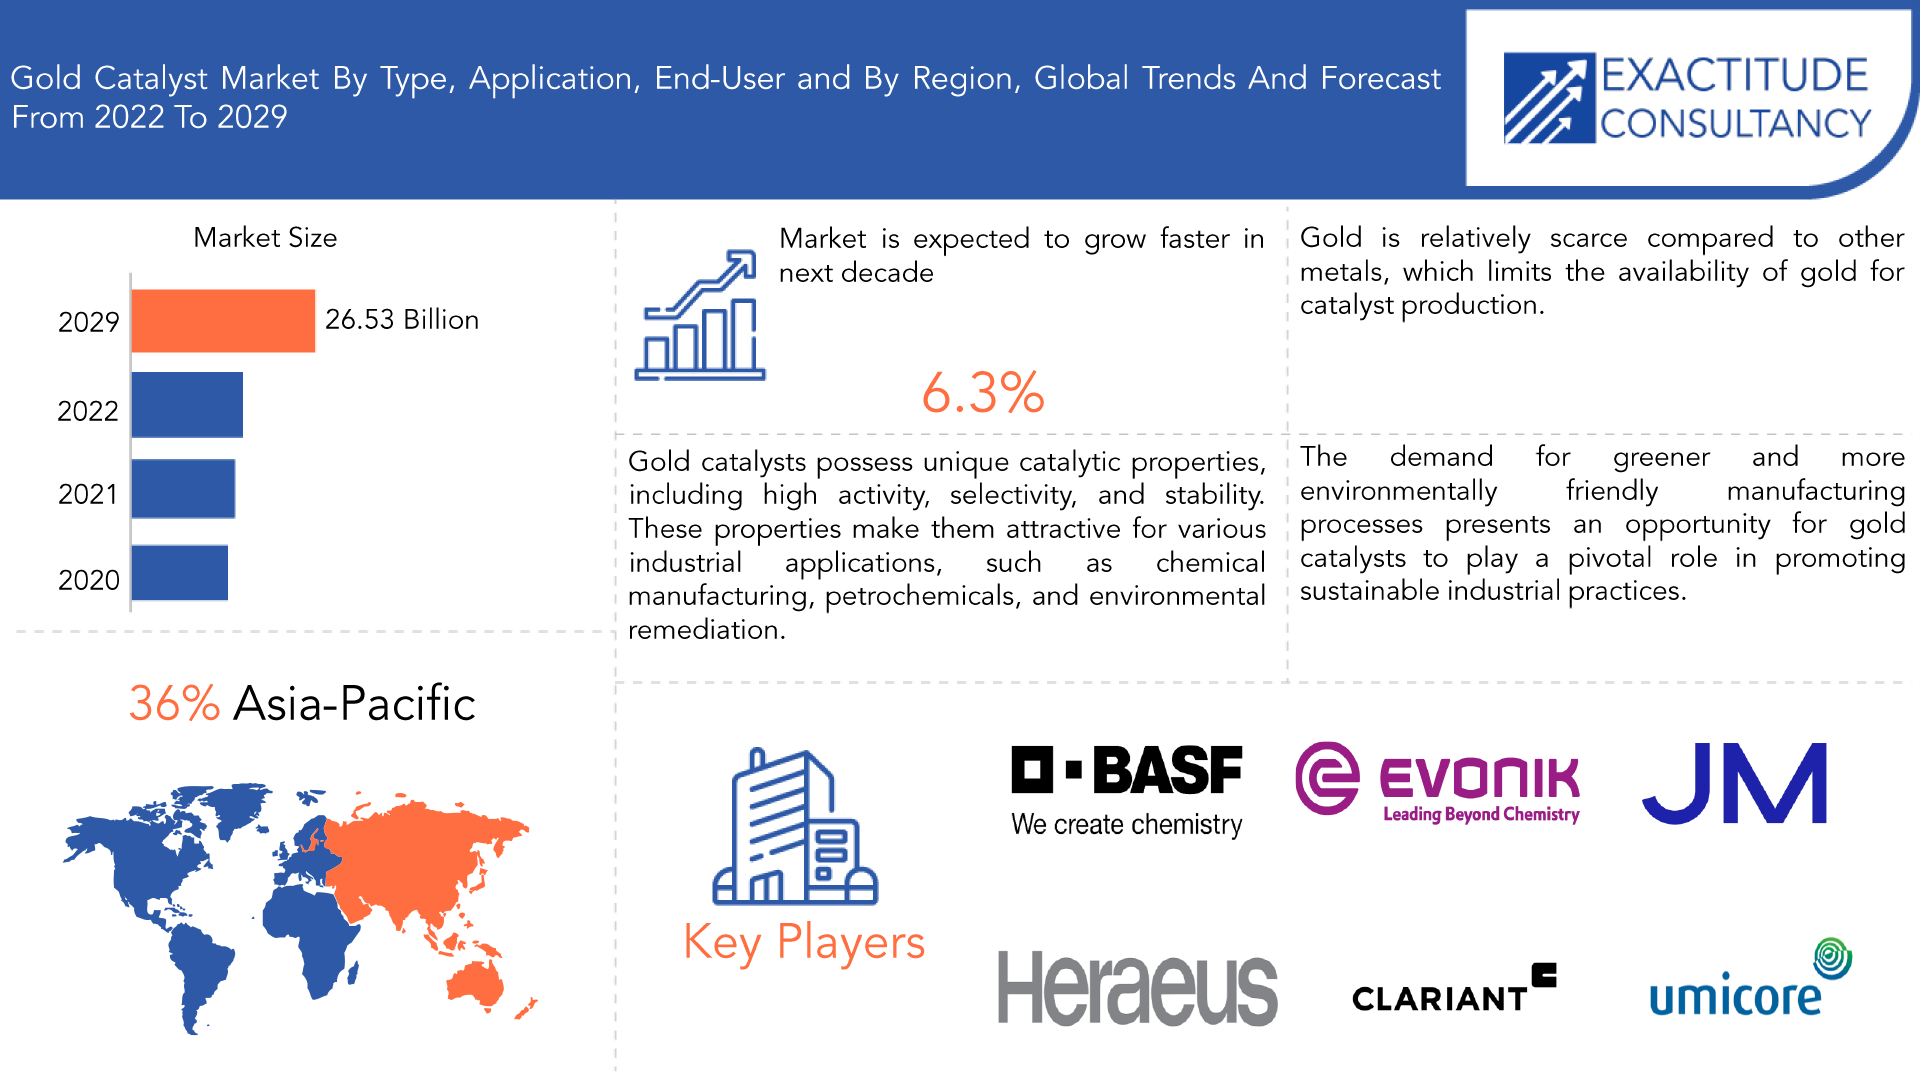
Se proyecta que el mercado mundial de catalizadores de oro alcance los USD 749,97 millones para 2029 desde los USD 432,76 millones en 2020, con una CAGR del 6,3 % entre 2022 y 2029.
Un catalizador es una sustancia o material que acelera la velocidad de un proceso químico sin ser consumido por la reacción misma. Los catalizadores son partes esenciales de varios procesos industriales que se utilizan para fabricar alimentos, productos químicos y otros materiales.
El mercado de catalizadores de oro se refiere a la industria que se ocupa de la producción, distribución y utilización de catalizadores que contienen oro como componente activo. Son materiales que incorporan nanopartículas de oro o complejos de oro, que poseen propiedades catalíticas únicas. Los catalizadores de oro han captado el interés de investigadores y desarrolladores de todo el mundo debido a su excelente estabilidad y rendimiento catalítico. Muestran una gran selectividad en los procesos de oxidación, lo que permite la producción de importantes productos químicos con altos rendimientos. Su participación en los procesos de hidrogenación mejora la eficiencia de conversión de compuestos insaturados en productos más deseados.
En comparación con otros catalizadores, los catalizadores de oro tienen una serie de ventajas. Tienen una selectividad excepcional, lo que les permite controlar las reacciones de manera que solo creen los productos deseados y ningún subproducto no deseado. Las altas temperaturas y los entornos corrosivos son solo dos de las difíciles condiciones de reacción que los catalizadores de oro pueden manejar con facilidad. Los catalizadores de oro también son reconocidos por su resistencia al envenenamiento por impurezas, lo que los hace apropiados para combinaciones de reacciones complicadas.
| ATRIBUTO | DETALLES |
| Periodo de estudio | 2022-2029 |
| Año base | 2022 |
| Año estimado | 2023 |
| Año pronosticado | 2023-2029 |
| Periodo histórico | 2018-2022 |
| Unidad | Valor (miles de millones de USD) Volumen (kilotones) |
| Segmentación | Por producto, por aplicación, por usuario final, por región |
| Por producto |
|
| Por aplicación |
|
| Por el usuario final |
|
| Por región |
|
Sin embargo, el oro tiene algunas propiedades inesperadas: puede funcionar como catalizador, convirtiendo el monóxido de carbono (CO) en dióxido de carbono (CO2) cuando se encuentra en forma de pequeños fragmentos conocidos como nanopartículas. Como catalizador, el oro acelera de repente procesos químicos deseables, como la eliminación de olores y toxinas o la limpieza de los gases de escape de los automóviles.
Demanda creciente de procesos de fabricación más ecológicos y respetuosos con el medio ambiente. Los catalizadores de oro permiten reacciones suaves y selectivas, minimizando el uso de productos químicos peligrosos y reduciendo el impacto ambiental. Además, el creciente énfasis en la sostenibilidad y las prácticas de química ecológica en industrias como la farmacéutica, la química y la petroquímica ha impulsado la demanda de catalizadores de oro. Estos desempeñan un papel vital a la hora de permitir procesos de producción más limpios y sostenibles, en consonancia con el impulso mundial hacia un futuro más ecológico. Además, la expansión de las aplicaciones de los catalizadores de oro ha contribuido a su creciente popularidad. Desde la síntesis farmacéutica hasta la remediación ambiental y las tecnologías de energía renovable , los catalizadores de oro han demostrado su versatilidad y eficacia.
El coste relativamente alto de los catalizadores de oro en comparación con otros catalizadores típicos es una de las principales limitaciones. El oro es un metal precioso costoso y su uso en catalizadores eleva el coste total de producción. Cuando se consideran aplicaciones industriales a gran escala, donde la rentabilidad y la competitividad son fundamentales, el elemento de coste se vuelve aún más importante. Esta restricción de precio puede restringir el uso de catalizadores de oro en sectores sensibles a los precios.
El oro es un recurso finito y su extracción y suministro están sujetos a factores geológicos y geopolíticos. La disponibilidad limitada de reservas de oro puede plantear desafíos para satisfacer la creciente demanda de catalizadores de oro. La escasez de oro puede generar volatilidad de precios e interrupciones en la cadena de suministro, lo que afecta la estabilidad y la accesibilidad de los catalizadores de oro en el mercado.
La industria farmacéutica ofrece inmensas oportunidades para los catalizadores de oro. Estos desempeñan un papel crucial en la síntesis de ingredientes farmacéuticos activos (API) e intermediarios farmacéuticos. Su alta selectividad y eficiencia permiten la síntesis de moléculas complejas con menos pasos y menos desechos.
Los catalizadores de oro también pueden facilitar la producción de compuestos quirales, esenciales para el descubrimiento y desarrollo de fármacos. A medida que la demanda de fármacos innovadores continúa aumentando, los catalizadores de oro ofrecen soluciones únicas para la síntesis farmacéutica. Los catalizadores de oro desempeñan un papel crucial en el campo de la nanotecnología. Permiten un control preciso sobre la síntesis y el ensamblaje de nanopartículas , lo que facilita la producción de nanomateriales con propiedades y funcionalidades personalizadas.
[título id="attachment_20030" align="aligncenter" width="1920"]
Frequently Asked Questions
• What is the worth of the gold catalyst market?
The global gold catalyst market is projected to reach USD 26.53 billion by 2029 from USD 18.01 billion in 2020, at a CAGR of 6.3 % from 2022 to 2029.
• What is the share of the Asia-Pacific gold catalyst industry?
Asia-Pacific dominates the gold catalyst market, with a market share of over 36%.
• Which are the top companies to hold the market share in the gold catalyst market?
BASF, Evonik Industries Ag, Johnson Matthey Plc., Heraeus Group, Clariant International Ltd., Umicore, Alfa Aesar, Chimet S.P.A, American Elements, Vineeth Precious Catalysts Pvt. Ltd are among the leading players in the global gold catalyst market.
• What is the CAGR of gold catalyst market?
The global gold catalyst market registered a CAGR of 6.3 % from 2022 to 2029.
• What are the key factors driving the market?
The key factors driving the gold catalyst market include increasing demand from various industries, the unique catalytic properties of gold, technological advancements, environmental regulations and sustainability initiatives, research and development activities, and the growth of the electronics and renewable energy sectors.
Gold Catalyst Market Segment Analysis
The global gold catalyst market is segmented by type, application, end-user and region.
Based on type, the gold catalyst market is classified into homogeneous gold catalysts, heterogeneous gold catalysts. Heterogeneous gold catalysts tend to dominate the market due to their wider range of applications and adaptability for extensive industrial processes. Heterogeneous gold catalysts, consist of gold nanoparticles or clusters supported on solid materials such as metal oxides, carbon, or zeolites. These catalysts have the particular benefit of being able to separate from the reaction mixture, allowing for facile separation and recycling. Heterogeneous gold catalysts have good stability, lengthy catalytic lifetimes, and are suited for large-scale industrial applications. They are frequently utilized in a variety of catalytic processes, including oxidation reactions, hydrogenation, and carbon monoxide oxidation.
Homogeneous gold catalysts refer to catalysts where gold is uniformly dispersed in a liquid phase, typically a solvent or a reaction medium. These catalysts are typically in the form of gold complexes or gold ions, often stabilized by ligands.
Based on application, the gold catalyst market is bifurcated into industrial, commercial, others. industrial gold catalysts that hold the largest share. The demand for industrial gold catalysts is driven by the significant usage in large-scale manufacturing processes across various industries. These catalysts are crucial for the production of bulk chemicals and intermediates, contributing to the growth of the overall gold catalyst market. These catalysts are employed in various industries such as petrochemicals, chemicals, pharmaceuticals, and the automotive sector. Industrial gold catalysts play a crucial role in promoting efficient and selective chemical reactions, enabling the production of a wide range of chemicals, intermediates, and materials.
Commercial gold catalysts are widely used in commercial applications, typically in smaller-scale operations. These catalysts find applications in areas such as fine chemicals, electronics, laboratory research, and specialty manufacturing. Commercial gold catalysts offer specific functionalities and selectivity’s that are tailored to meet the requirements of specific applications.
Based on end-user, the gold catalyst market is bifurcated into chemical manufacturing, pharmaceuticals, petrochemicals, environmental applications, energy and fuel cells, electronics and communication. The chemical manufacturing sector is one of the prominent end-users of gold catalysts. Gold catalysts are extensively employed in various chemical reactions, such as oxidation, hydrogenation, and carbon-carbon bond formation. They enable the production of a wide range of chemicals, including specialty chemicals, fine chemicals, and intermediates. The pharmaceutical sector relies on gold catalysts for the synthesis of pharmaceutical intermediates and active pharmaceutical ingredients (APIs). Gold catalysts offer unique reactivity and selectivity, enabling the construction of complex molecular structures. They play a crucial role in pharmaceutical manufacturing processes, contributing to the development of new drugs and therapeutic agents.
[caption id="attachment_20031" align="aligncenter" width="627"]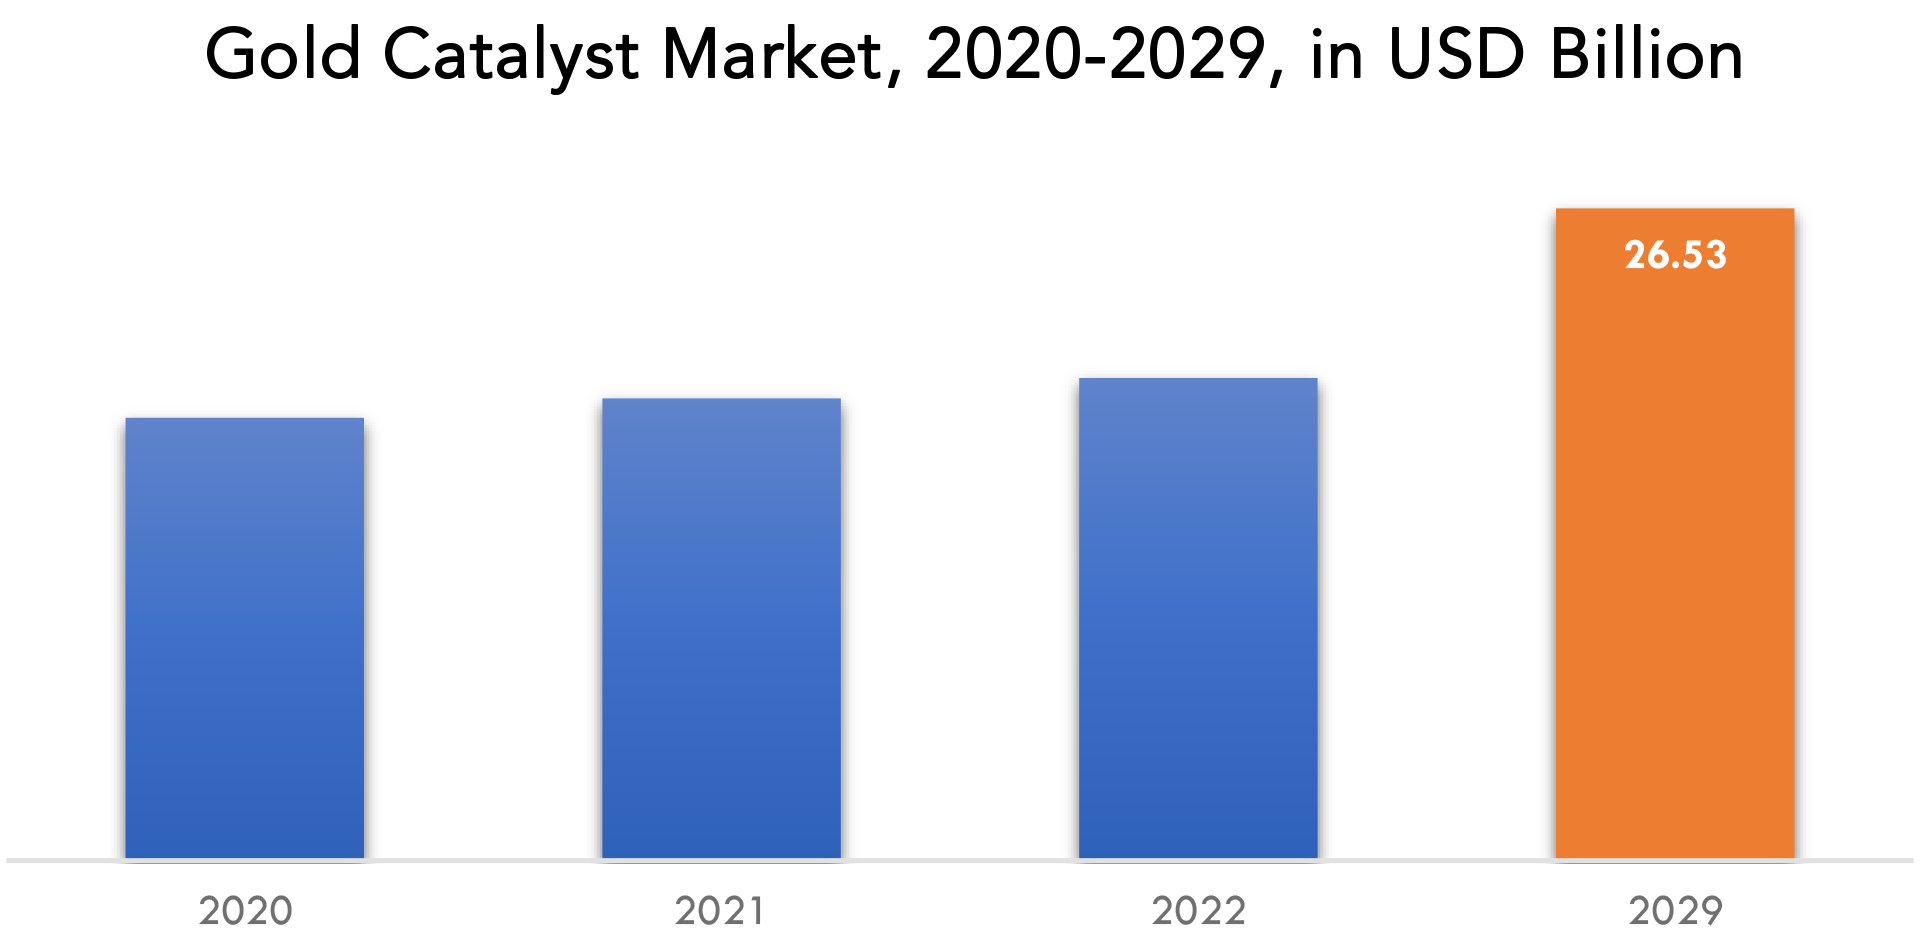
Gold Catalyst Market Players
The global gold catalyst market key players include BASF, Evonik Industries Ag, Johnson Matthey Plc., Heraeus Group, Clariant International Ltd., Umicore, Alfa Aesar, Chimet S.P.A, American Elements, Vineeth Precious Catalysts Pvt. Ltd.
Recent News12th January 2023: Heraeus Precious Metals and Hulteberg Chemistry & Engineering AB agreed on a strategic partnership to jointly develop and commercialize a variety of catalysts that are required for the operation of solid oxide fuel cells (SOFC).
SEPTEMBER 28, 2022: BASF introduced the novel X3DTM technology, a new additive manufacturing technology for catalysts based on 3D printing.
Who Should Buy? Or Key stakeholders
- Gold catalyst unit producers
- Raw material producers and suppliers
- Gold producers and suppliers
- Gold catalyst distributors and traders
- End-use sectors
- Governments and R&D institutions
- Market research and consulting firms
- Associations and industry bodies
Gold Catalyst Market Regional Analysis
The gold catalyst market by region includes North America, Asia-Pacific (APAC), Europe, South America, and Middle East & Africa (MEA).
- North America: includes the US, Canada, Mexico
- Asia Pacific: includes China, Japan, South Korea, India, Australia, ASEAN and Rest of APAC
- Europe: includes UK, Germany, France, Italy, Spain, Russia, and Rest of Europe
- South America: includes Brazil, Argentina and Rest of South America
- Middle East & Africa: includes Turkey, UAE, Saudi Arabia, South Africa, and Rest of MEA
The Asia-Pacific region is dominant in the gold catalyst market. Countries such as China, Japan, India, and South Korea are major contributors to market expansion. The region's burgeoning chemical industry, growing manufacturing sector, and increasing investments in research and development fuel the demand for gold catalysts.
North America has witnessing rapid growth for gold catalysts market. The region is characterized by a strong presence of key market players, advanced research infrastructure, and a well-established chemical industry. The United States, in particular, contributes significantly to the growth of the gold catalyst market, driven by the demand from various sectors such as pharmaceuticals, chemicals, and electronics. The region's focus on innovation and technological advancements further propels market growth.
[caption id="attachment_20032" align="aligncenter" width="618"]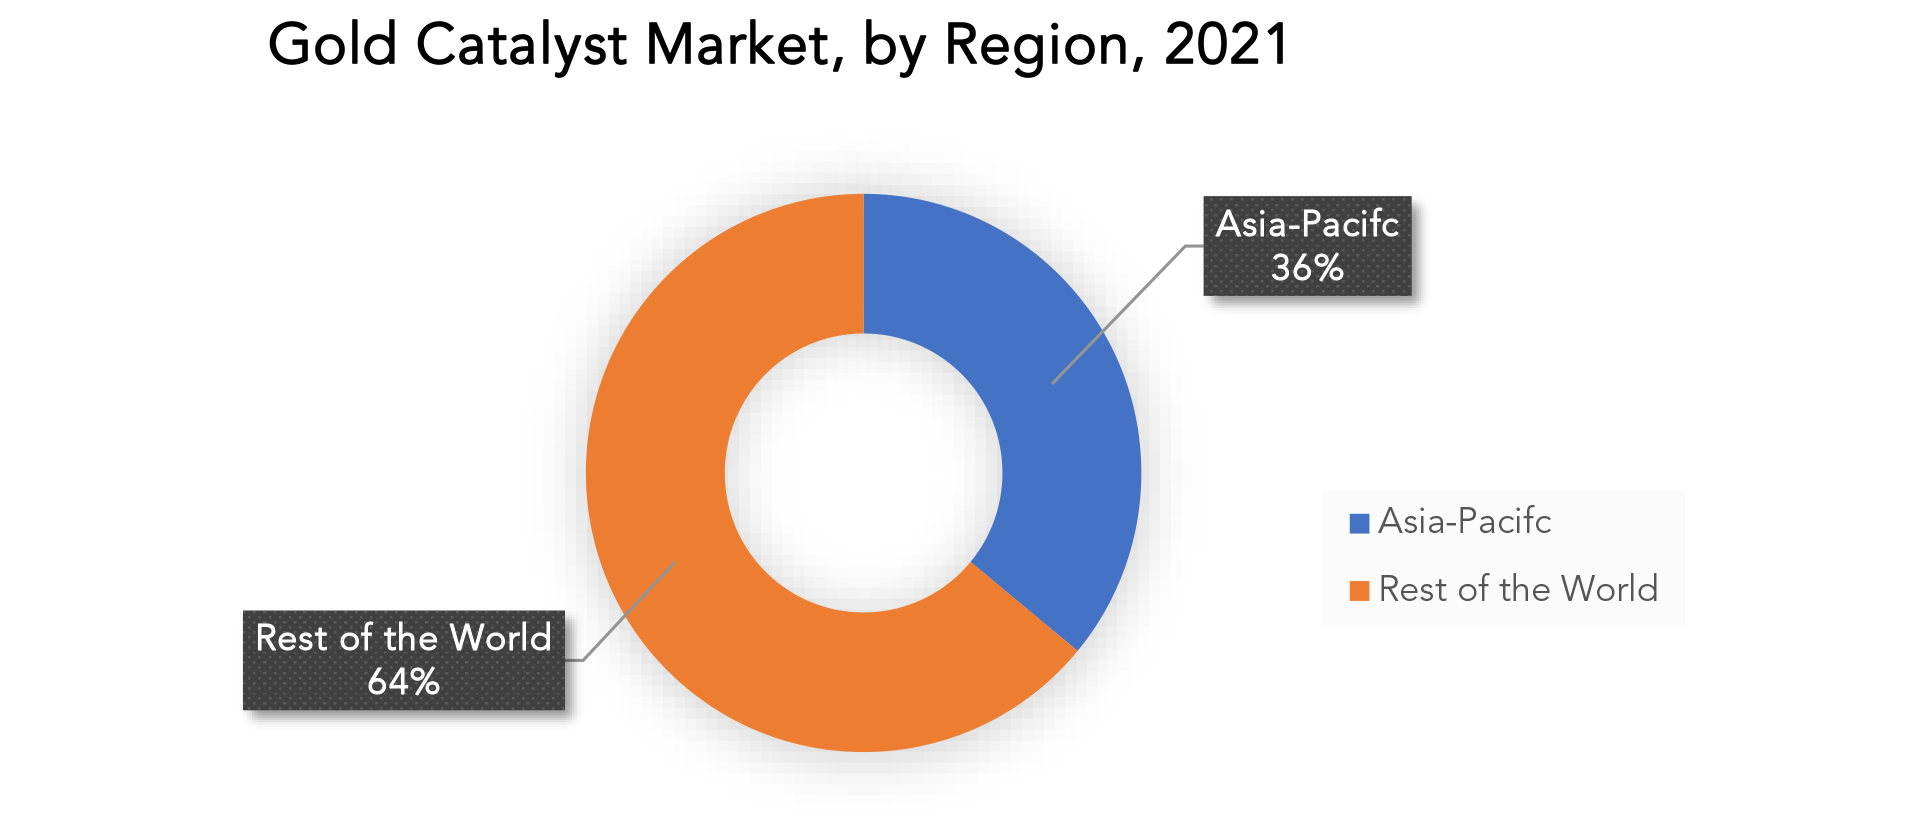
Key Market Segments: Gold Catalyst Market
Gold Catalyst Market by Product 2022-2029, (USD Billion) (Kilotons)- Homogeneous Gold Catalysts
- Heterogeneous Gold Catalysts
- Industrial
- Commercial
- Others
- Chemical Manufacturing
- Pharmaceuticals
- Petrochemicals
- Environmental Applications
- Energy and Fuel Cells
- Electronics and Communication
- North America
- Europe
- Asia Pacific
- South America
- Middle East and Africa
Exactitude Consultancy Services Key Objectives
- Increasing sales and market share
- Developing new technology
- Improving profitability
- Entering new markets
- Enhancing brand reputation
Key Question Answered
- What is the expected growth rate of the gold catalyst market over the next 7 years?
- Who are the major players in the gold catalyst market and what is their market share?
- What are the end-user industries driving demand for market and what is their outlook?
- What are the opportunities for growth in emerging markets such as Asia-Pacific, Middle East, and Africa?
- How is the economic environment affecting the gold catalyst market, including factors such as interest rates, inflation, and exchange rates?
- What is the expected impact of government policies and regulations on the gold catalyst market?
- What is the current and forecasted size and growth rate of the global gold catalyst market?
- What are the key drivers of growth in the gold catalyst market?
- What are the distribution channels and supply chain dynamics in the gold catalyst market?
- What are the technological advancements and innovations in the gold catalyst market and their impact on product development and growth?
- What are the regulatory considerations and their impact on the market?
- What are the challenges faced by players in the gold catalyst market and how are they addressing these challenges?
- What are the opportunities for growth and expansion in the gold catalyst market?
- What are the product offerings and specifications of leading players in the market?
- What is the pricing trend of gold catalyst in the market and what is the impact of raw material prices on the price trend?
- INTRODUCCIÓN
- DEFINICIÓN DE MERCADO
- SEGMENTACIÓN DEL MERCADO
- CRONOGRAMAS DE INVESTIGACIÓN
- SUPUESTOS Y LIMITACIONES
- METODOLOGÍA DE LA INVESTIGACIÓN
- MINERÍA DE DATOS
- INVESTIGACIÓN SECUNDARIA
- INVESTIGACIÓN PRIMARIA
- ASESORAMIENTO DE EXPERTOS EN LA MATERIA
- CONTROLES DE CALIDAD
- REVISIÓN FINAL
- TRIANGULACIÓN DE DATOS
- ENFOQUE DE ABAJO HACIA ARRIBA
- ENFOQUE DE ARRIBA HACIA ABAJO
- FLUJO DE INVESTIGACIÓN
- FUENTES DE DATOS
- MINERÍA DE DATOS
- RESUMEN EJECUTIVO
- PANORAMA DEL MERCADO
- PERSPECTIVAS DEL MERCADO MUNDIAL DE CATALIZADORES DE ORO
- IMPULSORES DEL MERCADO
- RESTRICCIONES DEL MERCADO
- OPORTUNIDADES DE MERCADO
- IMPACTO DEL COVID-19 EN EL MERCADO DE CATALIZADORES DE ORO
- MODELO DE LAS CINCO FUERZAS DE PORTER
- AMENAZA DE NUEVOS INGRESANTES
- AMENAZA DE SUSTITUTOS
- PODER DE NEGOCIACIÓN DE LOS PROVEEDORES
- PODER DE NEGOCIACIÓN DE LOS CLIENTES
- GRADO DE COMPETENCIA
- ANÁLISIS DE LA CADENA DE VALOR DE LA INDUSTRIA
- PERSPECTIVAS DEL MERCADO MUNDIAL DE CATALIZADORES DE ORO
- MERCADO GLOBAL DE CATALIZADORES DE ORO POR TIPO , 2020-2029, (MILES DE MILLONES DE USD) (KILOTONELADAS)
- CATALIZADORES DE ORO HOMOGÉNEOS
- CATALIZADORES DE ORO HETEROGÉNEOS
- MERCADO GLOBAL DE CATALIZADORES DE ORO POR APLICACIÓN , 2020-2029, (MILES DE MILLONES DE USD) (KILOTONELADAS)
- INDUSTRIAL
- COMERCIAL
- OTROS
- MERCADO GLOBAL DE CATALIZADORES DE ORO POR USUARIO FINAL , 2020-2029, (MILES DE MILLONES DE USD) (KILOTONELADAS)
- FABRICACIÓN DE PRODUCTOS QUÍMICOS
- PRODUCTOS FARMACÉUTICOS
- PETROQUÍMICOS
- APLICACIONES AMBIENTALES
- ENERGÍA Y PILAS DE COMBUSTIBLE
- ELECTRÓNICA Y COMUNICACIÓN
- MERCADO GLOBAL DE CATALIZADORES DE ORO POR REGIÓN, 2020-2029, (MILES DE MILLONES DE USD) (KILOTONELADAS)
- AMÉRICA DEL NORTE
- A NOSOTROS
- CANADÁ
- MÉXICO
- SUDAMERICA
- BRASIL
- ARGENTINA
- COLOMBIA
- RESTO DE SUDAMÉRICA
- EUROPA
- ALEMANIA
- Reino Unido
- FRANCIA
- ITALIA
- ESPAÑA
- RUSIA
- RESTO DE EUROPA
- ASIA PACÍFICO
- INDIA
- PORCELANA
- JAPÓN
- COREA DEL SUR
- AUSTRALIA
- ASIA SUDESTE
- RESTO DE ASIA PACÍFICO
- ORIENTE MEDIO Y ÁFRICA
- Emiratos Árabes Unidos
- ARABIA SAUDITA
- SUDÁFRICA
- RESTO DE ORIENTE MEDIO Y ÁFRICA
- AMÉRICA DEL NORTE
- PERFILES DE EMPRESAS* (DESCRIPCIÓN GENERAL DEL NEGOCIO, INFORMACIÓN GENERAL DE LA EMPRESA, PRODUCTOS OFRECIDOS, DESARROLLOS RECIENTES)
- BASF
- EVONIK INDUSTRIES AG
- Compañía: Johnson Matthey PLC.
- GRUPO HERAEUS
- CLARIANT INTERNACIONAL LTD.
- UMICORE
- Alfa Aesar
- SPA CHIMET
- ELEMENTOS AMERICANOS
- VINEETH PRECIOUS CATALYSTS PVT. LTD *LA LISTA DE EMPRESAS ES ORIENTATIVA
LISTA DE TABLAS
TABLE 1 GLOBAL GOLD CATALYST MARKET BY TYPE (USD BILLION) 2020-2029
TABLE 2 GLOBAL GOLD CATALYST MARKET BY TYPE (KILOTONS) 2020-2029
TABLE 3 GLOBAL GOLD CATALYST MARKET BY APPLICATION (USD BILLION) 2020-2029
TABLE 4 GLOBAL GOLD CATALYST MARKET BY APPLICATION (KILOTONS) 2020-2029
TABLE 5 GLOBAL GOLD CATALYST MARKET BY END-USER (USD BILLION) 2020-2029
TABLE 6 GLOBAL GOLD CATALYST MARKET BY END-USER (KILOTONS) 2020-2029
TABLE 7 GLOBAL GOLD CATALYST MARKET BY REGION (USD BILLION) 2020-2029
TABLE 8 GLOBAL GOLD CATALYST MARKET BY REGION (KILOTONS) 2020-2029
TABLE 9 NORTH AMERICA GOLD CATALYST MARKET BY COUNTRY (USD BILLION) 2020-2029
TABLE 10 NORTH AMERICA GOLD CATALYST MARKET BY COUNTRY (KILOTONS) 2020-2029
TABLE 11 NORTH AMERICA GOLD CATALYST MARKET BY TYPE (USD BILLION) 2020-2029
TABLE 12 NORTH AMERICA GOLD CATALYST MARKET BY TYPE (KILOTONS) 2020-2029
TABLE 13 NORTH AMERICA GOLD CATALYST MARKET BY APPLICATION (USD BILLION) 2020-2029
TABLE 14 NORTH AMERICA GOLD CATALYST MARKET BY APPLICATION (KILOTONS) 2020-2029
TABLE 15 NORTH AMERICA GOLD CATALYST MARKET BY END-USER (USD BILLION) 2020-2029
TABLE 16 NORTH AMERICA GOLD CATALYST MARKET BY END-USER (KILOTONS) 2020-2029
TABLE 17 US GOLD CATALYST MARKET BY TYPE (USD BILLION) 2020-2029
TABLE 18 US GOLD CATALYST MARKET BY TYPE (KILOTONS) 2020-2029
TABLE 19 US GOLD CATALYST MARKET BY APPLICATION (USD BILLION) 2020-2029
TABLE 20 US GOLD CATALYST MARKET BY APPLICATION (KILOTONS) 2020-2029
TABLE 21 US GOLD CATALYST MARKET BY END-USER (USD BILLION) 2020-2029
TABLE 22 US GOLD CATALYST MARKET BY END-USER (KILOTONS) 2020-2029
TABLE 23 CANADA GOLD CATALYST MARKET BY TYPE (USD BILLION) 2020-2029
TABLE 24 CANADA GOLD CATALYST MARKET BY TYPE (KILOTONS) 2020-2029
TABLE 25 CANADA GOLD CATALYST MARKET BY APPLICATION (USD BILLION) 2020-2029
TABLE 26 CANADA GOLD CATALYST MARKET BY APPLICATION (KILOTONS) 2020-2029
TABLE 27 CANADA GOLD CATALYST MARKET BY END-USER (USD BILLION) 2020-2029
TABLE 28 CANADA GOLD CATALYST MARKET BY END-USER (KILOTONS) 2020-2029
TABLE 29 MEXICO GOLD CATALYST MARKET BY TYPE (USD BILLION) 2020-2029
TABLE 30 MEXICO GOLD CATALYST MARKET BY TYPE (KILOTONS) 2020-2029
TABLE 31 MEXICO GOLD CATALYST MARKET BY APPLICATION (USD BILLION) 2020-2029
TABLE 32 MEXICO GOLD CATALYST MARKET BY APPLICATION (KILOTONS) 2020-2029
TABLE 33 MEXICO GOLD CATALYST MARKET BY END-USER (USD BILLION) 2020-2029
TABLE 34 MEXICO GOLD CATALYST MARKET BY END-USER (KILOTONS) 2020-2029
TABLE 35 SOUTH AMERICA GOLD CATALYST MARKET BY COUNTRY (USD BILLION) 2020-2029
TABLE 36 SOUTH AMERICA GOLD CATALYST MARKET BY COUNTRY (KILOTONS) 2020-2029
TABLE 37 SOUTH AMERICA GOLD CATALYST MARKET BY TYPE (USD BILLION) 2020-2029
TABLE 38 SOUTH AMERICA GOLD CATALYST MARKET BY TYPE (KILOTONS) 2020-2029
TABLE 39 SOUTH AMERICA GOLD CATALYST MARKET BY APPLICATION (USD BILLION) 2020-2029
TABLE 40 SOUTH AMERICA GOLD CATALYST MARKET BY APPLICATION (KILOTONS) 2020-2029
TABLE 41 SOUTH AMERICA GOLD CATALYST MARKET BY END-USER (USD BILLION) 2020-2029
TABLE 42 SOUTH AMERICA GOLD CATALYST MARKET BY END-USER (KILOTONS) 2020-2029
TABLE 43 BRAZIL GOLD CATALYST MARKET BY TYPE (USD BILLION) 2020-2029
TABLE 44 BRAZIL GOLD CATALYST MARKET BY TYPE (KILOTONS) 2020-2029
TABLE 45 BRAZIL GOLD CATALYST MARKET BY APPLICATION (USD BILLION) 2020-2029
TABLE 46 BRAZIL GOLD CATALYST MARKET BY APPLICATION (KILOTONS) 2020-2029
TABLE 47 BRAZIL GOLD CATALYST MARKET BY END-USER (USD BILLION) 2020-2029
TABLE 48 BRAZIL GOLD CATALYST MARKET BY END-USER (KILOTONS) 2020-2029
TABLE 49 ARGENTINA GOLD CATALYST MARKET BY TYPE (USD BILLION) 2020-2029
TABLE 50 ARGENTINA GOLD CATALYST MARKET BY TYPE (KILOTONS) 2020-2029
TABLE 51 ARGENTINA GOLD CATALYST MARKET BY APPLICATION (USD BILLION) 2020-2029
TABLE 52 ARGENTINA GOLD CATALYST MARKET BY APPLICATION (KILOTONS) 2020-2029
TABLE 53 ARGENTINA GOLD CATALYST MARKET BY END-USER (USD BILLION) 2020-2029
TABLE 54 ARGENTINA GOLD CATALYST MARKET BY END-USER (KILOTONS) 2020-2029
TABLE 55 COLOMBIA GOLD CATALYST MARKET BY TYPE (USD BILLION) 2020-2029
TABLE 56 COLOMBIA GOLD CATALYST MARKET BY TYPE (KILOTONS) 2020-2029
TABLE 57 COLOMBIA GOLD CATALYST MARKET BY APPLICATION (USD BILLION) 2020-2029
TABLE 58 COLOMBIA GOLD CATALYST MARKET BY APPLICATION (KILOTONS) 2020-2029
TABLE 59 COLOMBIA GOLD CATALYST MARKET BY END-USER (USD BILLION) 2020-2029
TABLE 60 COLOMBIA GOLD CATALYST MARKET BY END-USER (KILOTONS) 2020-2029
TABLE 61 REST OF SOUTH AMERICA GOLD CATALYST MARKET BY TYPE (USD BILLION) 2020-2029
TABLE 62 REST OF SOUTH AMERICA GOLD CATALYST MARKET BY TYPE (KILOTONS) 2020-2029
TABLE 63 REST OF SOUTH AMERICA GOLD CATALYST MARKET BY APPLICATION (USD BILLION) 2020-2029
TABLE 64 REST OF SOUTH AMERICA GOLD CATALYST MARKET BY APPLICATION (KILOTONS) 2020-2029
TABLE 65 REST OF SOUTH AMERICA GOLD CATALYST MARKET BY END-USER (USD BILLION) 2020-2029
TABLE 66 REST OF SOUTH AMERICA GOLD CATALYST MARKET BY END-USER (KILOTONS) 2020-2029
TABLE 67 ASIA-PACIFIC GOLD CATALYST MARKET BY COUNTRY (USD BILLION) 2020-2029
TABLE 68 ASIA-PACIFIC GOLD CATALYST MARKET BY COUNTRY (KILOTONS) 2020-2029
TABLE 69 ASIA-PACIFIC GOLD CATALYST MARKET BY TYPE (USD BILLION) 2020-2029
TABLE 70 ASIA-PACIFIC GOLD CATALYST MARKET BY TYPE (KILOTONS) 2020-2029
TABLE 71 ASIA-PACIFIC GOLD CATALYST MARKET BY APPLICATION (USD BILLION) 2020-2029
TABLE 72 ASIA-PACIFIC GOLD CATALYST MARKET BY APPLICATION (KILOTONS) 2020-2029
TABLE 73 ASIA-PACIFIC GOLD CATALYST MARKET BY END-USER (USD BILLION) 2020-2029
TABLE 74 ASIA-PACIFIC GOLD CATALYST MARKET BY END-USER (KILOTONS) 2020-2029
TABLE 75 INDIA GOLD CATALYST MARKET BY TYPE (USD BILLION) 2020-2029
TABLE 76 INDIA GOLD CATALYST MARKET BY TYPE (KILOTONS) 2020-2029
TABLE 77 INDIA GOLD CATALYST MARKET BY APPLICATION (USD BILLION) 2020-2029
TABLE 78 INDIA GOLD CATALYST MARKET BY APPLICATION (KILOTONS) 2020-2029
TABLE 79 INDIA GOLD CATALYST MARKET BY END-USER (USD BILLION) 2020-2029
TABLE 80 INDIA GOLD CATALYST MARKET BY END-USER (KILOTONS) 2020-2029
TABLE 81 CHINA GOLD CATALYST MARKET BY TYPE (USD BILLION) 2020-2029
TABLE 82 CHINA GOLD CATALYST MARKET BY TYPE (KILOTONS) 2020-2029
TABLE 83 CHINA GOLD CATALYST MARKET BY APPLICATION (USD BILLION) 2020-2029
TABLE 84 CHINA GOLD CATALYST MARKET BY APPLICATION (KILOTONS) 2020-2029
TABLE 85 CHINA GOLD CATALYST MARKET BY END-USER (USD BILLION) 2020-2029
TABLE 86 CHINA GOLD CATALYST MARKET BY END-USER (KILOTONS) 2020-2029
TABLE 87 JAPAN GOLD CATALYST MARKET BY TYPE (USD BILLION) 2020-2029
TABLE 88 JAPAN GOLD CATALYST MARKET BY TYPE (KILOTONS) 2020-2029
TABLE 89 JAPAN GOLD CATALYST MARKET BY APPLICATION (USD BILLION) 2020-2029
TABLE 90 JAPAN GOLD CATALYST MARKET BY APPLICATION (KILOTONS) 2020-2029
TABLE 91 JAPAN GOLD CATALYST MARKET BY END-USER (USD BILLION) 2020-2029
TABLE 92 JAPAN GOLD CATALYST MARKET BY END-USER (KILOTONS) 2020-2029
TABLE 93 SOUTH KOREA GOLD CATALYST MARKET BY TYPE (USD BILLION) 2020-2029
TABLE 94 SOUTH KOREA GOLD CATALYST MARKET BY TYPE (KILOTONS) 2020-2029
TABLE 95 SOUTH KOREA GOLD CATALYST MARKET BY APPLICATION (USD BILLION) 2020-2029
TABLE 96 SOUTH KOREA GOLD CATALYST MARKET BY APPLICATION (KILOTONS) 2020-2029
TABLE 97 SOUTH KOREA GOLD CATALYST MARKET BY END-USER (USD BILLION) 2020-2029
TABLE 98 SOUTH KOREA GOLD CATALYST MARKET BY END-USER (KILOTONS) 2020-2029
TABLE 99 AUSTRALIA GOLD CATALYST MARKET BY TYPE (USD BILLION) 2020-2029
TABLE 100 AUSTRALIA GOLD CATALYST MARKET BY TYPE (KILOTONS) 2020-2029
TABLE 101 AUSTRALIA GOLD CATALYST MARKET BY APPLICATION (USD BILLION) 2020-2029
TABLE 102 AUSTRALIA GOLD CATALYST MARKET BY APPLICATION (KILOTONS) 2020-2029
TABLE 103 AUSTRALIA GOLD CATALYST MARKET BY END-USER (USD BILLION) 2020-2029
TABLE 104 AUSTRALIA GOLD CATALYST MARKET BY END-USER (KILOTONS) 2020-2029
TABLE 105 SOUTH-EAST ASIA GOLD CATALYST MARKET BY TYPE (USD BILLION) 2020-2029
TABLE 106 SOUTH-EAST ASIA GOLD CATALYST MARKET BY TYPE (KILOTONS) 2020-2029
TABLE 107 SOUTH-EAST ASIA GOLD CATALYST MARKET BY APPLICATION (USD BILLION) 2020-2029
TABLE 108 SOUTH-EAST ASIA GOLD CATALYST MARKET BY APPLICATION (KILOTONS) 2020-2029
TABLE 109 SOUTH-EAST ASIA GOLD CATALYST MARKET BY END-USER (USD BILLION) 2020-2029
TABLE 110 SOUTH-EAST ASIA GOLD CATALYST MARKET BY END-USER (KILOTONS) 2020-2029
TABLE 111 REST OF ASIA PACIFIC GOLD CATALYST MARKET BY TYPE (USD BILLION) 2020-2029
TABLE 112 REST OF ASIA PACIFIC GOLD CATALYST MARKET BY TYPE (KILOTONS) 2020-2029
TABLE 113 REST OF ASIA PACIFIC GOLD CATALYST MARKET BY APPLICATION (USD BILLION) 2020-2029
TABLE 114 REST OF ASIA PACIFIC GOLD CATALYST MARKET BY APPLICATION (KILOTONS) 2020-2029
TABLE 115 REST OF ASIA PACIFIC GOLD CATALYST MARKET BY END-USER (USD BILLION) 2020-2029
TABLE 116 REST OF ASIA PACIFIC GOLD CATALYST MARKET BY END-USER (KILOTONS) 2020-2029
TABLE 117 EUROPE GOLD CATALYST MARKET BY COUNTRY (USD BILLION) 2020-2029
TABLE 118 EUROPE GOLD CATALYST MARKET BY COUNTRY (KILOTONS) 2020-2029
TABLE 119 EUROPE GOLD CATALYST MARKET BY TYPE (USD BILLION) 2020-2029
TABLE 120 EUROPE GOLD CATALYST MARKET BY TYPE (KILOTONS) 2020-2029
TABLE 121 EUROPE GOLD CATALYST MARKET BY APPLICATION (USD BILLION) 2020-2029
TABLE 122 EUROPE GOLD CATALYST MARKET BY APPLICATION (KILOTONS) 2020-2029
TABLE 123 EUROPE GOLD CATALYST MARKET BY END-USER (USD BILLION) 2020-2029
TABLE 124 EUROPE GOLD CATALYST MARKET BY END-USER (KILOTONS) 2020-2029
TABLE 125 GERMANY GOLD CATALYST MARKET BY TYPE (USD BILLION) 2020-2029
TABLE 126 GERMANY GOLD CATALYST MARKET BY TYPE (KILOTONS) 2020-2029
TABLE 127 GERMANY GOLD CATALYST MARKET BY APPLICATION (USD BILLION) 2020-2029
TABLE 128 GERMANY GOLD CATALYST MARKET BY APPLICATION (KILOTONS) 2020-2029
TABLE 129 GERMANY GOLD CATALYST MARKET BY END-USER (USD BILLION) 2020-2029
TABLE 130 GERMANY GOLD CATALYST MARKET BY END-USER (KILOTONS) 2020-2029
TABLE 131 UK GOLD CATALYST MARKET BY TYPE (USD BILLION) 2020-2029
TABLE 132 UK GOLD CATALYST MARKET BY TYPE (KILOTONS) 2020-2029
TABLE 133 UK GOLD CATALYST MARKET BY APPLICATION (USD BILLION) 2020-2029
TABLE 134 UK GOLD CATALYST MARKET BY APPLICATION (KILOTONS) 2020-2029
TABLE 135 UK GOLD CATALYST MARKET BY END-USER (USD BILLION) 2020-2029
TABLE 136 UK GOLD CATALYST MARKET BY END-USER (KILOTONS) 2020-2029
TABLE 137 FRANCE GOLD CATALYST MARKET BY TYPE (USD BILLION) 2020-2029
TABLE 138 FRANCE GOLD CATALYST MARKET BY TYPE (KILOTONS) 2020-2029
TABLE 139 FRANCE GOLD CATALYST MARKET BY APPLICATION (USD BILLION) 2020-2029
TABLE 140 FRANCE GOLD CATALYST MARKET BY APPLICATION (KILOTONS) 2020-2029
TABLE 141 FRANCE GOLD CATALYST MARKET BY END-USER (USD BILLION) 2020-2029
TABLE 142 FRANCE GOLD CATALYST MARKET BY END-USER (KILOTONS) 2020-2029
TABLE 143 ITALY GOLD CATALYST MARKET BY TYPE (USD BILLION) 2020-2029
TABLE 144 ITALY GOLD CATALYST MARKET BY TYPE (KILOTONS) 2020-2029
TABLE 145 ITALY GOLD CATALYST MARKET BY APPLICATION (USD BILLION) 2020-2029
TABLE 146 ITALY GOLD CATALYST MARKET BY APPLICATION (KILOTONS) 2020-2029
TABLE 147 ITALY GOLD CATALYST MARKET BY END-USER (USD BILLION) 2020-2029
TABLE 148 ITALY GOLD CATALYST MARKET BY END-USER (KILOTONS) 2020-2029
TABLE 149 SPAIN GOLD CATALYST MARKET BY TYPE (USD BILLION) 2020-2029
TABLE 150 SPAIN GOLD CATALYST MARKET BY TYPE (KILOTONS) 2020-2029
TABLE 151 SPAIN GOLD CATALYST MARKET BY APPLICATION (USD BILLION) 2020-2029
TABLE 152 SPAIN GOLD CATALYST MARKET BY APPLICATION (KILOTONS) 2020-2029
TABLE 153 SPAIN GOLD CATALYST MARKET BY END-USER (USD BILLION) 2020-2029
TABLE 154 SPAIN GOLD CATALYST MARKET BY END-USER (KILOTONS) 2020-2029
TABLE 155 RUSSIA GOLD CATALYST MARKET BY TYPE (USD BILLION) 2020-2029
TABLE 156 RUSSIA GOLD CATALYST MARKET BY TYPE (KILOTONS) 2020-2029
TABLE 157 RUSSIA GOLD CATALYST MARKET BY APPLICATION (USD BILLION) 2020-2029
TABLE 158 RUSSIA GOLD CATALYST MARKET BY APPLICATION (KILOTONS) 2020-2029
TABLE 159 RUSSIA GOLD CATALYST MARKET BY END-USER (USD BILLION) 2020-2029
TABLE 160 RUSSIA GOLD CATALYST MARKET BY END-USER (KILOTONS) 2020-2029
TABLE 161 REST OF EUROPE GOLD CATALYST MARKET BY TYPE (USD BILLION) 2020-2029
TABLE 162 REST OF EUROPE GOLD CATALYST MARKET BY TYPE (KILOTONS) 2020-2029
TABLE 163 REST OF EUROPE GOLD CATALYST MARKET BY APPLICATION (USD BILLION) 2020-2029
TABLE 164 REST OF EUROPE GOLD CATALYST MARKET BY APPLICATION (KILOTONS) 2020-2029
TABLE 165 REST OF EUROPE GOLD CATALYST MARKET BY END-USER (USD BILLION) 2020-2029
TABLE 166 REST OF EUROPE GOLD CATALYST MARKET BY END-USER (KILOTONS) 2020-2029
TABLE 167 MIDDLE EAST AND AFRICA GOLD CATALYST MARKET BY COUNTRY (USD BILLION) 2020-2029
TABLE 168 MIDDLE EAST AND AFRICA GOLD CATALYST MARKET BY COUNTRY (KILOTONS) 2020-2029
TABLE 169 MIDDLE EAST AND AFRICA GOLD CATALYST MARKET BY TYPE (USD BILLION) 2020-2029
TABLE 170 MIDDLE EAST AND AFRICA GOLD CATALYST MARKET BY TYPE (KILOTONS) 2020-2029
TABLE 171 MIDDLE EAST AND AFRICA GOLD CATALYST MARKET BY APPLICATION (USD BILLION) 2020-2029
TABLE 172 MIDDLE EAST AND AFRICA GOLD CATALYST MARKET BY APPLICATION (KILOTONS) 2020-2029
TABLE 173 MIDDLE EAST AND AFRICA GOLD CATALYST MARKET BY END-USER (USD BILLION) 2020-2029
TABLE 174 MIDDLE EAST AND AFRICA GOLD CATALYST MARKET BY END-USER (KILOTONS) 2020-2029
TABLE 175 UAE GOLD CATALYST MARKET BY TYPE (USD BILLION) 2020-2029
TABLE 176 UAE GOLD CATALYST MARKET BY TYPE (KILOTONS) 2020-2029
TABLE 177 UAE GOLD CATALYST MARKET BY APPLICATION (USD BILLION) 2020-2029
TABLE 178 UAE GOLD CATALYST MARKET BY APPLICATION (KILOTONS) 2020-2029
TABLE 179 UAE GOLD CATALYST MARKET BY END-USER (USD BILLION) 2020-2029
TABLE 180 UAE GOLD CATALYST MARKET BY END-USER (KILOTONS) 2020-2029
TABLE 181 SAUDI ARABIA GOLD CATALYST MARKET BY TYPE (USD BILLION) 2020-2029
TABLE 182 SAUDI ARABIA GOLD CATALYST MARKET BY TYPE (KILOTONS) 2020-2029
TABLE 183 SAUDI ARABIA GOLD CATALYST MARKET BY APPLICATION (USD BILLION) 2020-2029
TABLE 184 SAUDI ARABIA GOLD CATALYST MARKET BY APPLICATION (KILOTONS) 2020-2029
TABLE 185 SAUDI ARABIA GOLD CATALYST MARKET BY END-USER (USD BILLION) 2020-2029
TABLE 186 SAUDI ARABIA GOLD CATALYST MARKET BY END-USER (KILOTONS) 2020-2029
TABLE 187 SOUTH AFRICA GOLD CATALYST MARKET BY TYPE (USD BILLION) 2020-2029
TABLE 188 SOUTH AFRICA GOLD CATALYST MARKET BY TYPE (KILOTONS) 2020-2029
TABLE 189 SOUTH AFRICA GOLD CATALYST MARKET BY APPLICATION (USD BILLION) 2020-2029
TABLE 190 SOUTH AFRICA GOLD CATALYST MARKET BY APPLICATION (KILOTONS) 2020-2029
TABLE 191 SOUTH AFRICA GOLD CATALYST MARKET BY END-USER (USD BILLION) 2020-2029
TABLE 192 SOUTH AFRICA GOLD CATALYST MARKET BY END-USER (KILOTONS) 2020-2029
TABLE 193 REST OF MIDDLE EAST AND AFRICA GOLD CATALYST MARKET BY TYPE (USD BILLION) 2020-2029
TABLE 194 REST OF MIDDLE EAST AND AFRICA GOLD CATALYST MARKET BY TYPE (KILOTONS) 2020-2029
TABLE 195 REST OF MIDDLE EAST AND AFRICA GOLD CATALYST MARKET BY APPLICATION (USD BILLION) 2020-2029
TABLE 196 REST OF MIDDLE EAST AND AFRICA GOLD CATALYST MARKET BY APPLICATION (KILOTONS) 2020-2029
TABLE 197 REST OF MIDDLE EAST AND AFRICA GOLD CATALYST MARKET BY END-USER (USD BILLION) 2020-2029
TABLE 198 REST OF MIDDLE EAST AND AFRICA GOLD CATALYST MARKET BY END-USER (KILOTONS) 2020-2029
LIST OF FIGURES
FIGURE 1 MARKET DYNAMICS
FIGURE 2 MARKET SEGMENTATION
FIGURE 3 REPORT TIMELINES: YEARS CONSIDERED
FIGURE 4 DATA TRIANGULATION
FIGURE 5 BOTTOM-UP APPROACH
FIGURE 6 TOP-DOWN APPROACH
FIGURE 7 RESEARCH FLOW
FIGURE 8 GLOBAL GOLD CATALYST MARKET BY TYPE (USD BILLION) 2020-2029
FIGURE 9 GLOBAL GOLD CATALYST MARKET BY APPLICATION (USD BILLION) 2020-2029
FIGURE 10 GLOBAL GOLD CATALYST MARKET BY END-USER (USD BILLION) 2020-2029
FIGURE 11 GLOBAL GOLD CATALYST MARKET BY REGION (USD BILLION) 2020-2029
FIGURE 12 PORTER’S FIVE FORCES MODEL
FIGURE 13 GLOBAL GOLD CATALYST MARKET BY TYPE (USD BILLION) 2021
FIGURE 14 GLOBAL GOLD CATALYST MARKET BY APPLICATION (USD BILLION) 2021
FIGURE 15 GLOBAL GOLD CATALYST MARKET BY END-USER (USD BILLION) 2021
FIGURE 16 GLOBAL GOLD CATALYST MARKET BY REGION (USD BILLION) 2021
FIGURE 17 MARKET SHARE ANALYSIS
FIGURE 18 BASF: COMPANY SNAPSHOT
FIGURE 19 EVONIK INDUSTRIES AG: COMPANY SNAPSHOT
FIGURE 20 JOHNSON MATTHEY PLC.: COMPANY SNAPSHOT
FIGURE 21 HERAEUS GROUP: COMPANY SNAPSHOT
FIGURE 22 CLARIANT INTERNATIONAL LTD.: COMPANY SNAPSHOT
FIGURE 23 UMICORE: COMPANY SNAPSHOT
FIGURE 24 ALFA AESAR: COMPANY SNAPSHOT
FIGURE 25 CHIMET S.P.A: COMPANY SNAPSHOT
FIGURE 26 AMERICAN ELEMENTS: COMPANY SNAPSHOT
FIGURE 27 VINEETH PRECIOUS CATALYSTS PVT. LTD: COMPANY SNAPSHOT
DOWNLOAD FREE SAMPLE REPORT
License Type
SPEAK WITH OUR ANALYST
Want to know more about the report or any specific requirement?
WANT TO CUSTOMIZE THE REPORT?
Our Clients Speak
We asked them to research ‘ Equipment market’ all over the world, and their whole arrangement was helpful to us. thehealthanalytics.com insightful analysis and reports contributed to our current analysis and in creating a future strategy. Besides, the te
Yosuke Mitsui
Senior Associate Construction Equipment Sales & Marketing
We asked them to research ‘Equipment market’ all over the world, and their whole arrangement was helpful to us. thehealthanalytics.com insightful analysis and reports contributed to our current analysis and in creating a future strategy. Besides, the te


