

Base Year Value ()
x.x %
x.x %
CAGR ()
x.x %
x.x %
Forecast Year Value ()
x.x %
x.x %
Historical Data Period
Largest Region
Forecast Period
Mercado de edificios inteligentes por componente (solución, servicios), tipo de edificio (residencial, comercial, industrial) y región (América del Norte, Asia Pacífico, Europa, América Latina, Oriente Medio y África). Tendencias globales y pronóstico de 2022 a 2029.
Instant access to hundreds of data points and trends
- Market estimates from 2014-2029
- Competitive analysis, industry segmentation, financial benchmarks
- Incorporates SWOT, Porter's Five Forces and risk management frameworks
- PDF report or online database with Word, Excel and PowerPoint export options
- 100% money back guarantee
Descripción general del mercado de edificios inteligentes
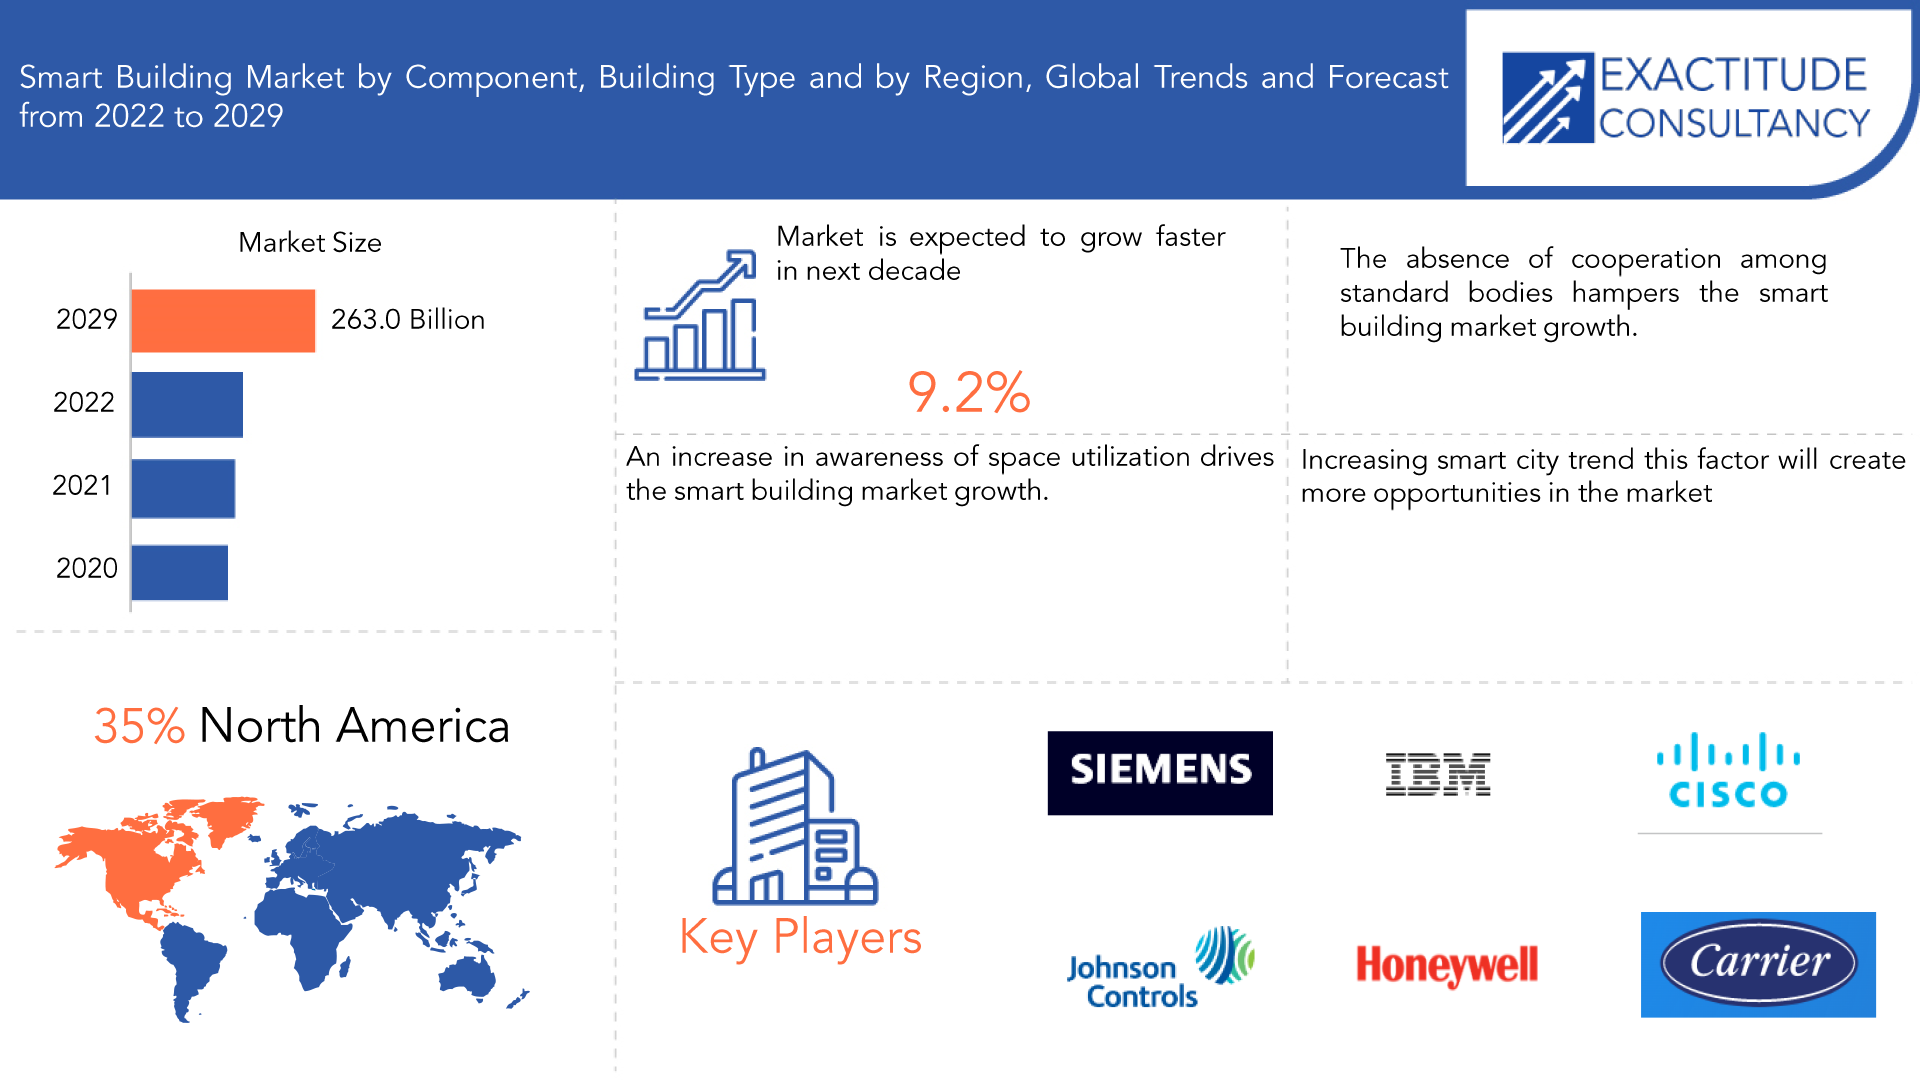
Se espera que el mercado global de edificios inteligentes crezca a una tasa de crecimiento anual compuesta del 9,2 % entre 2020 y 2029. Se espera que alcance más de 263 000 millones de dólares en 2029, frente a los 65 700 millones de dólares de 2020.
Un edificio inteligente es un edificio que incorpora tecnologías avanzadas y sistemas de automatización para que sea más eficiente, cómodo y seguro para sus ocupantes. Los edificios inteligentes utilizan sensores, análisis de datos y redes de comunicación para supervisar y controlar varios sistemas del edificio, como la iluminación, la calefacción, la ventilación, el aire acondicionado, la seguridad y la gestión de la energía. Los edificios inteligentes utilizan sensores y análisis para optimizar el uso de la energía y reducir el desperdicio. Por ejemplo, pueden ajustar la iluminación y la temperatura en función de los niveles de ocupación, la hora del día y las condiciones meteorológicas. Los edificios inteligentes utilizan sistemas de automatización para controlar y supervisar varios sistemas del edificio, como la iluminación, la calefacción, la ventilación y el aire acondicionado y la seguridad. Esto puede ayudar a reducir la intervención manual y mejorar la eficiencia. Los edificios inteligentes están conectados a Internet, lo que permite la supervisión en tiempo real y el control remoto de los sistemas del edificio. Esto también puede permitir una mejor recopilación y análisis de datos. Los edificios inteligentes suelen incorporar principios y tecnologías de diseño sostenibles, como techos verdes, paneles solares y sistemas de recolección de agua de lluvia. Los edificios inteligentes utilizan tecnologías avanzadas para crear un entorno más cómodo y productivo para los ocupantes. Por ejemplo, pueden ajustar la iluminación y la temperatura en función de las preferencias individuales y proporcionar información en tiempo real sobre la calidad del aire interior. En general, los edificios inteligentes están diseñados para mejorar la eficiencia, la sostenibilidad y la comodidad de los edificios, al tiempo que reducen los costos operativos y mejoran el rendimiento general del edificio. Las casas inteligentes se construyen para aumentar la comodidad y la seguridad de los residentes, permitir la gestión remota de muchos equipos del hogar, las rutinas de mantenimiento automatizadas del hogar, el seguimiento del consumo de energía y la gestión de los sistemas de seguridad del hogar. La rápida adopción de edificios inteligentes está siendo impulsada por la creciente demanda de una mejor utilización de los edificios (y de las instalaciones de los edificios), así como una mejor gestión de los recursos en las áreas metropolitanas. Además, el deseo de seguridad pública está impulsando el crecimiento del mercado de edificios inteligentes.
| ATRIBUTO | DETALLES |
| Periodo de estudio | 2020-2029 |
| Año base | 2021 |
| Año estimado | 2022 |
| Año pronosticado | 2022-2029 |
| Periodo histórico | 2018-2020 |
| Unidad | Valor (miles de millones de USD) |
| Segmentación | Por componente, por tipo de edificio, por región |
| Por componente |
|
| Por tipo de edificio |
|
| Por región |
|
Los edificios inteligentes utilizan tecnologías avanzadas para optimizar el consumo de energía, reducir el desperdicio y ahorrar costos en servicios públicos. Esto es particularmente atractivo para los propietarios de edificios y administradores de instalaciones que siempre están buscando formas de reducir los costos operativos. Los edificios inteligentes están diseñados para reducir su impacto ambiental a través de características como fuentes de energía renovables, iluminación de bajo consumo y sistemas avanzados de calefacción, ventilación y aire acondicionado ( HVAC ). Esta es una consideración importante para muchos propietarios de edificios que desean promover la sostenibilidad y reducir su huella de carbono. Los edificios inteligentes brindan mayor comodidad y conveniencia a los ocupantes. Pueden ajustar automáticamente la temperatura, la iluminación y otras características según las preferencias del usuario, los patrones de ocupación y otros factores. Esto mejora la experiencia del usuario y puede mejorar la productividad y la satisfacción. Muchos gobiernos están introduciendo regulaciones para reducir las emisiones de carbono y promover el desarrollo sostenible. Los edificios inteligentes ayudan a los propietarios de edificios y administradores de instalaciones a cumplir con estas regulaciones y evitar sanciones. El desarrollo de nuevas tecnologías como Internet de las cosas ( IoT ), inteligencia artificial (IA) y computación en la nube han permitido la creación de sistemas de edificios inteligentes que son más eficientes, rentables y fáciles de usar que nunca. Esto ha provocado un aumento de la demanda de soluciones para edificios inteligentes. Estos son los factores que ayudan a impulsar el crecimiento del mercado de los edificios inteligentes. [caption id="attachment_21756" align="aligncenter" width="1920"]
Frequently Asked Questions
• What is the worth of global Smart Building market?
The global smart building market is expected to grow at 9.2 % CAGR from 2020 to 2029. It is expected to reach above USD 263.0 billion by 2029 from USD 65.7 billion in 2020.
• What is the size of the North America Smart Building Market?
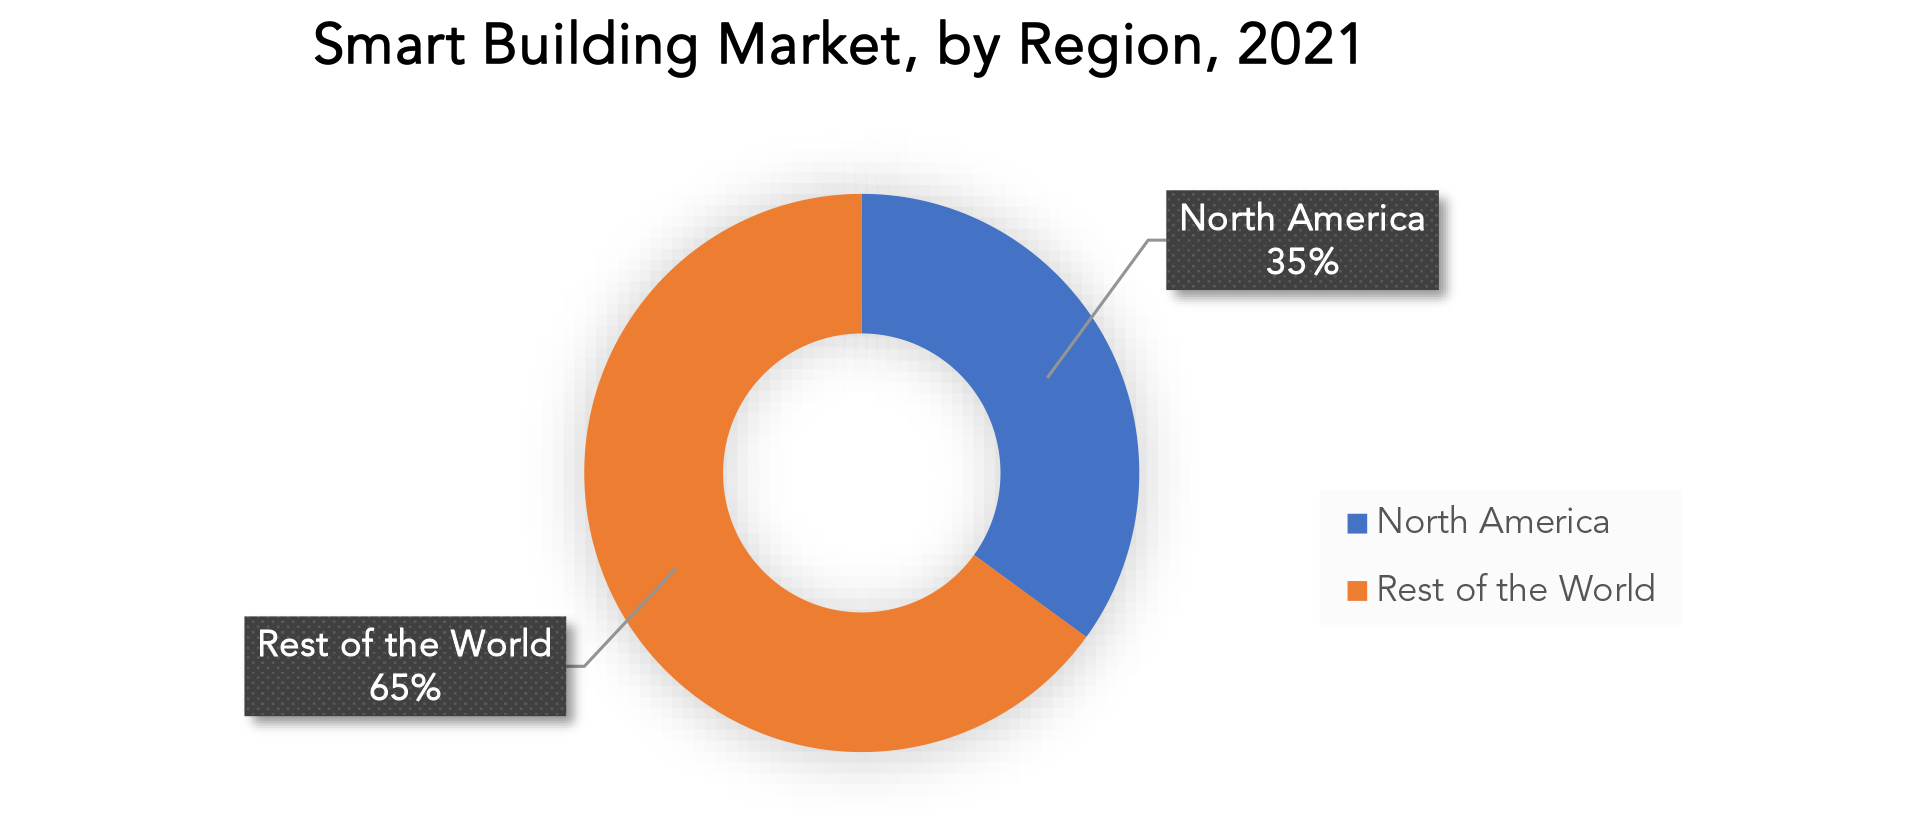
North America held more than 35% of the Smart Building market revenue share in 2021. North America has been at the forefront of technological advancements in the smart building industry. The region is home to many leading technology companies, which have developed advanced smart building solutions based on the Internet of Things (IoT), artificial intelligence (AI), and cloud computing.
• What are some of the market's driving forces?
Increase in adoption of IoT-enabled BMS, growing in awareness of space utilization, growth in industry standards and regulations drives the smart building market growth.
• Which are the top companies to hold the market share in Smart Building market?
The Smart Building market key players include Cisco, IBM, Honeywell, Siemens, Johnson Controls, Huawei, Intel, PTC, Abb, 10 Hitachi, Schneider Electric, Telit, Legrand, Bosch, KMC Controls, Verdigris Technologies, Aquicore, 75f, Buildingiq, Entouch, Gaia, Softdel, Coppertree Analytics, Spaceti, Igor, Efacility, Spacewell.
• What are the opportunities in the smart building market?
Development of the 5G technology, increase in the smart city trend, Government initiatives and incentives this factor creates more opportunities in the smart building market.
Smart Building Market Segment Analysis
The global Smart Building market is segmented based on component building type and region. By component, the services segment is dominating the market. Smart building systems involve complex technologies such as IoT, AI, and cloud computing. Building owners and facility managers may lack the expertise required to design, install, and maintain these systems. Service providers with specialized knowledge and experience are therefore needed to help them implement and manage smart building solutions. Smart building solutions must be customized to meet the specific needs of each building and its occupants. Service providers can offer tailor-made solutions based on factors such as building size, occupancy patterns, and energy usage. This ensures that the smart building system is optimized for maximum efficiency and cost savings. Smart building systems require ongoing maintenance and support to ensure optimal performance. Service providers can offer regular maintenance, upgrades, and troubleshooting services to ensure that the system runs smoothly and any issues are quickly resolved. Service providers can offer a range of services such as consulting, design, installation, and maintenance, which can generate recurring revenue streams. This business model is attractive to investors and can provide a steady stream of income over the life of the smart building system. Building owners and facility managers are looking for competitive advantages in terms of energy efficiency, sustainability, and user experience. Smart building systems can provide these advantages, and service providers are well-positioned to offer the expertise and support required to implement them. Based on building type commercial building segment is dominating in the smart building market. Commercial buildings consume a significant amount of energy, and building owners and facility managers are looking for ways to reduce energy usage and lower operating costs. Smart building solutions can optimize energy usage by automatically adjusting lighting, heating, ventilation, and air conditioning based on occupancy patterns and user preferences. Many commercial building owners and facility managers are committed to reducing their environmental impact and promoting sustainability. Smart building solutions can help achieve these goals by incorporating renewable energy sources, improving indoor air quality, and reducing carbon emissions. Smart building solutions can help reduce operational costs by optimizing energy usage, automating processes, and reducing maintenance costs. This is particularly attractive to commercial building owners and facility managers who are looking for ways to maximize profitability. Commercial buildings are designed to attract and retain tenants, and smart building solutions can enhance the user experience by providing features such as automated lighting, temperature control, and security systems. Many governments are introducing regulations to reduce carbon emissions and promote sustainable development. Smart building solutions can help building owners and facility managers comply with these regulations and avoid penalties. [caption id="attachment_21760" align="aligncenter" width="1920"]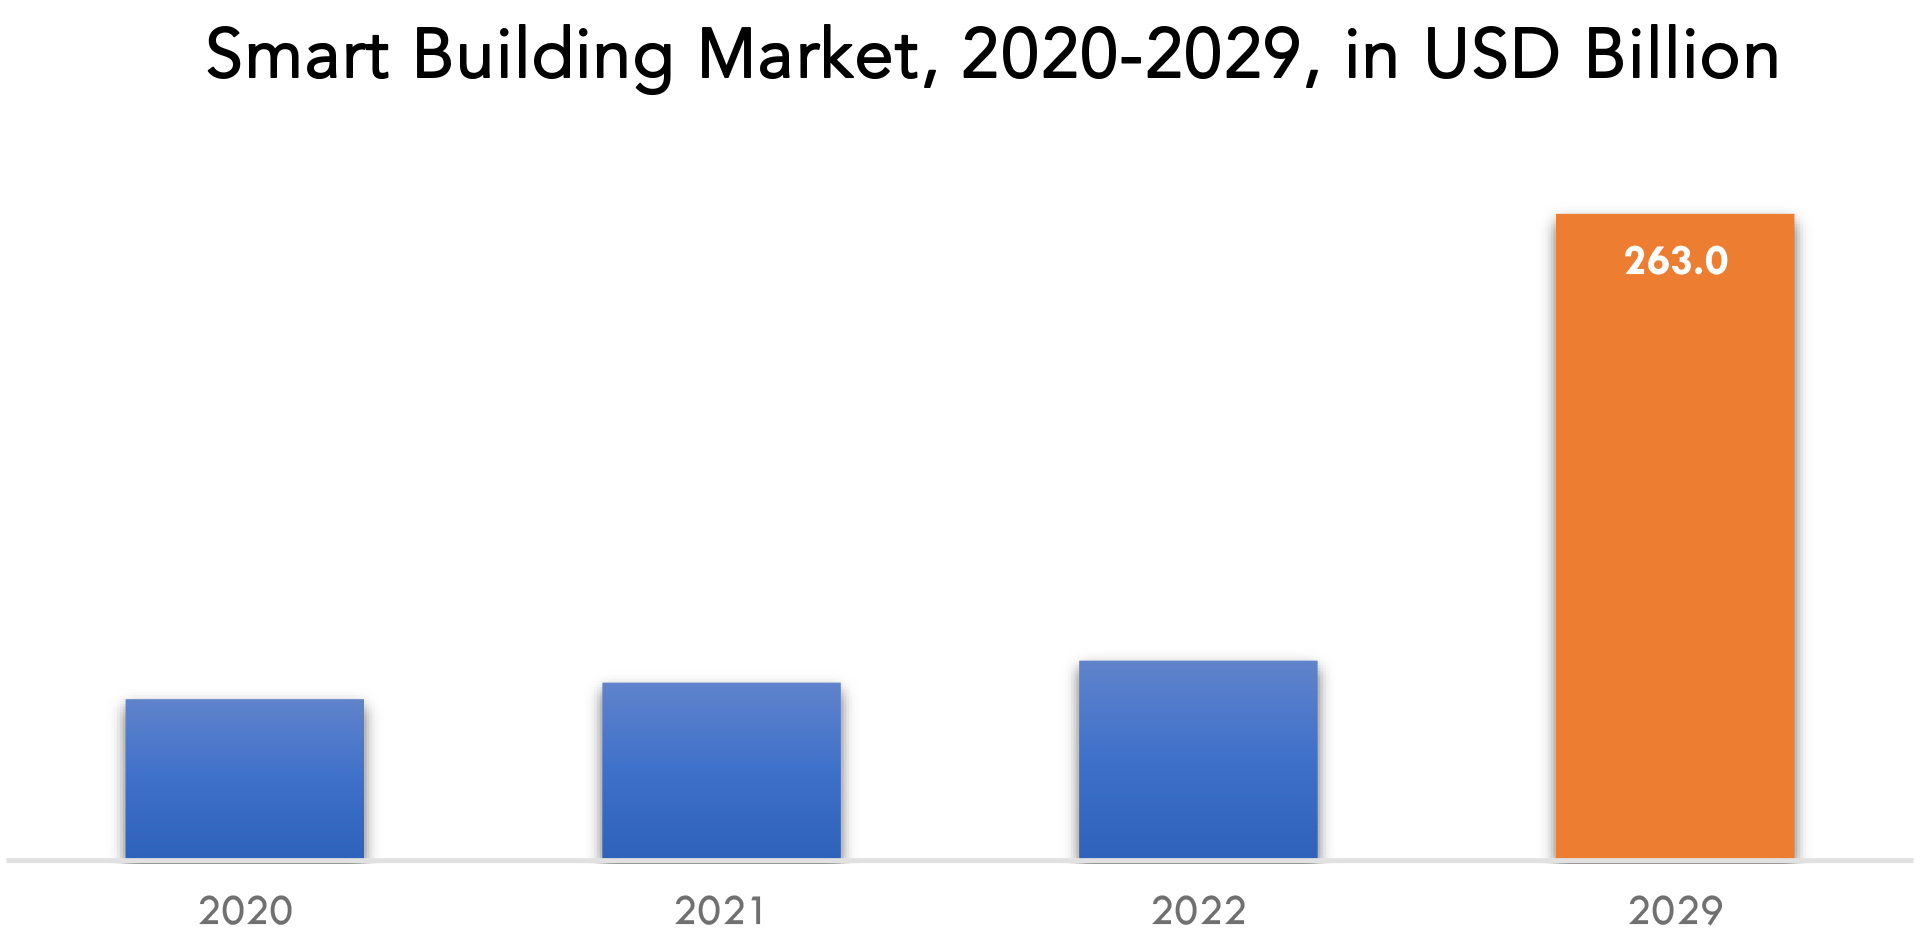
Smart Building Market Key Players
The Smart Building market key players include Cisco, IBM, Honeywell, Siemens, Johnson Controls, Huawei, Intel, PTC, Abb, 10 Hitachi, Schneider Electric, Telit, Legrand, Bosch, KMC Controls, Verdigris Technologies, Aquicore, 75f, Buildingiq, Entouch, Gaia, Softdel, Coppertree Analytics, Spaceti, Igor, Efacility, Spacewell. Industry News: 11th August 2022 - Johnson Controls and Microsoft Beijing Campus worked together to continuously renovate the building and optimize operations in August 2022, resulting in energy savings of 27.9% and a 98% uptime guarantee for essential equipment. In February 2022, Legrand and URC, a reputable provider of smart home automation and control systems, joined partners to expand Smart Home Control. Through this arrangement, the companies work together to provide seamless control of Legrand's Vantage lighting and temperature solutions.Who Should Buy? Or Key stakeholders
- Smart Building Supplier
- Raw Materials Manufacturers
- Research Organizations
- Investors
- Regulatory Authorities
- Others
Smart Building Market Regional Analysis
The smart building market by region includes North America, Asia-Pacific (APAC), Europe, South America, and Middle East & Africa (MEA).- North America: includes the US, Canada, Mexico
- Asia Pacific: includes China, Japan, South Korea, India, Australia, ASEAN and Rest of APAC
- Europe: includes UK, Germany, France, Italy, Spain, Russia, and Rest of Europe
- South America: includes Brazil, Argentina and Rest of South America
- Middle East & Africa: includes Turkey, UAE, Saudi Arabia, South Africa, and Rest of MEA
Key Market Segments: Smart Building Market
Smart Building Market by Component, 2020-2029, (USD Billion)- Solution
- Services
- Residential
- Commercial
- Industrial
- North America
- Asia Pacific
- Europe
- South America
- Middle East and Africa
Key Question Answered
- What is the current size of the smart building positioning market?
- What is the expected growth rate of the smart building positioning market over the next 5 years?
- Who are the major players in the automotive high precision positioning market and what is their market share?
- What are the end-user industries driving demand for the market and what is their outlook?
- What are the opportunities for growth in emerging markets such as the Asia-pacific, the middle east, and Africa?
- How is the economic environment affecting the automotive high precision positioning market, including factors such as interest rates, inflation, and exchange rates?
- What is the expected impact of government policies and regulations on the smart building positioning market?
- What is the current and forecasted size and growth rate of the global smart building positioning market?
- What are the key drivers of growth in the smart building positioning market?
- Who are the major players in the market and what is their market share?
- What are the distribution channels and supply chain dynamics in the smart building positioning market?
- What are the technological advancements and innovations in the smart building positioning market and their impact on product development and growth?
- What are the regulatory considerations and their impact on the market?
- What are the challenges faced by players in the smart building positioning market and how are they addressing these challenges?
- What are the opportunities for growth and expansion in the smart building positioning market?
- What are the service offerings specifications of leading players in the market?
- What is the pricing trend of smart building positioning in the market?
- INTRODUCCIÓN
- DEFINICIÓN DE MERCADO
- SEGMENTACIÓN DEL MERCADO
- CRONOGRAMAS DE INVESTIGACIÓN
- SUPUESTOS Y LIMITACIONES
- METODOLOGÍA DE LA INVESTIGACIÓN
- MINERÍA DE DATOS
- INVESTIGACIÓN SECUNDARIA
- INVESTIGACIÓN PRIMARIA
- ASESORAMIENTO DE EXPERTOS EN LA MATERIA
- CONTROLES DE CALIDAD
- REVISIÓN FINAL
- TRIANGULACIÓN DE DATOS
- ENFOQUE DE ABAJO HACIA ARRIBA
- ENFOQUE DE ARRIBA HACIA ABAJO
- FLUJO DE INVESTIGACIÓN
- FUENTES DE DATOS
- MINERÍA DE DATOS
- RESUMEN EJECUTIVO
- PANORAMA DEL MERCADO
- PERSPECTIVAS DEL MERCADO MUNDIAL DE EDIFICIOS INTELIGENTES
- IMPULSORES DEL MERCADO
- RESTRICCIONES DEL MERCADO
- OPORTUNIDADES DE MERCADO
- IMPACTO DEL COVID-19 EN EL MERCADO DE EDIFICIOS INTELIGENTES
- MODELO DE LAS CINCO FUERZAS DE PORTER
- AMENAZA DE NUEVOS INGRESANTES
- AMENAZA DE SUSTITUTOS
- PODER DE NEGOCIACIÓN DE LOS PROVEEDORES
- PODER DE NEGOCIACIÓN DE LOS CLIENTES
- GRADO DE COMPETENCIA
- ANÁLISIS DE LA CADENA DE VALOR DE LA INDUSTRIA
- PERSPECTIVAS DEL MERCADO MUNDIAL DE EDIFICIOS INTELIGENTES
- MERCADO GLOBAL DE EDIFICIOS INTELIGENTES POR COMPONENTE, 2020-2029 (MIL MILLONES DE USD)
- SOLUCIÓN
- SERVICIOS
- MERCADO GLOBAL DE EDIFICIOS INTELIGENTES POR TIPO DE EDIFICIO, 2020-2029 (MIL MILLONES DE USD)
- RESIDENCIAL
- COMERCIAL
- INDUSTRIAL
- MERCADO GLOBAL DE EDIFICIOS INTELIGENTES POR REGIÓN, 2020-2029 (MIL MILLONES DE USD)
- AMÉRICA DEL NORTE
- A NOSOTROS
- CANADÁ
- MÉXICO
- SUDAMERICA
- BRASIL
- ARGENTINA
- COLOMBIA
- RESTO DE SUDAMÉRICA
- EUROPA
- ALEMANIA
- Reino Unido
- FRANCIA
- ITALIA
- ESPAÑA
- RUSIA
- RESTO DE EUROPA
- ASIA PACÍFICO
- INDIA
- CHINA
- JAPAN
- SOUTH KOREA
- AUSTRALIA
- SOUTH-EAST ASIA
- REST OF ASIA PACIFIC
- MIDDLE EAST AND AFRICA
- UAE
- SAUDI ARABIA
- SOUTH AFRICA
- REST OF MIDDLE EAST AND AFRICA
- AMÉRICA DEL NORTE
- COMPANY PROFILES*
(BUSINESS OVERVIEW, COMPANY SNAPSHOT, PRODUCTS OFFERED, RECENT DEVELOPMENTS)
8.1. CISCO
8.2. IBM
8.3. HONEYWELL
8.4. SIEMENS
8.5. JOHNSON CONTROLS
8.6. HUAWEI
8.7. INTEL
8.8. PTC
8.9. ABB
8.10. HITACHI
LIST OF TABLES
TABLE 1 GLOBAL SMART BUILDING MARKET BY TYPE (USD BILLION) 2020-2029
TABLE 2 GLOBAL SMART BUILDING MARKET BY COMPONENT (USD BILLION) 2020-2029
TABLE 3 GLOBAL SMART BUILDING MARKET BY BUILDING TYPE (USD BILLION) 2020-2029
TABLE 4 GLOBAL SMART BUILDING MARKET BY REGION (USD BILLION) 2020-2029
TABLE 5 NORTH AMERICA SMART BUILDING MARKET BY COUNTRY (USD BILLION) 2020-2029
TABLE 6 NORTH AMERICA SMART BUILDING MARKET BY COMPONENT (USD BILLION) 2020-2029
TABLE 7 NORTH AMERICA SMART BUILDING MARKET BY BUILDING TYPE (USD BILLION) 2020-2029
TABLE 8 US SMART BUILDING MARKET BY COMPONENT (USD BILLION) 2020-2029
TABLE 9 US SMART BUILDING MARKET BY BUILDING TYPE (USD BILLION) 2020-2029
TABLE 10 CANADA SMART BUILDING MARKET BY COMPONENT (USD BILLION) 2020-2029
TABLE 11 CANADA SMART BUILDING MARKET BY BUILDING TYPE (USD BILLION) 2020-2029
TABLE 12 MEXICO SMART BUILDING MARKET BY COMPONENT (USD BILLION) 2020-2029
TABLE 13 MEXICO SMART BUILDING MARKET BY BUILDING TYPE (USD BILLION) 2020-2029
TABLE 14 SOUTH AMERICA SMART BUILDING MARKET BY COUNTRY (USD BILLION) 2020-2029
TABLE 15 SOUTH AMERICA SMART BUILDING MARKET BY COMPONENT (USD BILLION) 2020-2029
TABLE 16 SOUTH AMERICA SMART BUILDING MARKET BY BUILDING TYPE (USD BILLION) 2020-2029
TABLE 17 BRAZIL SMART BUILDING MARKET BY COMPONENT (USD BILLION) 2020-2029
TABLE 18 BRAZIL SMART BUILDING MARKET BY BUILDING TYPE (USD BILLION) 2020-2029
TABLE 19 ARGENTINA SMART BUILDING MARKET BY COMPONENT (USD BILLION) 2020-2029
TABLE 20 ARGENTINA SMART BUILDING MARKET BY BUILDING TYPE (USD BILLION) 2020-2029
TABLE 21 COLOMBIA SMART BUILDING MARKET BY COMPONENT (USD BILLION) 2020-2029
TABLE 22 COLOMBIA SMART BUILDING MARKET BY BUILDING TYPE (USD BILLION) 2020-2029
TABLE 23 REST OF THE SOUTH AMERICA SMART BUILDING MARKET BY COMPONENT (USD BILLION) 2020-2029
TABLE 24 REST OF THE SOUTH AMERICA SMART BUILDING MARKET BY BUILDING TYPE (USD BILLION) 2020-2029
TABLE 25 ASIA-PACIFIC SMART BUILDING MARKET BY COUNTRY (USD BILLION) 2020-2029
TABLE 26 ASIA-PACIFIC SMART BUILDING MARKET BY COMPONENT (USD BILLION) 2020-2029
TABLE 27 ASIA-PACIFIC SMART BUILDING MARKET BY BUILDING TYPE (USD BILLION) 2020-2029
TABLE 28 INDIA SMART BUILDING MARKET BY COMPONENT (USD BILLION) 2020-2029
TABLE 29 INDIA SMART BUILDING MARKET BY BUILDING TYPE (USD BILLION) 2020-2029
TABLE 30 CHINA SMART BUILDING MARKET BY COMPONENT (USD BILLION) 2020-2029
TABLE 31 CHINA SMART BUILDING MARKET BY BUILDING TYPE (USD BILLION) 2020-2029
TABLE 32 JAPAN SMART BUILDING MARKET BY COMPONENT (USD BILLION) 2020-2029
TABLE 33 JAPAN SMART BUILDING MARKET BY BUILDING TYPE (USD BILLION) 2020-2029
TABLE 34 SOUTH KOREA SMART BUILDING MARKET BY COMPONENT (USD BILLION) 2020-2029
TABLE 35 SOUTH KOREA SMART BUILDING MARKET BY BUILDING TYPE (USD BILLION) 2020-2029
TABLE 36 AUSTRALIA SMART BUILDING MARKET BY COMPONENT (USD BILLION) 2020-2029
TABLE 37 AUSTRALIA SMART BUILDING MARKET BY BUILDING TYPE (USD BILLION) 2020-2029
TABLE 38 SOUTH-EAST ASIA SMART BUILDING MARKET BY COMPONENT (USD BILLION) 2020-2029
TABLE 39 SOUTH-EAST ASIA SMART BUILDING MARKET BY BUILDING TYPE (USD BILLION) 2020-2029
TABLE 40 REST OF ASIA PACIFIC SMART BUILDING MARKET BY COMPONENT (USD BILLION) 2020-2029
TABLE 41 REST OF ASIA PACIFIC SMART BUILDING MARKET BY BUILDING TYPE (USD BILLION) 2020-2029
TABLE 42 EUROPE SMART BUILDING MARKET BY COUNTRY (USD BILLION) 2020-2029
TABLE 43 EUROPE SMART BUILDING MARKET BY COMPONENT (USD BILLION) 2020-2029
TABLE 44 EUROPE SMART BUILDING MARKET BY BUILDING TYPE (USD BILLION) 2020-2029
TABLE 45 GERMANY SMART BUILDING MARKET BY COMPONENT (USD BILLION) 2020-2029
TABLE 46 GERMANY SMART BUILDING MARKET BY BUILDING TYPE (USD BILLION) 2020-2029
TABLE 47 UK SMART BUILDING MARKET BY COMPONENT (USD BILLION) 2020-2029
TABLE 48 UK SMART BUILDING MARKET BY BUILDING TYPE (USD BILLION) 2020-2029
TABLE 49 FRANCE SMART BUILDING MARKET BY COMPONENT (USD BILLION) 2020-2029
TABLE 50 FRANCE SMART BUILDING MARKET BY BUILDING TYPE (USD BILLION) 2020-2029
TABLE 51 ITALY SMART BUILDING MARKET BY COMPONENT (USD BILLION) 2020-2029
TABLE 52 ITALY SMART BUILDING MARKET BY BUILDING TYPE (USD BILLION) 2020-2029
TABLE 53 SPAIN SMART BUILDING MARKET BY COMPONENT (USD BILLION) 2020-2029
TABLE 54 SPAIN SMART BUILDING MARKET BY BUILDING TYPE (USD BILLION) 2020-2029
TABLE 55 RUSSIA SMART BUILDING MARKET BY COMPONENT (USD BILLION) 2020-2029
TABLE 56 RUSSIA SMART BUILDING MARKET BY BUILDING TYPE (USD BILLION) 2020-2029
TABLE 57 REST OF EUROPE SMART BUILDING MARKET BY COMPONENT (USD BILLION) 2020-2029
TABLE 58 REST OF EUROPE SMART BUILDING MARKET BY BUILDING TYPE (USD BILLION) 2020-2029
TABLE 59 MIDDLE EAST AND AFRICA SMART BUILDING MARKET BY COUNTRY (USD BILLION) 2020-2029
TABLE 60 MIDDLE EAST AND AFRICA SMART BUILDING MARKET BY COMPONENT (USD BILLION) 2020-2029
TABLE 61 MIDDLE EAST AND AFRICA SMART BUILDING MARKET BY BUILDING TYPE (USD BILLION) 2020-2029
TABLE 62 UAE SMART BUILDING MARKET BY COMPONENT (USD BILLION) 2020-2029
TABLE 63 UAE SMART BUILDING MARKET BY BUILDING TYPE (USD BILLION) 2020-2029
TABLE 64 SAUDI ARABIA SMART BUILDING MARKET BY COMPONENT (USD BILLION) 2020-2029
TABLE 65 SAUDI ARABIA SMART BUILDING MARKET BY BUILDING TYPE (USD BILLION) 2020-2029
TABLE 66 SOUTH AFRICA SMART BUILDING MARKET BY COMPONENT (USD BILLION) 2020-2029
TABLE 67 SOUTH AFRICA SMART BUILDING MARKET BY BUILDING TYPE (USD BILLION) 2020-2029
TABLE 68 REST OF THE MIDDLE EAST AND AFRICA SMART BUILDING MARKET BY COMPONENT (USD BILLION) 2020-2029
TABLE 69 REST OF THE MIDDLE EAST AND AFRICA SMART BUILDING MARKET BY BUILDING TYPE (USD BILLION) 2020-2029
LIST OF FIGURES
FIGURE 1 MARKET DYNAMICS
FIGURE 2 MARKET SEGMENTATION
FIGURE 3 REPORT TIMELINES: YEARS CONSIDERED
FIGURE 4 DATA TRIANGULATION
FIGURE 5 BOTTOM-UP APPROACH
FIGURE 6 TOP-DOWN APPROACH
FIGURE 7 RESEARCH FLOW
FIGURE 8 GLOBAL SMART BUILDING MARKET BY COMPONENT, USD BILLION, 2020-2029
FIGURE 9 GLOBAL SMART BUILDING MARKET BY BUILDING TYPE, USD BILLION, 2020-2029
FIGURE 10 GLOBAL SMART BUILDING MARKET BY REGION, USD BILLION, 2020-2029
FIGURE 11 PORTER’S FIVE FORCES MODEL
FIGURE 12 GLOBAL SMART BUILDING MARKET BY COMPONENT, USD BILLION, 20201
FIGURE 13 GLOBAL SMART BUILDING MARKET BY BUILDING TYPE, USD BILLION, 2021
FIGURE 14 GLOBAL SMART BUILDING MARKET BY REGION, USD BILLION, 2021
FIGURE 15 NORTH AMERICA SMART BUILDING MARKET SNAPSHOT
FIGURE 16 EUROPE SMART BUILDING MARKET SNAPSHOT
FIGURE 17 SOUTH AMERICA SMART BUILDING MARKET SNAPSHOT
FIGURE 18 ASIA PACIFIC SMART BUILDING MARKET SNAPSHOT
FIGURE 19 MIDDLE EAST ASIA AND AFRICA SMART BUILDING MARKET SNAPSHOT
FIGURE 20 MARKET SHARE ANALYSIS
FIGURE 21 CARRIER: COMPANY SNAPSHOT
FIGURE 22 CISCO: COMPANY SNAPSHOT
FIGURE 23 IBM: COMPANY SNAPSHOT
FIGURE 24 HONEYWELL: COMPANY SNAPSHOT
FIGURE 25 SIEMENS: COMPANY SNAPSHOT
FIGURE 26 JOHNSON CONTROLS: COMPANY SNAPSHOT
FIGURE 27 HUAWEI: COMPANY SNAPSHOT
FIGURE 28 INTEL: COMPANY SNAPSHOT
FIGURE 29 PTC: COMPANY SNAPSHOT
FIGURE 30 ABB: COMPANY SNAPSHOT
DOWNLOAD FREE SAMPLE REPORT
License Type
SPEAK WITH OUR ANALYST
Want to know more about the report or any specific requirement?
WANT TO CUSTOMIZE THE REPORT?
Our Clients Speak
We asked them to research ‘ Equipment market’ all over the world, and their whole arrangement was helpful to us. thehealthanalytics.com insightful analysis and reports contributed to our current analysis and in creating a future strategy. Besides, the te
Yosuke Mitsui
Senior Associate Construction Equipment Sales & Marketing
We asked them to research ‘Equipment market’ all over the world, and their whole arrangement was helpful to us. thehealthanalytics.com insightful analysis and reports contributed to our current analysis and in creating a future strategy. Besides, the te


