

Base Year Value ()
x.x %
x.x %
CAGR ()
x.x %
x.x %
Forecast Year Value ()
x.x %
x.x %
Historical Data Period
Largest Region
Forecast Period
Informe de análisis de tamaño, participación y tendencias del mercado de kombucha por tipo (bacterias, levaduras, mohos, otros), sabor (hierbas y especias, cítricos, bayas, manzana, coco y mangos, flores, otros), canal de distribución (supermercados/hipermercados, tiendas especializadas, tiendas de conveniencia, minoristas en línea, otro canal de distribución) y región (América del Norte, Europa, Asia Pacífico, América del Sur, Oriente Medio y África). Tendencias globales y pronóstico de 2022 a 2029
Instant access to hundreds of data points and trends
- Market estimates from 2014-2029
- Competitive analysis, industry segmentation, financial benchmarks
- Incorporates SWOT, Porter's Five Forces and risk management frameworks
- PDF report or online database with Word, Excel and PowerPoint export options
- 100% money back guarantee
Descripción general del mercado de kombucha
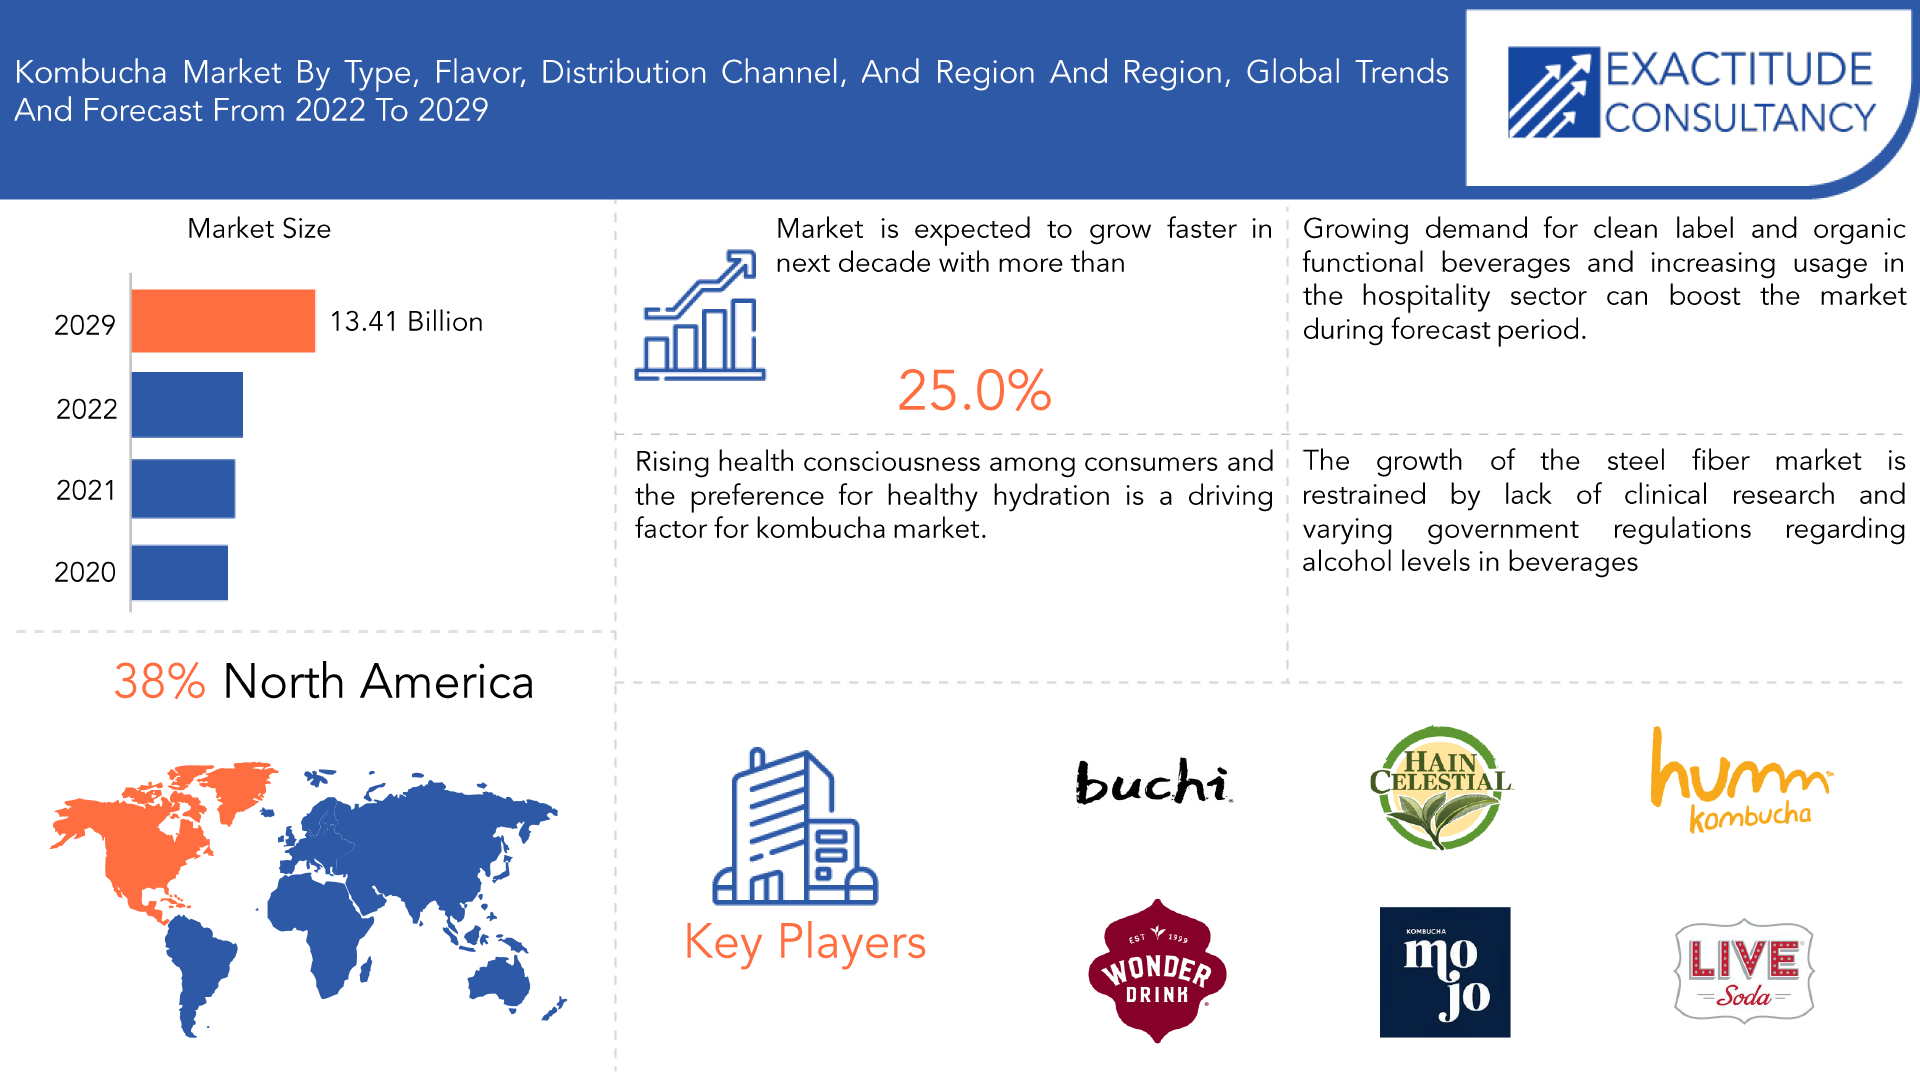
Se estima que el tamaño del mercado mundial de kombucha alcanzará un valor de USD 13,41 mil millones para 2029 y se espera que crezca a una tasa de crecimiento anual compuesta (CAGR) del 25 % durante el período de pronóstico.
El kombucha es una bebida de té fermentada que se elabora añadiendo un cultivo simbiótico de bacterias y levaduras (SCOBY) al té endulzado. Durante la fermentación, el SCOBY consume el azúcar del té y produce diversos ácidos orgánicos, vitaminas y enzimas, que le dan a la bebida su característico sabor ácido y sus posibles beneficios para la salud. El kombucha se suele consumir como una bebida rica en probióticos y está disponible en una variedad de sabores. Una bebida fermentada llamada té de kombucha se prepara con té, azúcar, levadura y bacterias. Para producir la bebida , primero debe desarrollarse un cultivo de bacterias y levaduras . Tanto al té como al azúcar se les añadió el cultivo. Luego, se le da tiempo a la mezcla para que fermente.
| ATRIBUTO | DETALLES |
| Periodo de estudio | 2020-2029 |
| Año base | 2021 |
| Año estimado | 2022 |
| Año pronosticado | 2022-2029 |
| Periodo histórico | 2018-2020 |
| Unidad | Valor (Miles de millones de USD) (KILO LITROS) |
| Segmentación | Por tipo, sabor, canal de distribución y región. |
| Por tipo |
|
| Por sabor |
|
| Por canal de distribución |
|
El crecimiento del mercado de kombucha está siendo impulsado por las tendencias cambiantes de los consumidores, que incluyen un mayor enfoque en la salud y una preferencia por ingredientes naturales y orgánicos en alimentos y bebidas. El kombucha es una bebida natural y funcional que ha ganado reconocimiento como bebida nutricional, que ofrece posibles beneficios para la salud cardiovascular, problemas digestivos, artritis y otras afecciones inflamatorias, particularmente entre los consumidores de mayor edad. El mercado de kombucha está experimentando un aumento de la demanda debido a la creciente conciencia de los consumidores sobre la salud y la preferencia por una hidratación saludable. Para distinguir la bebida del cultivo bacteriano y de levadura, también se la conoce como té de kombucha.
La industria se está beneficiando del uso cada vez mayor de extractos y sabores naturales en las bebidas de kombucha, lo que está creando nuevas perspectivas de crecimiento para los actores de la industria. La disponibilidad de cultivos iniciadores de kombucha en línea ha hecho que sea más fácil para los consumidores comprar y preparar su propia kombucha, ya que la kombucha preparada puede ser costosa. Además, se espera que la creciente aplicación de kombucha en otros productos alimenticios y bebidas, como desayunos, coberturas para helados y dulces, cree futuras oportunidades de mercado.
[título id="attachment_22609" align="aligncenter" width="1920"]
Frequently Asked Questions
What is the worth of global kombucha market?
The Kombucha Market size had crossed USD 1.80 billion in 2020 and will observe a CAGR of more than 25% up to 2029
Which market segments are covered in the report on the kombucha market?
Based on by type, flavor, distribution channel the kombucha market report's divisions are broken down.
What is the CAGR of the kombucha market?
The global kombucha market registered a CAGR of 25% from 2022 to 2029. The industry segment was the highest revenue contributor to the market.
Which are the top companies to hold the market share in the kombucha market?
Key players profiled in the report include Buchi Kombucha, Hain Celestial Group, Hudson River Foods, Humm Kombucha LLC., Kombucha Wonder Drink, Kosmic Kombucha, Live Soda LLC, Mojo Beverages, NessAlla Kombucha, Remedy Kombucha Pty. Ltd., Revive Kombucha, Rok Kombucha, Tonicka Kombucha and others.
Which is the largest regional market for kombucha market?
In 2021, North America contributed the most to the market, accounting for 47.8% of the revenue. The drink is popular among consumers looking for a high-quality, healthier soft drink alternative, and the local market has grown quickly. The desire for an ethical, ecological, and low-sugar lifestyle among consumers in the United States and Canada has fueled the market for products.
Kombucha Market Segment Analysis
The kombucha market is segmented on the basis of type, flavor, and distribution channel.
On the basis of type, the market is divided into Bacteria, Yeast, Mold, and Others. The increasing popularity of kombucha is expected to be driven by the growing consumer preference for natural and organic beverages. Kombucha's ability to undergo fermentation through the action of yeast and bacteria is a key factor in its appeal as a healthful beverage option for customers.
On the basis of flavor, the kombucha market is segmented into Herbs & Spices, Citrus, Berries, Apple, Coconut & Mangoes, Flowers, and Others. The Herbs & Spices segment is likely to maintain a significant portion of the kombucha market share. This is because many leading kombucha manufacturers are focusing on creating unique and unconventional flavors by combining different herbs and spices with their kombucha tea. We utilize the following combination of herbs, either fresh when in season or in dried form: raspberry, blackberry, currants, strawberry, mint, lemon verbena, lemon balm, and hibiscus. Herbal kombucha offers an alternative to traditional kombucha. The Citrus segment is also expected to see significant growth during the forecast period, making it another prominent section of the kombucha drinks market. Citrus juices from grapefruit, orange, lemon, and lime make this kombucha sweet and tangy. maple syrup added for additional sweetness. This beverage offers a wealth of antioxidants, probiotics, and vitamins thanks to the combination of kombucha, blueberries, and ginger. Some of the alleged advantages are relief from motion sickness, anti-inflammatory effects, lowered blood pressure, cancer prevention, and lowered risk of heart disease. Sweet tea is combined with a little amount of kombucha starter, which contains both yeast and bacteria, to create kombucha, a fermented tea. Simply said, kombucha mold is an excess of harmful bacteria or fungi. It resembles mold that would develop on an old loaf of bread very little.
On the basis of distribution channel, the market is segmented into supermarkets/hypermarkets, specialist stores, convenience stores, online retailers, and other. Supermarkets and hypermarkets are determined to offer consumers an extensive selection of probiotic drinks and functional beverages.
Meanwhile, health stores and online retail channels are gaining significant popularity due to the detailed product descriptions and guidance they provide. These outlets are particularly appealing to consumers who place a high value on health and wellness.
[caption id="attachment_22612" align="aligncenter" width="1920"]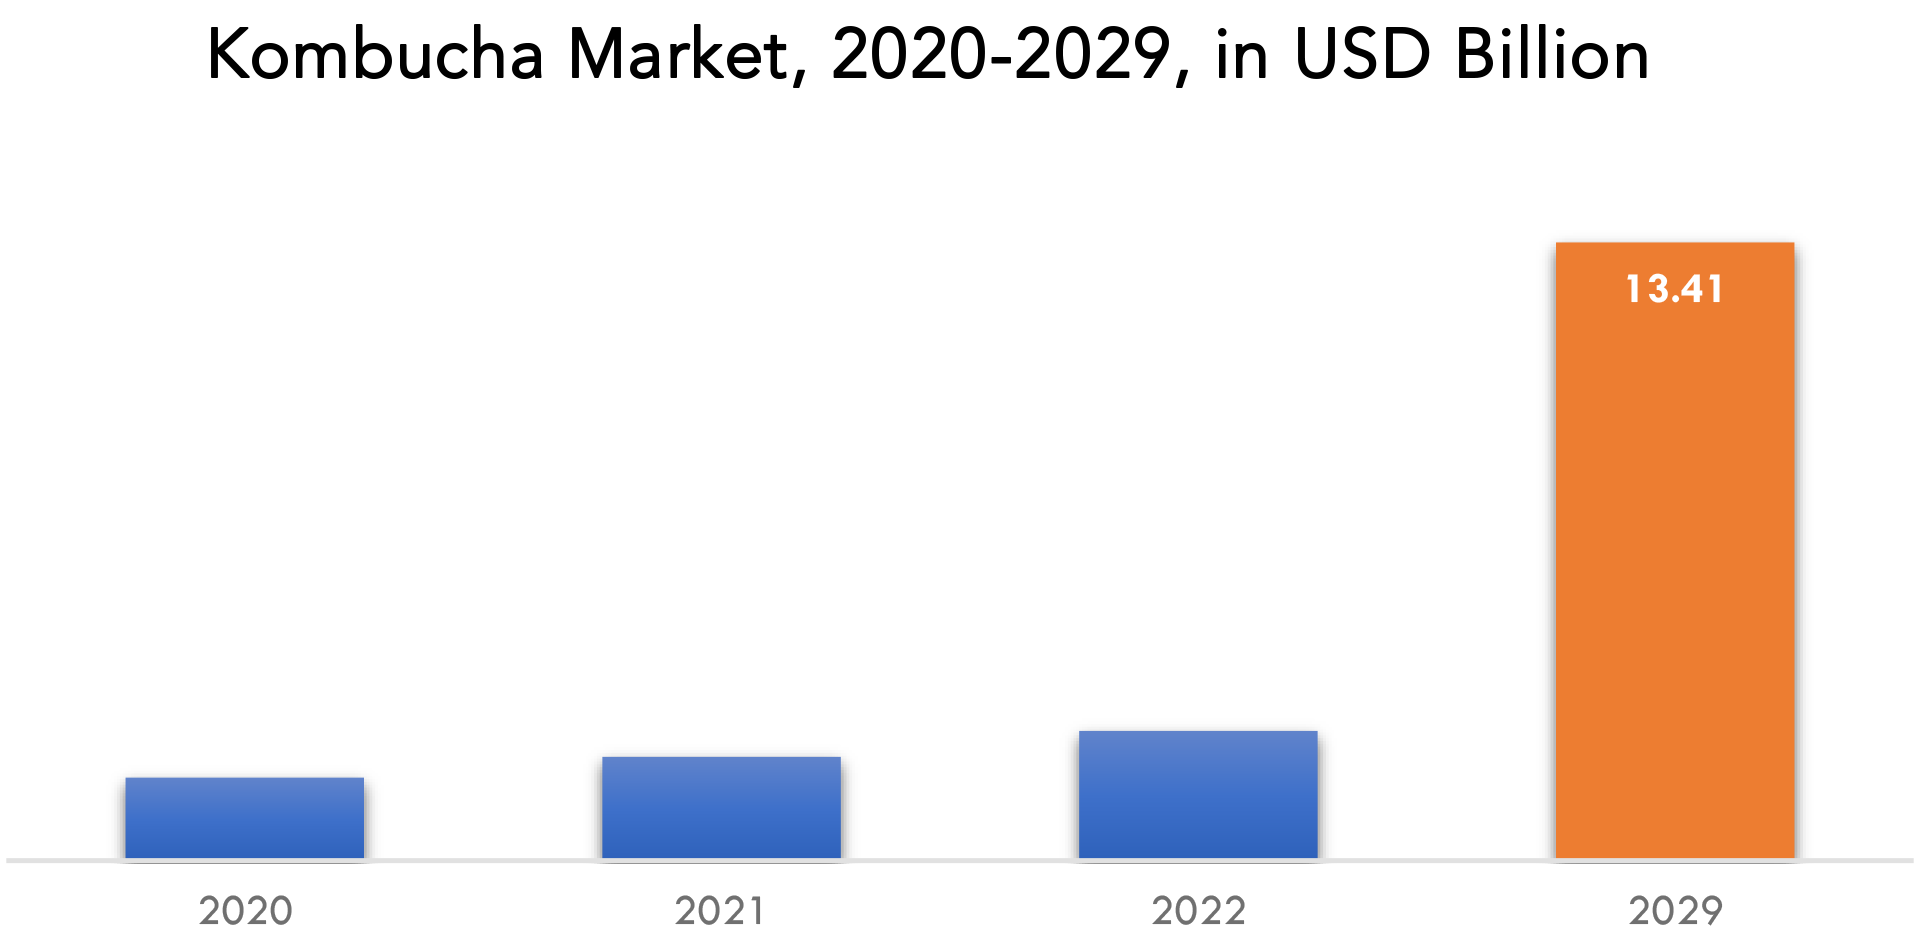
Kombucha Market Key Players:
The major players operating in the global radiation oncology industry include Buchi Kombucha, Hain Celestial Group, Hudson River Foods, Humm Kombucha LLC., Kombucha Wonder Drink, Kosmic Kombucha, Live Soda LLC, Mojo Beverages, NessAlla Kombucha, Remedy Kombucha Pty. Ltd., Revive Kombucha, Rok Kombucha, Tonicka Kombucha, and others. Mergers and acquisitions, joint ventures, capacity expansion, significant distribution, and branding decisions by established industry players to improve market share and regional presence. They are also engaged in ongoing R&D activities to develop new products and are focused on expanding the product portfolio. This is expected to increase competition and pose a threat to new entrants into the market.
Industry News: Dec. 23, 2021: Humm Expanded Platform as ‘Drink Better Co.’ with Probiotic Sodas and Seltzers. Oct. 19, 2021: Humm Kombucha announced that it has opened an USD 8 million line of credit with Naturally Gerber Finance to expand operations and fund new marketing initiatives.Who Should Buy? Or Key stakeholders
- Research and development
- Manufacturing
- End-Use Industries
- Government
- Investors
- Food and beverage industry
- Healthcare
Kombucha Market Regional Analysis
Geographically, the kombucha market is segmented into North America, South America, Europe, APAC and MEA.
- North America: includes the US, Canada, Mexico
- Europe: includes UK, Germany, France, Italy, Spain, Russia, and Rest of Europe
- Asia Pacific: includes China, Japan, South Korea, India, Australia, ASEAN and Rest of APAC
- South America: includes Brazil, Argentina and Rest of South America
- Middle East & Africa: includes Turkey, UAE, Saudi Arabia, South Africa, and Rest of MEA
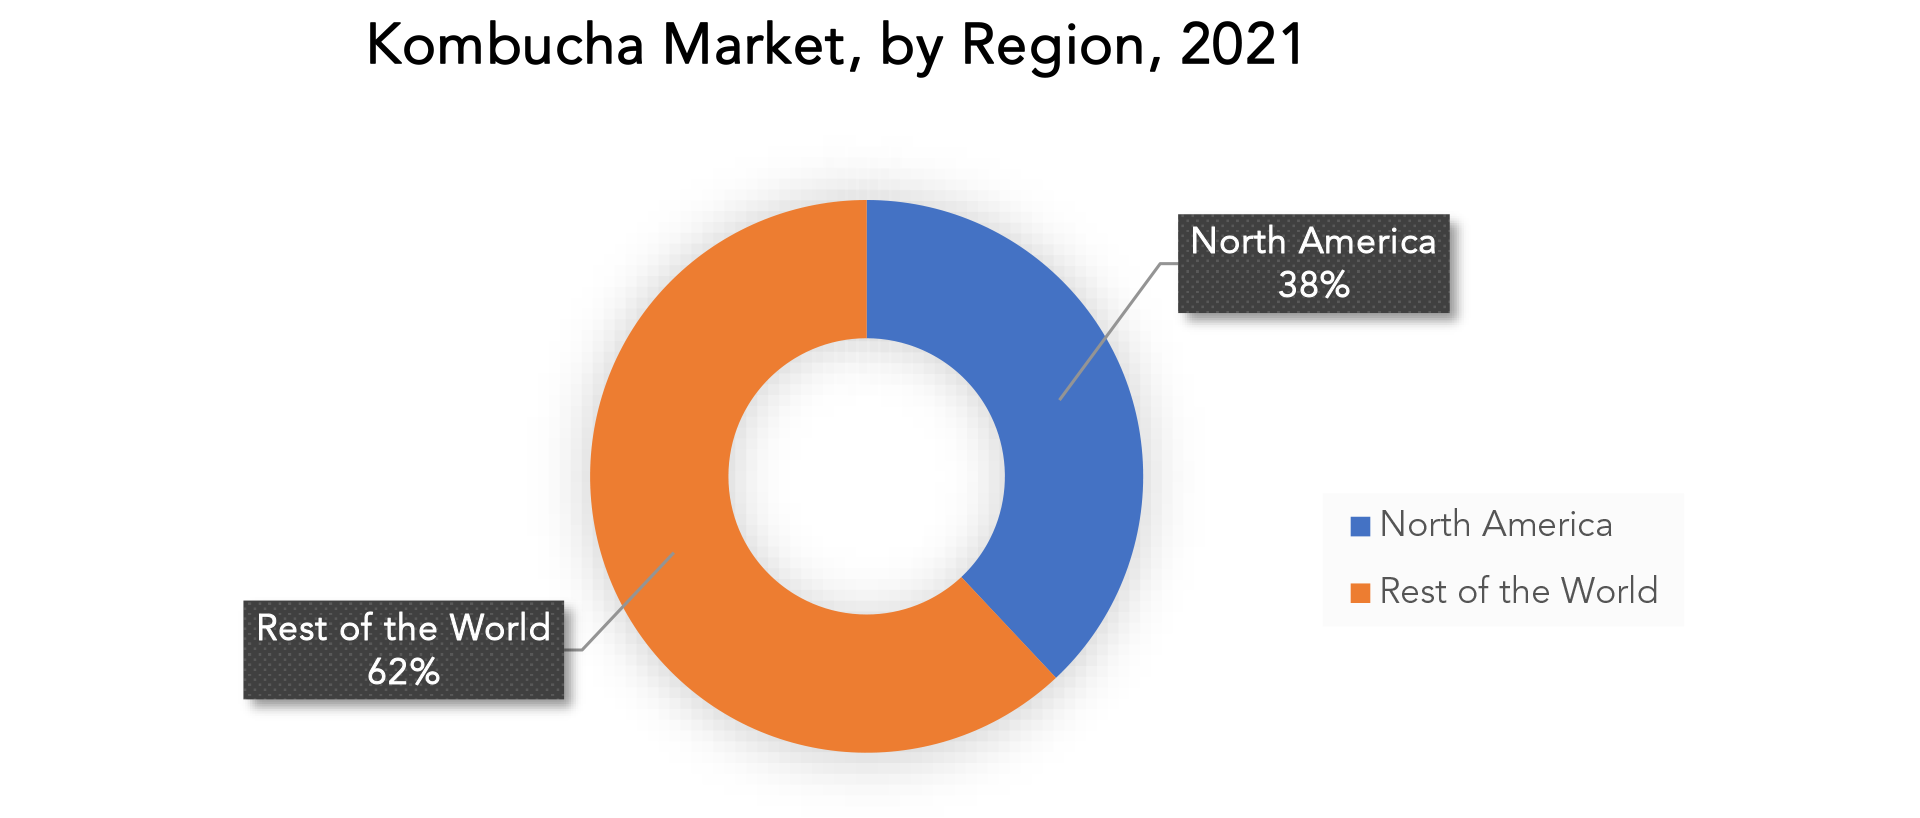
North America was the leading contributor to the kombucha market, accounting for around 38% of the total revenue. This region has witnessed rapid expansion in the market, with consumers seeking healthier soft drink alternatives of superior quality. The demand for the product has surged in the U.S. and Canada, where consumers are looking for an ethical, sustainable, and low-sugar lifestyle.
Kombucha has gained immense popularity in the region as a signature drink that offers potential health benefits of fermented foods and probiotics. The product's demand has increased significantly as it has become more widely available in various stores. Additionally, the USDA has certified certain ingredients used in organic kombuchas as safe for consumption, driving the demand for organic kombuchas among American consumers. As a signature drink with potential health advantages from probiotics and fermented foods, the beverage has grown in popularity in the area, and demand has increased as a result of its increased availability in a variety of outlets. Additionally, the desire for organic kombucha among American consumers is being fueled by the USDA's certification of a number of components utilized in these beverages as safe for consumption.
Furthermore, the construction industry in the U.S. has exhibited favorable growth, which has contributed to America holding the second-largest share of the global kombucha market. Europe, on the other hand, is currently leading the way in steady business growth.
Key Market Segments: Kombucha Market
Global Kombucha Market, By Type, 2020-2029 (USD Billion) (Kilo Liters)- Bacteria
- Yeast
- Mold
- Others
- Herbs & Spices
- Citrus
- Berries
- Apple
- Coconut & Mangoes
- Flowers
- Others
- Supermarkets/Hypermarkets
- Specialist Stores
- Convenience Stores
- Online Retailers
- Other Distribution Channel
- North America
- Europe
- Asia Pacific
- South America
- Middle East And Africa
Exactitude Consultancy Services Key Objectives
- Increasing sales and market share
- Developing new technology
- Improving profitability
- Entering new markets
- Enhancing brand reputation
Key Question Answered
- What is the expected growth rate of the kombucha market over the next 7 years?
- Who are the major players in the kombucha market and what is their market share?
- What are the end-user industries driving demand for market and what is their outlook?
- What are the opportunities for growth in emerging markets such as Asia-Pacific, Middle East, and Africa?
- How is the economic environment affecting the kombucha market, including factors such as interest rates, inflation, and exchange rates?
- What is the expected impact of government policies and regulations on the kombucha market?
- What is the current and forecasted size and growth rate of the global kombucha market?
- What are the key drivers of growth in the kombucha market?
- Who are the major players in the market and what is their market share?
- What are the distribution channels and supply chain dynamics in the kombucha market?
- What are the technological advancements and innovations in the kombucha market and their impact on product development and growth?
- What are the regulatory considerations and their impact on the market?
- What are the challenges faced by players in the kombucha market and how are they addressing these challenges?
- What are the opportunities for growth and expansion in the kombucha market?
- What are the product offerings and specifications of leading players in the market?
- What is the pricing trend of kombucha in the market and what is the impact of raw material prices on the price trend?
- INTRODUCCIÓN
- DEFINICIÓN DE MERCADO
- SEGMENTACIÓN DEL MERCADO
- CRONOGRAMAS DE INVESTIGACIÓN
- SUPUESTOS Y LIMITACIONES
- METODOLOGÍA DE LA INVESTIGACIÓN
- MINERÍA DE DATOS
- INVESTIGACIÓN SECUNDARIA
- INVESTIGACIÓN PRIMARIA
- ASESORAMIENTO DE EXPERTOS EN LA MATERIA
- CONTROLES DE CALIDAD
- REVISIÓN FINAL
- TRIANGULACIÓN DE DATOS
- ENFOQUE DE ABAJO HACIA ARRIBA
- ENFOQUE DE ARRIBA HACIA ABAJO
- FLUJO DE INVESTIGACIÓN
- FUENTES DE DATOS
- MINERÍA DE DATOS
- RESUMEN EJECUTIVO
- PANORAMA DEL MERCADO
- PERSPECTIVAS DEL MERCADO MUNDIAL DE KOMBUCHA
- IMPULSORES DEL MERCADO
- RESTRICCIONES DEL MERCADO
- OPORTUNIDADES DE MERCADO
- IMPACTO DEL COVID-19 EN EL MERCADO DE KOMBUCHA
- MODELO DE LAS CINCO FUERZAS DE PORTER
- AMENAZA DE NUEVOS INGRESANTES
- AMENAZA DE SUSTITUTOS
- PODER DE NEGOCIACIÓN DE LOS PROVEEDORES
- PODER DE NEGOCIACIÓN DE LOS CLIENTES
- GRADO DE COMPETENCIA
- ANÁLISIS DE LA CADENA DE VALOR DE LA INDUSTRIA
- PERSPECTIVAS DEL MERCADO MUNDIAL DE KOMBUCHA
- MERCADO MUNDIAL DE KOMBUCHA, POR TIPO, 2020-2029 (MILES DE MILLONES DE USD) (KILO LITROS)
- BACTERIAS
- LEVADURA
- MOHO
- OTROS
- MERCADO MUNDIAL DE KOMBUCHA, POR SABOR, 2020 - 2029 (MILES DE MILLONES DE USD) (KILO LITROS)
- HIERBAS Y ESPECIAS
- AGRIOS
- BAYAS
- MANZANA
- COCO Y MANGOS
- FLORES
- OTROS
- MERCADO GLOBAL DE KOMBUCHA, POR CANAL DE DISTRIBUCIÓN, 2020 - 2029 (MIL MILLONES DE USD) (KILO LITROS)
- SUPERMERCADOS/HIPERMERCADOS
- TIENDAS ESPECIALIZADAS
- TIENDAS DE CONVENIENCIA
- MINORISTAS EN LÍNEA
- OTROS CANALES DE DISTRIBUCIÓN
- MERCADO MUNDIAL DE KOMBUCHA POR REGIÓN, 2020-2029, (MILES DE MILLONES DE USD) (KILO LITROS)
- AMÉRICA DEL NORTE
- A NOSOTROS
- CANADÁ
- MÉXICO
- SUDAMERICA
- BRASIL
- ARGENTINA
- COLOMBIA
- RESTO DE SUDAMÉRICA
- EUROPA
- ALEMANIA
- Reino Unido
- FRANCIA
- ITALIA
- ESPAÑA
- RUSIA
- RESTO DE EUROPA
- ASIA PACÍFICO
- INDIA
- PORCELANA
- JAPÓN
- COREA DEL SUR
- AUSTRALIA
- ASIA SUDESTE
- RESTO DE ASIA PACÍFICO
- ORIENTE MEDIO Y ÁFRICA
- Emiratos Árabes Unidos
- ARABIA SAUDITA
- SUDÁFRICA
- RESTO DE ORIENTE MEDIO Y ÁFRICA
- AMÉRICA DEL NORTE
- PERFILES DE EMPRESAS* (DESCRIPCIÓN GENERAL DEL NEGOCIO, RESEÑA DE LA EMPRESA, PRODUCTOS OFRECIDOS, DESARROLLOS RECIENTES)
- KOMBUCHA BUCHI
- GRUPO CELESTIAL HAIN
- ALIMENTOS DEL RÍO HUDSON
- Distribuidor autorizado de HUMM KOMBUCHA.
- BEBIDA MARAVILLOSA DE KOMBUCHA
- KOMBUCHA KÓSMICA
- SODA VIVA LLC
- BEBIDAS MOJO
- KOMBUCHA NESSALLA
- REMEDY KOMBUCHA PTY. LTD.
- REVIVIR LA KOMBUCHA
- KOMBUCHA DE LA REPÚBLICA DE COREA
- TONICKA KOMBUCHA *EL LISTADO DE EMPRESAS ES ORIENTATIVO
LISTA DE TABLAS
TABLE 1 GLOBAL KOMBUCHA MARKET BY TYPE (USD BILLION) 2020-2029
TABLE 2 GLOBAL KOMBUCHA MARKET BY TYPE (KILO LITERS) 2020-2029
TABLE 3 GLOBAL KOMBUCHA MARKET BY FLAVOR (USD BILLION) 2020-2029
TABLE 4 GLOBAL KOMBUCHA MARKET BY FLAVOR (KILO LITERS) 2020-2029
TABLE 5 GLOBAL KOMBUCHA MARKET BY DISTRIBUTION CHANNEL (USD BILLION) 2020-2029
TABLE 6 GLOBAL KOMBUCHA MARKET BY DISTRIBUTION CHANNEL (KILO LITERS) 2020-2029
TABLE 7 GLOBAL KOMBUCHA MARKET BY REGION (USD BILLION) 2020-2029
TABLE 8 GLOBAL KOMBUCHA MARKET BY REGION (KILO LITERS) 2020-2029
TABLE 9 NORTH AMERICA KOMBUCHA MARKET BY COUNTRY (USD BILLION) 2020-2029
TABLE 10 NORTH AMERICA KOMBUCHA MARKET BY COUNTRY (KILO LITERS) 2020-2029
TABLE 11 NORTH AMERICA KOMBUCHA MARKET BY TYPE (USD BILLION) 2020-2029
TABLE 12 NORTH AMERICA KOMBUCHA MARKET BY TYPE (KILO LITERS) 2020-2029
TABLE 13 NORTH AMERICA KOMBUCHA MARKET BY FLAVOR (USD BILLION) 2020-2029
TABLE 14 NORTH AMERICA KOMBUCHA MARKET BY FLAVOR (KILO LITERS) 2020-2029
TABLE 15 NORTH AMERICA KOMBUCHA MARKET BY DISTRIBUTION CHANNEL (USD BILLION) 2020-2029
TABLE 16 NORTH AMERICA KOMBUCHA MARKET BY DISTRIBUTION CHANNEL (KILO LITERS) 2020-2029
TABLE 17 US KOMBUCHA MARKET BY TYPE (USD BILLION) 2020-2029
TABLE 18 US KOMBUCHA MARKET BY TYPE (KILO LITERS) 2020-2029
TABLE 19 US KOMBUCHA MARKET BY FLAVOR (USD BILLION) 2020-2029
TABLE 20 US KOMBUCHA MARKET BY FLAVOR (KILO LITERS) 2020-2029
TABLE 21 US KOMBUCHA MARKET BY DISTRIBUTION CHANNEL (USD BILLION) 2020-2029
TABLE 22 US KOMBUCHA MARKET BY DISTRIBUTION CHANNEL (KILO LITERS) 2020-2029
TABLE 23 CANADA KOMBUCHA MARKET BY TYPE (USD BILLION) 2020-2029
TABLE 24 CANADA KOMBUCHA MARKET BY TYPE (KILO LITERS) 2020-2029
TABLE 25 CANADA KOMBUCHA MARKET BY FLAVOR (USD BILLION) 2020-2029
TABLE 26 CANADA KOMBUCHA MARKET BY FLAVOR (KILO LITERS) 2020-2029
TABLE 27 CANADA KOMBUCHA MARKET BY DISTRIBUTION CHANNEL (USD BILLION) 2020-2029
TABLE 28 CANADA KOMBUCHA MARKET BY DISTRIBUTION CHANNEL (KILO LITERS) 2020-2029
TABLE 29 MEXICO KOMBUCHA MARKET BY TYPE (USD BILLION) 2020-2029
TABLE 30 MEXICO KOMBUCHA MARKET BY TYPE (KILO LITERS) 2020-2029
TABLE 31 MEXICO KOMBUCHA MARKET BY FLAVOR (USD BILLION) 2020-2029
TABLE 32 MEXICO KOMBUCHA MARKET BY FLAVOR (KILO LITERS) 2020-2029
TABLE 33 MEXICO KOMBUCHA MARKET BY DISTRIBUTION CHANNEL (USD BILLION) 2020-2029
TABLE 34 MEXICO KOMBUCHA MARKET BY DISTRIBUTION CHANNEL (KILO LITERS) 2020-2029
TABLE 35 SOUTH AMERICA KOMBUCHA MARKET BY COUNTRY (USD BILLION) 2020-2029
TABLE 36 SOUTH AMERICA KOMBUCHA MARKET BY COUNTRY (KILO LITERS) 2020-2029
TABLE 37 SOUTH AMERICA KOMBUCHA MARKET BY TYPE (USD BILLION) 2020-2029
TABLE 38 SOUTH AMERICA KOMBUCHA MARKET BY TYPE (KILO LITERS) 2020-2029
TABLE 39 SOUTH AMERICA KOMBUCHA MARKET BY FLAVOR (USD BILLION) 2020-2029
TABLE 40 SOUTH AMERICA KOMBUCHA MARKET BY FLAVOR (KILO LITERS) 2020-2029
TABLE 41 SOUTH AMERICA KOMBUCHA MARKET BY DISTRIBUTION CHANNEL (USD BILLION) 2020-2029
TABLE 42 SOUTH AMERICA KOMBUCHA MARKET BY DISTRIBUTION CHANNEL (KILO LITERS) 2020-2029
TABLE 43 BRAZIL KOMBUCHA MARKET BY TYPE (USD BILLION) 2020-2029
TABLE 44 BRAZIL KOMBUCHA MARKET BY TYPE (KILO LITERS) 2020-2029
TABLE 45 BRAZIL KOMBUCHA MARKET BY FLAVOR (USD BILLION) 2020-2029
TABLE 46 BRAZIL KOMBUCHA MARKET BY FLAVOR (KILO LITERS) 2020-2029
TABLE 47 BRAZIL KOMBUCHA MARKET BY DISTRIBUTION CHANNEL (USD BILLION) 2020-2029
TABLE 48 BRAZIL KOMBUCHA MARKET BY DISTRIBUTION CHANNEL (KILO LITERS) 2020-2029
TABLE 49 ARGENTINA KOMBUCHA MARKET BY TYPE (USD BILLION) 2020-2029
TABLE 50 ARGENTINA KOMBUCHA MARKET BY TYPE (KILO LITERS) 2020-2029
TABLE 51 ARGENTINA KOMBUCHA MARKET BY FLAVOR (USD BILLION) 2020-2029
TABLE 52 ARGENTINA KOMBUCHA MARKET BY FLAVOR (KILO LITERS) 2020-2029
TABLE 53 ARGENTINA KOMBUCHA MARKET BY DISTRIBUTION CHANNEL (USD BILLION) 2020-2029
TABLE 54 ARGENTINA KOMBUCHA MARKET BY DISTRIBUTION CHANNEL (KILO LITERS) 2020-2029
TABLE 55 COLOMBIA KOMBUCHA MARKET BY TYPE (USD BILLION) 2020-2029
TABLE 56 COLOMBIA KOMBUCHA MARKET BY TYPE (KILO LITERS) 2020-2029
TABLE 57 COLOMBIA KOMBUCHA MARKET BY FLAVOR (USD BILLION) 2020-2029
TABLE 58 COLOMBIA KOMBUCHA MARKET BY FLAVOR (KILO LITERS) 2020-2029
TABLE 59 COLOMBIA KOMBUCHA MARKET BY DISTRIBUTION CHANNEL (USD BILLION) 2020-2029
TABLE 60 COLOMBIA KOMBUCHA MARKET BY DISTRIBUTION CHANNEL (KILO LITERS) 2020-2029
TABLE 61 REST OF SOUTH AMERICA KOMBUCHA MARKET BY TYPE (USD BILLION) 2020-2029
TABLE 62 REST OF SOUTH AMERICA KOMBUCHA MARKET BY TYPE (KILO LITERS) 2020-2029
TABLE 63 REST OF SOUTH AMERICA KOMBUCHA MARKET BY FLAVOR (USD BILLION) 2020-2029
TABLE 64 REST OF SOUTH AMERICA KOMBUCHA MARKET BY FLAVOR (KILO LITERS) 2020-2029
TABLE 65 REST OF SOUTH AMERICA KOMBUCHA MARKET BY DISTRIBUTION CHANNEL (USD BILLION) 2020-2029
TABLE 66 REST OF SOUTH AMERICA KOMBUCHA MARKET BY DISTRIBUTION CHANNEL (KILO LITERS) 2020-2029
TABLE 67 ASIA-PACIFIC KOMBUCHA MARKET BY COUNTRY (USD BILLION) 2020-2029
TABLE 68 ASIA-PACIFIC KOMBUCHA MARKET BY COUNTRY (KILO LITERS) 2020-2029
TABLE 69 ASIA-PACIFIC KOMBUCHA MARKET BY TYPE (USD BILLION) 2020-2029
TABLE 70 ASIA-PACIFIC KOMBUCHA MARKET BY TYPE (KILO LITERS) 2020-2029
TABLE 71 ASIA-PACIFIC KOMBUCHA MARKET BY FLAVOR (USD BILLION) 2020-2029
TABLE 72 ASIA-PACIFIC KOMBUCHA MARKET BY FLAVOR (KILO LITERS) 2020-2029
TABLE 73 ASIA-PACIFIC KOMBUCHA MARKET BY DISTRIBUTION CHANNEL (USD BILLION) 2020-2029
TABLE 74 ASIA-PACIFIC KOMBUCHA MARKET BY DISTRIBUTION CHANNEL (KILO LITERS) 2020-2029
TABLE 75 INDIA KOMBUCHA MARKET BY TYPE (USD BILLION) 2020-2029
TABLE 76 INDIA KOMBUCHA MARKET BY TYPE (KILO LITERS) 2020-2029
TABLE 77 INDIA KOMBUCHA MARKET BY FLAVOR (USD BILLION) 2020-2029
TABLE 78 INDIA KOMBUCHA MARKET BY FLAVOR (KILO LITERS) 2020-2029
TABLE 79 INDIA KOMBUCHA MARKET BY DISTRIBUTION CHANNEL (USD BILLION) 2020-2029
TABLE 80 INDIA KOMBUCHA MARKET BY DISTRIBUTION CHANNEL (KILO LITERS) 2020-2029
TABLE 81 CHINA KOMBUCHA MARKET BY TYPE (USD BILLION) 2020-2029
TABLE 82 CHINA KOMBUCHA MARKET BY TYPE (KILO LITERS) 2020-2029
TABLE 83 CHINA KOMBUCHA MARKET BY FLAVOR (USD BILLION) 2020-2029
TABLE 84 CHINA KOMBUCHA MARKET BY FLAVOR (KILO LITERS) 2020-2029
TABLE 85 CHINA KOMBUCHA MARKET BY DISTRIBUTION CHANNEL (USD BILLION) 2020-2029
TABLE 86 CHINA KOMBUCHA MARKET BY DISTRIBUTION CHANNEL (KILO LITERS) 2020-2029
TABLE 87 JAPAN KOMBUCHA MARKET BY TYPE (USD BILLION) 2020-2029
TABLE 88 JAPAN KOMBUCHA MARKET BY TYPE (KILO LITERS) 2020-2029
TABLE 89 JAPAN KOMBUCHA MARKET BY FLAVOR (USD BILLION) 2020-2029
TABLE 90 JAPAN KOMBUCHA MARKET BY FLAVOR (KILO LITERS) 2020-2029
TABLE 91 JAPAN KOMBUCHA MARKET BY DISTRIBUTION CHANNEL (USD BILLION) 2020-2029
TABLE 92 JAPAN KOMBUCHA MARKET BY DISTRIBUTION CHANNEL (KILO LITERS) 2020-2029
TABLE 93 SOUTH KOREA KOMBUCHA MARKET BY TYPE (USD BILLION) 2020-2029
TABLE 94 SOUTH KOREA KOMBUCHA MARKET BY TYPE (KILO LITERS) 2020-2029
TABLE 95 SOUTH KOREA KOMBUCHA MARKET BY FLAVOR (USD BILLION) 2020-2029
TABLE 96 SOUTH KOREA KOMBUCHA MARKET BY FLAVOR (KILO LITERS) 2020-2029
TABLE 97 SOUTH KOREA KOMBUCHA MARKET BY DISTRIBUTION CHANNEL (USD BILLION) 2020-2029
TABLE 98 SOUTH KOREA KOMBUCHA MARKET BY DISTRIBUTION CHANNEL (KILO LITERS) 2020-2029
TABLE 99 AUSTRALIA KOMBUCHA MARKET BY TYPE (USD BILLION) 2020-2029
TABLE 100 AUSTRALIA KOMBUCHA MARKET BY TYPE (KILO LITERS) 2020-2029
TABLE 101 AUSTRALIA KOMBUCHA MARKET BY FLAVOR (USD BILLION) 2020-2029
TABLE 102 AUSTRALIA KOMBUCHA MARKET BY FLAVOR (KILO LITERS) 2020-2029
TABLE 103 AUSTRALIA KOMBUCHA MARKET BY DISTRIBUTION CHANNEL (USD BILLION) 2020-2029
TABLE 104 AUSTRALIA KOMBUCHA MARKET BY DISTRIBUTION CHANNEL (KILO LITERS) 2020-2029
TABLE 105 SOUTH-EAST ASIA KOMBUCHA MARKET BY TYPE (USD BILLION) 2020-2029
TABLE 106 SOUTH-EAST ASIA KOMBUCHA MARKET BY TYPE (KILO LITERS) 2020-2029
TABLE 107 SOUTH-EAST ASIA KOMBUCHA MARKET BY FLAVOR (USD BILLION) 2020-2029
TABLE 108 SOUTH-EAST ASIA KOMBUCHA MARKET BY FLAVOR (KILO LITERS) 2020-2029
TABLE 109 SOUTH-EAST ASIA KOMBUCHA MARKET BY DISTRIBUTION CHANNEL (USD BILLION) 2020-2029
TABLE 110 SOUTH-EAST ASIA KOMBUCHA MARKET BY DISTRIBUTION CHANNEL (KILO LITERS) 2020-2029
TABLE 111 REST OF ASIA PACIFIC KOMBUCHA MARKET BY TYPE (USD BILLION) 2020-2029
TABLE 112 REST OF ASIA PACIFIC KOMBUCHA MARKET BY TYPE (KILO LITERS) 2020-2029
TABLE 113 REST OF ASIA PACIFIC KOMBUCHA MARKET BY FLAVOR (USD BILLION) 2020-2029
TABLE 114 REST OF ASIA PACIFIC KOMBUCHA MARKET BY FLAVOR (KILO LITERS) 2020-2029
TABLE 115 REST OF ASIA PACIFIC KOMBUCHA MARKET BY DISTRIBUTION CHANNEL (USD BILLION) 2020-2029
TABLE 116 REST OF ASIA PACIFIC KOMBUCHA MARKET BY DISTRIBUTION CHANNEL (KILO LITERS) 2020-2029
TABLE 117 EUROPE KOMBUCHA MARKET BY COUNTRY (USD BILLION) 2020-2029
TABLE 118 EUROPE KOMBUCHA MARKET BY COUNTRY (KILO LITERS) 2020-2029
TABLE 119 EUROPE KOMBUCHA MARKET BY TYPE (USD BILLION) 2020-2029
TABLE 120 EUROPE KOMBUCHA MARKET BY TYPE (KILO LITERS) 2020-2029
TABLE 121 EUROPE KOMBUCHA MARKET BY FLAVOR (USD BILLION) 2020-2029
TABLE 122 EUROPE KOMBUCHA MARKET BY FLAVOR (KILO LITERS) 2020-2029
TABLE 123 EUROPE KOMBUCHA MARKET BY DISTRIBUTION CHANNEL (USD BILLION) 2020-2029
TABLE 124 EUROPE KOMBUCHA MARKET BY DISTRIBUTION CHANNEL (KILO LITERS) 2020-2029
TABLE 125 GERMANY KOMBUCHA MARKET BY TYPE (USD BILLION) 2020-2029
TABLE 126 GERMANY KOMBUCHA MARKET BY TYPE (KILO LITERS) 2020-2029
TABLE 127 GERMANY KOMBUCHA MARKET BY FLAVOR (USD BILLION) 2020-2029
TABLE 128 GERMANY KOMBUCHA MARKET BY FLAVOR (KILO LITERS) 2020-2029
TABLE 129 GERMANY KOMBUCHA MARKET BY DISTRIBUTION CHANNEL (USD BILLION) 2020-2029
TABLE 130 GERMANY KOMBUCHA MARKET BY DISTRIBUTION CHANNEL (KILO LITERS) 2020-2029
TABLE 131 UK KOMBUCHA MARKET BY TYPE (USD BILLION) 2020-2029
TABLE 132 UK KOMBUCHA MARKET BY TYPE (KILO LITERS) 2020-2029
TABLE 133 UK KOMBUCHA MARKET BY FLAVOR (USD BILLION) 2020-2029
TABLE 134 UK KOMBUCHA MARKET BY FLAVOR (KILO LITERS) 2020-2029
TABLE 135 UK KOMBUCHA MARKET BY DISTRIBUTION CHANNEL (USD BILLION) 2020-2029
TABLE 136 UK KOMBUCHA MARKET BY DISTRIBUTION CHANNEL (KILO LITERS) 2020-2029
TABLE 137 FRANCE KOMBUCHA MARKET BY TYPE (USD BILLION) 2020-2029
TABLE 138 FRANCE KOMBUCHA MARKET BY TYPE (KILO LITERS) 2020-2029
TABLE 139 FRANCE KOMBUCHA MARKET BY FLAVOR (USD BILLION) 2020-2029
TABLE 140 FRANCE KOMBUCHA MARKET BY FLAVOR (KILO LITERS) 2020-2029
TABLE 141 FRANCE KOMBUCHA MARKET BY DISTRIBUTION CHANNEL (USD BILLION) 2020-2029
TABLE 142 FRANCE KOMBUCHA MARKET BY DISTRIBUTION CHANNEL (KILO LITERS) 2020-2029
TABLE 143 ITALY KOMBUCHA MARKET BY TYPE (USD BILLION) 2020-2029
TABLE 144 ITALY KOMBUCHA MARKET BY TYPE (KILO LITERS) 2020-2029
TABLE 145 ITALY KOMBUCHA MARKET BY FLAVOR (USD BILLION) 2020-2029
TABLE 146 ITALY KOMBUCHA MARKET BY FLAVOR (KILO LITERS) 2020-2029
TABLE 147 ITALY KOMBUCHA MARKET BY DISTRIBUTION CHANNEL (USD BILLION) 2020-2029
TABLE 148 ITALY KOMBUCHA MARKET BY DISTRIBUTION CHANNEL (KILO LITERS) 2020-2029
TABLE 149 SPAIN KOMBUCHA MARKET BY TYPE (USD BILLION) 2020-2029
TABLE 150 SPAIN KOMBUCHA MARKET BY TYPE (KILO LITERS) 2020-2029
TABLE 151 SPAIN KOMBUCHA MARKET BY FLAVOR (USD BILLION) 2020-2029
TABLE 152 SPAIN KOMBUCHA MARKET BY FLAVOR (KILO LITERS) 2020-2029
TABLE 153 SPAIN KOMBUCHA MARKET BY DISTRIBUTION CHANNEL (USD BILLION) 2020-2029
TABLE 154 SPAIN KOMBUCHA MARKET BY DISTRIBUTION CHANNEL (KILO LITERS) 2020-2029
TABLE 155 RUSSIA KOMBUCHA MARKET BY TYPE (USD BILLION) 2020-2029
TABLE 156 RUSSIA KOMBUCHA MARKET BY TYPE (KILO LITERS) 2020-2029
TABLE 157 RUSSIA KOMBUCHA MARKET BY FLAVOR (USD BILLION) 2020-2029
TABLE 158 RUSSIA KOMBUCHA MARKET BY FLAVOR (KILO LITERS) 2020-2029
TABLE 159 RUSSIA KOMBUCHA MARKET BY DISTRIBUTION CHANNEL (USD BILLION) 2020-2029
TABLE 160 RUSSIA KOMBUCHA MARKET BY DISTRIBUTION CHANNEL (KILO LITERS) 2020-2029
TABLE 161 REST OF EUROPE KOMBUCHA MARKET BY TYPE (USD BILLION) 2020-2029
TABLE 162 REST OF EUROPE KOMBUCHA MARKET BY TYPE (KILO LITERS) 2020-2029
TABLE 163 REST OF EUROPE KOMBUCHA MARKET BY FLAVOR (USD BILLION) 2020-2029
TABLE 164 REST OF EUROPE KOMBUCHA MARKET BY FLAVOR (KILO LITERS) 2020-2029
TABLE 165 REST OF EUROPE KOMBUCHA MARKET BY DISTRIBUTION CHANNEL (USD BILLION) 2020-2029
TABLE 166 REST OF EUROPE KOMBUCHA MARKET BY DISTRIBUTION CHANNEL (KILO LITERS) 2020-2029
TABLE 167 MIDDLE EAST AND AFRICA KOMBUCHA MARKET BY COUNTRY (USD BILLION) 2020-2029
TABLE 168 MIDDLE EAST AND AFRICA KOMBUCHA MARKET BY COUNTRY (KILO LITERS) 2020-2029
TABLE 169 MIDDLE EAST AND AFRICA KOMBUCHA MARKET BY TYPE (USD BILLION) 2020-2029
TABLE 170 MIDDLE EAST AND AFRICA KOMBUCHA MARKET BY TYPE (KILO LITERS) 2020-2029
TABLE 171 MIDDLE EAST AND AFRICA KOMBUCHA MARKET BY FLAVOR (USD BILLION) 2020-2029
TABLE 172 MIDDLE EAST AND AFRICA KOMBUCHA MARKET BY FLAVOR (KILO LITERS) 2020-2029
TABLE 173 MIDDLE EAST AND AFRICA KOMBUCHA MARKET BY DISTRIBUTION CHANNEL (USD BILLION) 2020-2029
TABLE 174 MIDDLE EAST AND AFRICA KOMBUCHA MARKET BY DISTRIBUTION CHANNEL (KILO LITERS) 2020-2029
TABLE 175 UAE KOMBUCHA MARKET BY TYPE (USD BILLION) 2020-2029
TABLE 176 UAE KOMBUCHA MARKET BY TYPE (KILO LITERS) 2020-2029
TABLE 177 UAE KOMBUCHA MARKET BY FLAVOR (USD BILLION) 2020-2029
TABLE 178 UAE KOMBUCHA MARKET BY FLAVOR (KILO LITERS) 2020-2029
TABLE 179 UAE KOMBUCHA MARKET BY DISTRIBUTION CHANNEL (USD BILLION) 2020-2029
TABLE 180 UAE KOMBUCHA MARKET BY DISTRIBUTION CHANNEL (KILO LITERS) 2020-2029
TABLE 181 SAUDI ARABIA KOMBUCHA MARKET BY TYPE (USD BILLION) 2020-2029
TABLE 182 SAUDI ARABIA KOMBUCHA MARKET BY TYPE (KILO LITERS) 2020-2029
TABLE 183 SAUDI ARABIA KOMBUCHA MARKET BY FLAVOR (USD BILLION) 2020-2029
TABLE 184 SAUDI ARABIA KOMBUCHA MARKET BY FLAVOR (KILO LITERS) 2020-2029
TABLE 185 SAUDI ARABIA KOMBUCHA MARKET BY DISTRIBUTION CHANNEL (USD BILLION) 2020-2029
TABLE 186 SAUDI ARABIA KOMBUCHA MARKET BY DISTRIBUTION CHANNEL (KILO LITERS) 2020-2029
TABLE 187 SOUTH AFRICA KOMBUCHA MARKET BY TYPE (USD BILLION) 2020-2029
TABLE 188 SOUTH AFRICA KOMBUCHA MARKET BY TYPE (KILO LITERS) 2020-2029
TABLE 189 SOUTH AFRICA KOMBUCHA MARKET BY FLAVOR (USD BILLION) 2020-2029
TABLE 190 SOUTH AFRICA KOMBUCHA MARKET BY FLAVOR (KILO LITERS) 2020-2029
TABLE 191 SOUTH AFRICA KOMBUCHA MARKET BY DISTRIBUTION CHANNEL (USD BILLION) 2020-2029
TABLE 192 SOUTH AFRICA KOMBUCHA MARKET BY DISTRIBUTION CHANNEL (KILO LITERS) 2020-2029
TABLE 193 REST OF MIDDLE EAST AND AFRICA KOMBUCHA MARKET BY TYPE (USD BILLION) 2020-2029
TABLE 194 REST OF MIDDLE EAST AND AFRICA KOMBUCHA MARKET BY TYPE (KILO LITERS) 2020-2029
TABLE 195 REST OF MIDDLE EAST AND AFRICA KOMBUCHA MARKET BY FLAVOR (USD BILLION) 2020-2029
TABLE 196 REST OF MIDDLE EAST AND AFRICA KOMBUCHA MARKET BY FLAVOR (KILO LITERS) 2020-2029
TABLE 197 REST OF MIDDLE EAST AND AFRICA KOMBUCHA MARKET BY DISTRIBUTION CHANNEL (USD BILLION) 2020-2029
TABLE 198 REST OF MIDDLE EAST AND AFRICA KOMBUCHA MARKET BY DISTRIBUTION CHANNEL (KILO LITERS)2020-2029
LIST OF FIGURES
FIGURE 1 MARKET DYNAMICS
FIGURE 2 MARKET SEGMENTATION
FIGURE 3 REPORT TIMELINES: YEARS CONSIDERED
FIGURE 4 DATA TRIANGULATION
FIGURE 5 BOTTOM-UP APPROACH
FIGURE 6 TOP-DOWN APPROACH
FIGURE 7 RESEARCH FLOW
FIGURE 8 GLOBAL KOMBUCHA MARKET BY TYPE, USD BILLION, 2020-2029
FIGURE 9 GLOBAL KOMBUCHA MARKET BY FLAVOR, USD BILLION, 2020-2029
FIGURE 10 GLOBAL KOMBUCHA MARKET BY DISTRIBUTION CHANNEL, USD BILLION,
FIGURE 11 GLOBAL KOMBUCHA MARKET BY REGION, USD BILLION, 2020-2029
FIGURE 12 PORTER’S FIVE FORCES MODEL
FIGURE 13 GLOBAL KOMBUCHA MARKET BY TYPE, USD BILLION, 2021
FIGURE 14 GLOBAL KOMBUCHA MARKET BY FLAVOR, USD BILLION, 2021
FIGURE 15 GLOBAL KOMBUCHA MARKET BY DISTRIBUTION CHANNEL, USD BILLION 2021,
FIGURE 16 GLOBAL KOMBUCHA MARKET BY REGION, USD BILLION, 2021
FIGURE 17 MARKET SHARE ANALYSIS
FIGURE 18 BUCHI KOMBUCHA: COMPANY SNAPSHOT
FIGURE 19 HAIN CELESTIAL GROUP: COMPANY SNAPSHOT
FIGURE 20 HUDSON RIVER FOODS: COMPANY SNAPSHOT
FIGURE 21 HUMM KOMBUCHA LLC.: COMPANY SNAPSHOT
FIGURE 22 KOMBUCHA WONDER DRINK: COMPANY SNAPSHOT
FIGURE 23 KOSMIC KOMBUCHA: COMPANY SNAPSHOT
FIGURE 24 LIVE SODA LLC: COMPANY SNAPSHOT
FIGURE 25 MOJO BEVERAGES: COMPANY SNAPSHOT
FIGURE 26 NESSALLA KOMBUCHA: COMPANY SNAPSHOT
FIGURE 27 REMEDY KOMBUCHA PTY. LTD.: COMPANY SNAPSHOT
FIGURE 28 REVIVE KOMBUCHA: COMPANY SNAPSHOT
FIGURE 29 ROK KOMBUCHA: COMPANY SNAPSHOT
FIGURE 30 TONICKA KOMBUCHA: COMPANY SNAPSHOT
DOWNLOAD FREE SAMPLE REPORT
License Type
SPEAK WITH OUR ANALYST
Want to know more about the report or any specific requirement?
WANT TO CUSTOMIZE THE REPORT?
Our Clients Speak
We asked them to research ‘ Equipment market’ all over the world, and their whole arrangement was helpful to us. thehealthanalytics.com insightful analysis and reports contributed to our current analysis and in creating a future strategy. Besides, the te
Yosuke Mitsui
Senior Associate Construction Equipment Sales & Marketing
We asked them to research ‘Equipment market’ all over the world, and their whole arrangement was helpful to us. thehealthanalytics.com insightful analysis and reports contributed to our current analysis and in creating a future strategy. Besides, the te


