

Base Year Value ()
x.x %
x.x %
CAGR ()
x.x %
x.x %
Forecast Year Value ()
x.x %
x.x %
Historical Data Period
Largest Region
Forecast Period
Mercado de pasteurización no térmica por forma de alimento (líquido, sólido), técnica (campos eléctricos pulsados (PEF), procesamiento a alta presión (HPP), calentamiento volumétrico por microondas (MVH), ultrasonidos, irradiación, otros), aplicación (alimentos, bebidas, productos farmacéuticos, cosméticos) por región, tendencias globales y pronóstico de 2023 a 2029
Instant access to hundreds of data points and trends
- Market estimates from 2014-2029
- Competitive analysis, industry segmentation, financial benchmarks
- Incorporates SWOT, Porter's Five Forces and risk management frameworks
- PDF report or online database with Word, Excel and PowerPoint export options
- 100% money back guarantee
Descripción general del mercado de la pasteurización no térmica
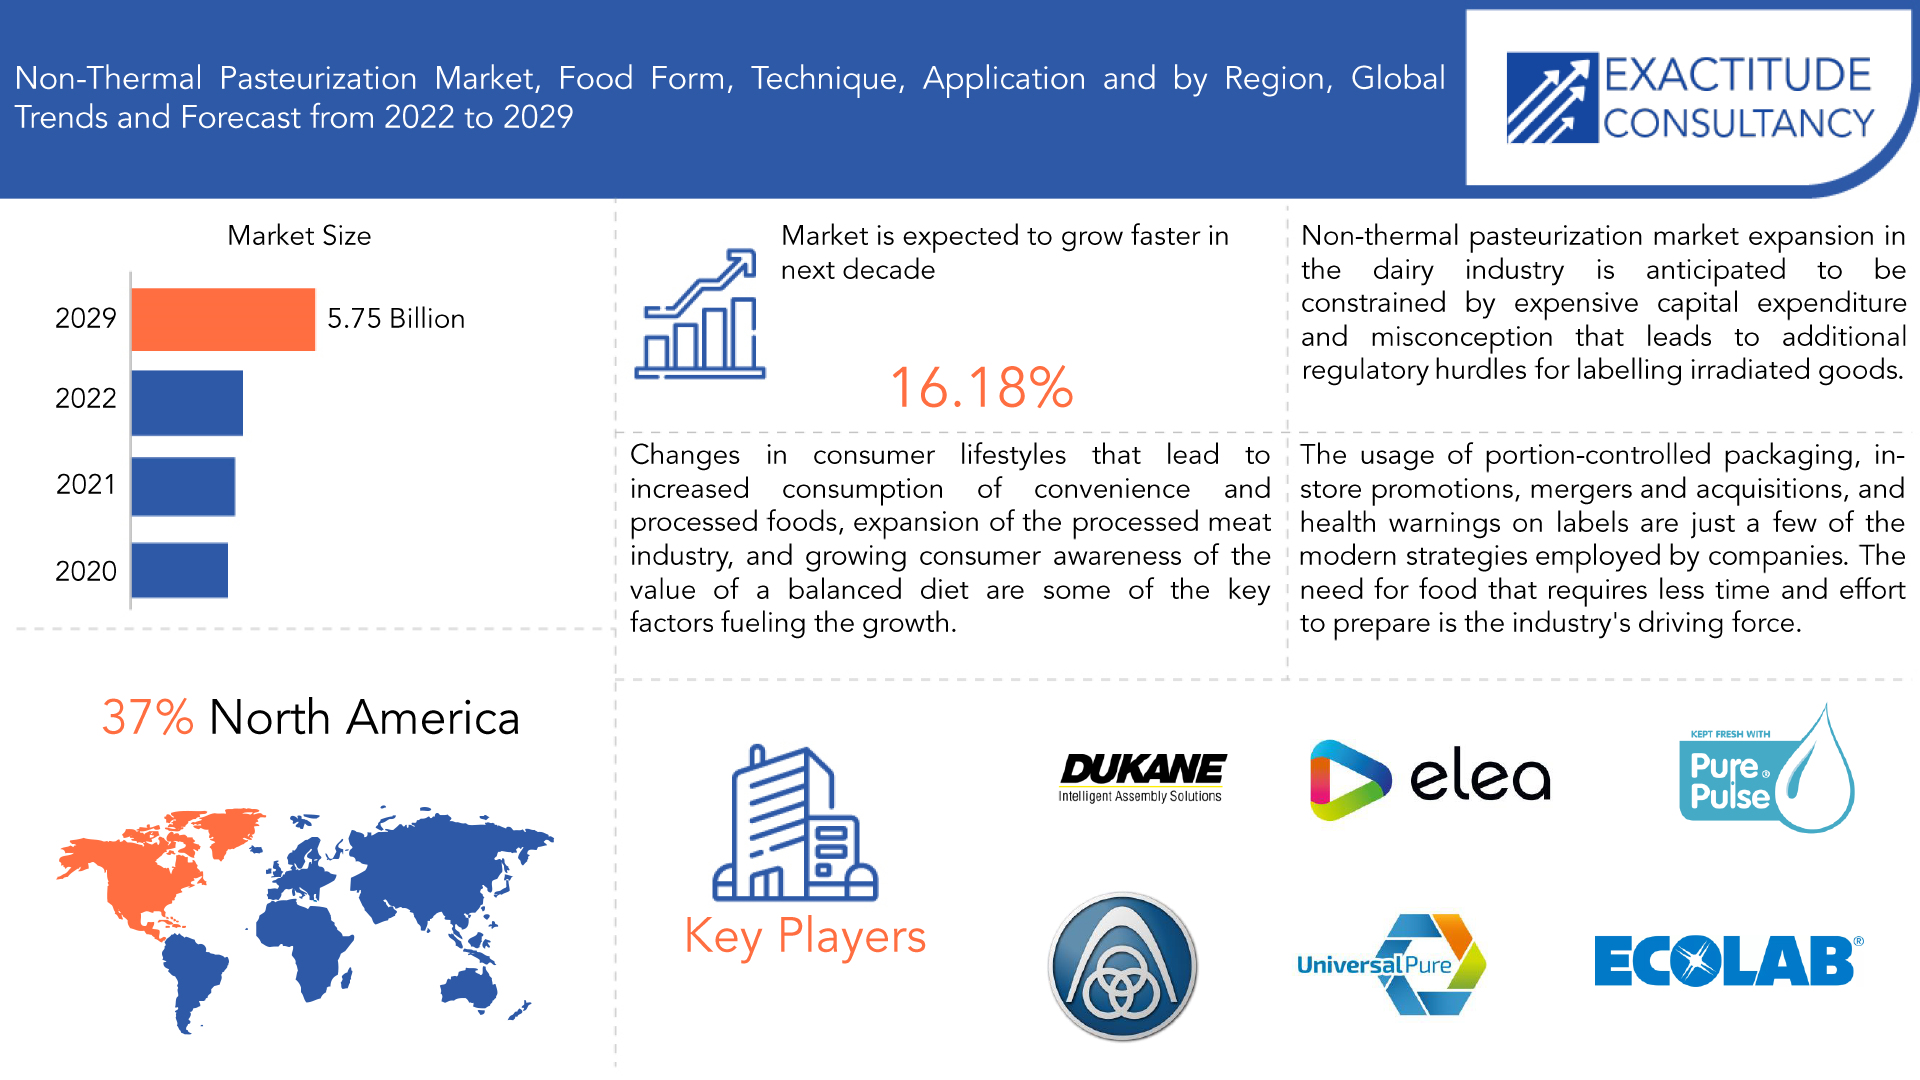
El tamaño del mercado global de pasteurización no térmica se valoró en USD 1.63 mil millones en 2020 y se proyecta que alcance los USD 5.75 mil millones para 2029, con una CAGR del 15,03% de 2022 a 2029.
La pasteurización sin el uso de calor se denomina pasteurización no térmica. Los procedimientos de pasteurización no térmica utilizan otras estrategias, como alta presión, luz ultravioleta, campos eléctricos pulsados o radiación ionizante, para lograr el mismo resultado que los procedimientos de pasteurización convencionales, que utilizan altas temperaturas para matar gérmenes y bacterias.
Para prevenir gérmenes y enfermedades microbianas, es preferible la pasteurización no térmica. Los productos que se someten a este procedimiento se benefician de tener una vida útil más larga. Al mantener intactos los aminoácidos, estos procedimientos ayudan a mejorar la calidad del producto. La necesidad de alimentos más sabrosos, sin aditivos y con una vida útil más larga está impulsando la expansión de la industria de la pasteurización no térmica. Las ventas de jugos premium y prensados en frío también están aumentando como resultado del color y la textura naturales .
La creciente demanda de la tecnología de pasteurización en frío debido a sus resultados efectivos y duraderos, así como el respaldo positivo de los gobiernos a esta tecnología alternativa de procesamiento de alimentos en todo el mundo, son los principales impulsores de la expansión del mercado. Iniciativas y campañas como la "etiqueta limpia" que buscan promover la transparencia con respecto a la información sobre el contenido nutricional indicado en los envases de los alimentos han llevado a un aumento en el uso de técnicas de pasteurización no térmica.
| ATRIBUTO | DETALLES |
| Periodo de estudio | 2020-2029 |
| Año base | 2021 |
| Año estimado | 2022 |
| Año pronosticado | 2022-2029 |
| Periodo histórico | 2018-2020 |
| Unidad | Valor (miles de millones de USD) |
| Segmentación | Por forma de alimento, por técnica, por aplicación, por región. |
| Por forma de alimento |
|
| Por técnica |
|
| Por aplicación |
|
| Por región |
|
Los cambios en los estilos de vida de los consumidores que conducen a un mayor consumo de alimentos procesados y de conveniencia, la expansión de la industria de la carne procesada y la creciente conciencia de los consumidores sobre el valor de una dieta equilibrada son algunos de los factores clave que impulsan el crecimiento del mercado mundial de la pasteurización no térmica. El mercado se está expandiendo como resultado de la creciente demanda de pasteurización no térmica por parte de sectores como la industria alimentaria y de bebidas y la farmacéutica. Además, se prevé que el mercado mundial de la pasteurización no térmica se desarrolle como resultado de la creciente urbanización, los altos ingresos disponibles y un estilo de vida ajetreado. El desarrollo de nuevas tecnologías y los rápidos esfuerzos de I+D para la creación de equipos innovadores y asequibles también están impulsando el mercado mundial de la pasteurización no térmica.
Se prevé que los elevados requisitos de capital del mercado de pasteurización no térmica limitarán la expansión del mercado durante el período proyectado. Sin embargo, a pesar de la creciente demanda, una variedad de partes interesadas suelen elegir la tecnología de pasteurización basada en calor debido a su simplicidad, lo que limita la expansión del mercado. Sin embargo, se prevé que las crecientes preocupaciones sobre los requisitos de etiquetado adicionales para los métodos basados en la pasteurización no térmica pueden frenar la adopción de la tecnología y tal vez impedir la expansión del mercado.
Esta forma de producción de alimentos utiliza mucho menos calor, lo que aumenta los beneficios nutricionales y sensoriales de la comida sin sacrificar su valor nutricional. La expansión del mercado de pasteurización no térmica en el sector de equipos de procesamiento de productos lácteos se está acelerando, y se prevé que estas actividades generen oportunidades de crecimiento para el mercado durante el período de pronóstico. Las actividades de investigación y desarrollo están aumentando para mejorar el proceso y hacerlo mejor para diversas aplicaciones alimentarias. Además, el aumento de la financiación para las actividades de investigación ofrece una oportunidad para el desarrollo del mercado.
Cada nación tiene estándares de calidad y seguridad, que se implementan y mantienen mediante el cumplimiento de diversas pautas e instrucciones. El comercio y las cadenas de suministro han hecho que el mundo sea más sólido y fluido, pero las leyes inconsistentes y redundantes que deben cumplirse han aumentado los precios y han generado una pérdida de tiempo. Si todos los países acuerdan y ratifican un código único, los procedimientos de prueba, cumplimiento, auditoría y entrega de productos serán más rentables. Por lo tanto, se anticipa que la ausencia de leyes y normas estándar sería un obstáculo para el desarrollo del mercado.
[título id="attachment_22680" align="aligncenter" width="1920"]
Frequently Asked Questions
• What is the worth of non-thermal pasteurization market?
The non-thermal pasteurization market is expected to reach USD 2.48 billion by the end of 2023.
• What are the upcoming trends of non-thermal pasteurization market globally?
Integration with smart home devices is the ongoing trend observed.
• What is the CAGR of non-thermal pasteurization market?
The global non-thermal pasteurization market size was valued at USD 1.63 billion in 2020, and projected to reach USD 5.75 billion by 2029, with a CAGR of 15.03% from 2022 to 2029.
• Which are the top companies to hold the market share in non-thermal pasteurization market?
The global market is fragmented in nature with the presence of various key players such Hiperbaric, Avure Technologies, ThyssenKrupp AG, Dukane, Chic Freshertech, Nordion, Ecolab Inc., Bosch Packaging Technology, Elea Vertriebs, JBT Corporation, Gray Star Inc., Stansted Fluid Power Ltd., Universal Pure, Pulsemaster BV, PurePulse Technologies
• Which is the largest regional market for non-thermal pasteurization market?
The North America dominated the global industry in 2021 and accounted for the maximum share of more than 37% of the overall revenue.
Non-Thermal Pasteurization Market Segment Analysis
The section of forms is split into solid and liquid. In 2021, the solid market category led with over 58% of worldwide sales. In processed food goods like meat products, cheese, jams, jellies, processed meals, etc. that are in solid form, non-thermal pasteurization technology is frequently utilized. Nevertheless, a number of technologies, including PEF and HPP, are frequently employed to enhance the extraction of sugars and various bioactive ingredients to preserve the food for longer.
The PEF, HPP, MVH, ultrasonic, irradiation, and others categories are included in the technique section. With a market share of about 22% in 2021, the PEF sector prevailed. Food items' freshness and shelf life are both preserved using the Pulsed Electric Field (PEF) technology. Also, since no chemicals or preservatives are added to the items, it gives the consumer access to fresh, natural, and minimally processed meals. In contrast to HPP, PEF is more widely accepted by the processed food sector. These elements fuel the market's expansion in the category.
The application segment is divided into food, pharmaceuticals, beverages, and cosmetics. Beverages is anticipated to develop at the fastest CAGR of 24.5% over the projected period. To increase the shelf life of beverages and prevent the growth of germs, non-thermal pasteurization techniques like HPP and PEF are being employed more often in the beverage industry. With this technology, it is possible to maintain the colors, tastes, and nutrients in beverages, allowing them to be held at room temperature. This is anticipated to fuel the non-thermal pasteurization market's expansion in the beverages sector.
[caption id="attachment_22689" align="aligncenter" width="1920"]
Non-Thermal Pasteurization Market Players
The global market is fragmented in nature with the presence of various key players such as Hiperbaric, Avure Technologies, ThyssenKrupp AG, Dukane, Chic Freshertech, Nordion, Ecolab Inc., Bosch Packaging Technology, Elea Vertriebs, JBT Corporation, Gray Star Inc., Stansted Fluid Power Ltd., Universal Pure, Pulsemaster BV, PurePulse Technologies along with medium and small-scale regional players operating in different parts of the world. Major companies in the market compete in terms of application development capability, product launches, and development of new technologies for product formulation.
JUNE 02, 2022 - Universal Pure Holdings, LLC announced the acquisition of Keller Logistics Group, Inc.'s Hydrofresh Ltd., an outsourced HPP and cold storage supplier with a strong market presence in the Midwest.
July 1, 2022 - JBT Corporation, a global provider of high-value technology solutions to the food and beverage industries, had acquired Alco-food-machines GmbH & Co. KG, a leading developer of additional food processing systems and production lines.
Who Should Buy? Or Key Stakeholders
- Raw material providers
- Related associations
- Government bodies
- Regulating authorities
- Policy makers
- Venture capitalists
- Start-up companies
- End users of non-thermal pasteurization
- Research institutes
- Consulting companies
Non-Thermal Pasteurization Market Regional Analysis
Geographically, the non-thermal pasteurization market is segmented into North America, South America, Europe, APAC and MEA.
- North America: includes the US, Canada, Mexico
- Europe: includes UK, Germany, France, Italy, Spain, Russia, and Rest of Europe
- Asia Pacific: includes China, Japan, South Korea, India, Australia, ASEAN and Rest of APAC
- South America: includes Brazil, Argentina and Rest of South America
- Middle East & Africa: includes Turkey, UAE, Saudi Arabia, South Africa, and Rest of MEA
Throughout the projection period, North America is anticipated to acquire the maximum market share in 2021. The largest market share is contributed over the projection period by major nations like Canada and the US. The region's market has grown as a consequence of rising nonthermal pasteurization demand in the food processing sector to stop microbial development and increase shelf life. Also, growing investments by various nations in technology and equipment for food processing help the nonthermal pasteurization industry in the area to grow. The demand for upmarket juices has grown as people become more aware of the benefits of living a healthy lifestyle, which has led to a rise in the use of nonthermal pasteurization methods in the beverage sector. The market has grown as a result of rising demand for meat products in this area.
[caption id="attachment_22692" align="aligncenter" width="1920"]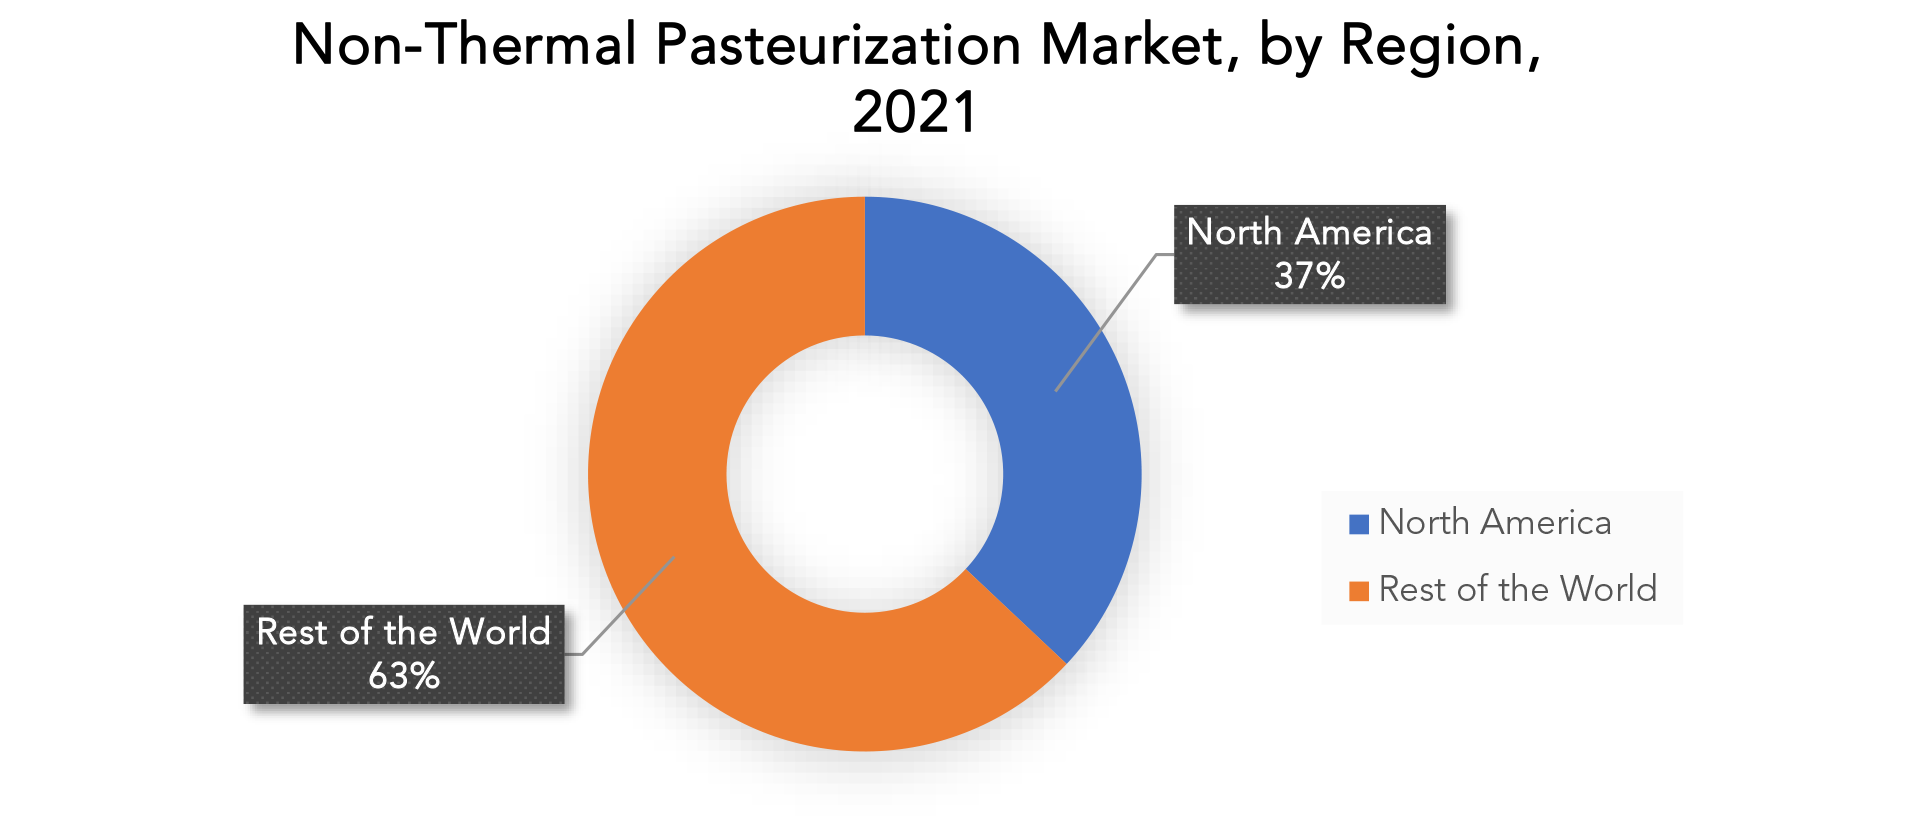
Key Market Segments: Non-Thermal Pasteurization Market
Non-Thermal Pasteurization Market By Food From, 2020-2029, (USD Billion)- Liquid
- Solid
- Pulsed Electric Fields (PEF)
- High Pressure Processing (HPP)
- Microwave Volumetric Heating (MVH)
- Ultrasonic
- Irradiation
- Others
- Food
- Beverages
- Pharmaceutical
- Cosmetics
- North America
- Europe
- Asia Pacific
- South America
- Middle East And Africa
Exactitude Consultancy Services Key Objectives:
- Increasing sales and market share
- Developing new technology
- Improving profitability
- Entering new markets
- Enhancing brand reputation
Key Question Answered
- What is the expected growth rate of the non-thermal pasteurization market over the next 7 years?
- Who are the major players in the non-thermal pasteurization market and what is their market share?
- What are the end-user industries driving demand for market and what is their outlook?
- What are the opportunities for growth in emerging markets such as Asia-Pacific, Middle East, and Africa?
- How is the economic environment affecting the non-thermal pasteurization market, including factors such as interest rates, inflation, and exchange rates?
- What is the expected impact of government policies and regulations on non-thermal pasteurization market?
- What is the current and forecasted size and growth rate of the global non-thermal pasteurization market?
- What are the key drivers of growth in the non-thermal pasteurization market?
- Who are the major players in the market and what is their market share?
- What are the distribution channels and supply chain dynamics in the non-thermal pasteurization market?
- What are the technological advancements and innovations in the non-thermal pasteurization market and their impact on product development and growth?
- What are the regulatory considerations and their impact on the market?
- What are the challenges faced by players in the non-thermal pasteurization market and how are they addressing these challenges?
- What are the opportunities for growth and expansion in the non-thermal pasteurization market?
- What are the service offerings and specifications of leading players in the market?
- Introducción
- Definición de mercado
- Segmentación del mercado
- Cronología de la investigación
- Supuestos y limitaciones
- Metodología de la investigación
- Minería de datos
- Investigación secundaria
- Investigación primaria
- Asesoramiento de expertos en la materia
- Controles de calidad
- Revisión final
- Triangulación de datos
- Enfoque de abajo hacia arriba
- Enfoque de arriba hacia abajo
- Research Flow
- Data Sources
- Minería de datos
- Executive Summary
- Market Overview
- Non-Thermal Pasteurization Market Outlook
- Market Drivers
- Market Restraints
- Market Opportunities
- Impact of Covid-19 On Non-Thermal Pasteurization Market
- Porter’s five forces model
- Threat from new entrants
- Threat from substitutes
- Bargaining power of suppliers
- Bargaining power of customers
- Degree of competition
- Industry value chain Analysis
- Non-Thermal Pasteurization Market Outlook
- Global Non-Thermal Pasteurization Market by Food Form, 2020-2029, (USD BILLION)
- Liquid
- Solid
- Global Non-Thermal Pasteurization Market by Technique, 2020-2029, (USD BILLION)
- Pulsed Electric Fields (PEF)
- High Pressure Processing (HPP)
- Microwave Volumetric Heating (MVH)
- Ultrasonic
- Irradiation
- Others
- Global Non-Thermal Pasteurization Market by Application, 2020-2029, (USD BILLION)
- Food
- Beverages
- Pharmaceutical
- Cosmetics
- Global Non-Thermal Pasteurization Market by Region, 2020-2029, (USD BILLION)
- North America
- US
- Canada
- Mexico
- South America
- Brazil
- Argentina
- Colombia
- Rest Of South America
- Europe
- Germany
- UK
- France
- Italy
- Spain
- Russia
- Rest Of Europe
- Asia Pacific
- India
- China
- Japan
- South Korea
- Australia
- South-East Asia
- Rest Of Asia Pacific
- Middle East and Africa
- UAE
- Saudi Arabia
- South Africa
- Rest Of Middle East and Africa
- North America
- Company Profiles*
(Business Overview, Company Snapshot, Products Offered, Recent Developments)
9.1 Hiperbaric
9.2 Avure Technologies
9.3 ThyssenKrupp AG
9.4 Dukane
9.5 Chic Freshertech
9.6 Nordion
9.7 Ecolab Inc.
9.8 Bosch Packaging Technology
9.9 Elea Vertriebs
9.10 JBT Corporation
9.11 Gray Star Inc.
9.12 Stansted Fluid Power Ltd.
9.13 Universal Pure
9.14 Pulsemaster BV
9.15 PurePulse Technologies
*The Company List Is Indicative
LIST OF TABLES
TABLE 1 GLOBAL NON-THERMAL PASTEURIZATION MARKET BY FOOD FORM (USD BILLION) 2020-2029
TABLE 2 GLOBAL NON-THERMAL PASTEURIZATION MARKET BY TECHNIQUE (USD BILLION) 2020-2029
TABLE 3 GLOBAL NON-THERMAL PASTEURIZATION MARKET BY APPLICATION (USD BILLION) 2020-2029
TABLE 4 GLOBAL NON-THERMAL PASTEURIZATION MARKET BY REGIONS (USD BILLION) 2020-2029
TABLE 5 NORTH AMERICA NON-THERMAL PASTEURIZATION MARKET BY FOOD FORM (USD BILLION) 2020-2029
TABLE 6 NORTH AMERICA NON-THERMAL PASTEURIZATION MARKET BY TECHNIQUE (USD BILLION) 2020-2029
TABLE 7 NORTH AMERICA NON-THERMAL PASTEURIZATION MARKET BY APPLICATION (USD BILLION) 2020-2029
TABLE 8 NORTH AMERICA NON-THERMAL PASTEURIZATION MARKET BY COUNTRY (USD BILLION) 2020-2029
TABLE 9 US NON-THERMAL PASTEURIZATION MARKET BY FOOD FORM (USD BILLION) 2020-2029
TABLE 10 US NON-THERMAL PASTEURIZATION MARKET BY TECHNIQUE (USD BILLION) 2020-2029
TABLE 11 US NON-THERMAL PASTEURIZATION MARKET BY APPLICATION (USD BILLION) 2020-2029
TABLE 12 US NON-THERMAL PASTEURIZATION MARKET BY REGIONS (USD BILLION) 2020-2029
TABLE 13 CANADA NON-THERMAL PASTEURIZATION MARKET BY FOOD FORM (USD BILLION) 2020-2029
TABLE 14 CANADA NON-THERMAL PASTEURIZATION MARKET BY TECHNIQUE (USD BILLION) 2020-2029
TABLE 15 CANADA NON-THERMAL PASTEURIZATION MARKET BY APPLICATION (USD BILLION) 2020-2029
TABLE 16 CANADA NON-THERMAL PASTEURIZATION MARKET BY REGIONS (USD BILLION) 2020-2029
TABLE 17 MEXICO NON-THERMAL PASTEURIZATION MARKET BY FOOD FORM (USD BILLION) 2020-2029
TABLE 18 MEXICO NON-THERMAL PASTEURIZATION MARKET BY TECHNIQUE (USD BILLION) 2020-2029
TABLE 19 MEXICO NON-THERMAL PASTEURIZATION MARKET BY APPLICATION (USD BILLION) 2020-2029
TABLE 20 MEXICO NON-THERMAL PASTEURIZATION MARKET BY REGIONS (USD BILLION) 2020-2029
TABLE 21 SOUTH AMERICA NON-THERMAL PASTEURIZATION MARKET BY FOOD FORM (USD BILLION) 2020-2029
TABLE 22 SOUTH AMERICA NON-THERMAL PASTEURIZATION MARKET BY TECHNIQUE (USD BILLION) 2020-2029
TABLE 23 SOUTH AMERICA NON-THERMAL PASTEURIZATION MARKET BY APPLICATION (USD BILLION) 2020-2029
TABLE 24 SOUTH AMERICA NON-THERMAL PASTEURIZATION MARKET BY COUNTRY (USD BILLION) 2020-2029
TABLE 25 BRAZIL NON-THERMAL PASTEURIZATION MARKET BY FOOD FORM (USD BILLION) 2020-2029
TABLE 26 BRAZIL NON-THERMAL PASTEURIZATION MARKET BY TECHNIQUE (USD BILLION) 2020-2029
TABLE 27 BRAZIL NON-THERMAL PASTEURIZATION MARKET BY APPLICATION (USD BILLION) 2020-2029
TABLE 28 BRAZIL NON-THERMAL PASTEURIZATION MARKET BY REGIONS (USD BILLION) 2020-2029
TABLE 29 ARGENTINA NON-THERMAL PASTEURIZATION MARKET BY FOOD FORM (USD BILLION) 2020-2029
TABLE 30 ARGENTINA NON-THERMAL PASTEURIZATION MARKET BY TECHNIQUE (USD BILLION) 2020-2029
TABLE 31 ARGENTINA NON-THERMAL PASTEURIZATION MARKET BY APPLICATION (USD BILLION) 2020-2029
TABLE 32 ARGENTINA NON-THERMAL PASTEURIZATION MARKET BY REGIONS (USD BILLION) 2020-2029
TABLE 33 COLOMBIA NON-THERMAL PASTEURIZATION MARKET BY FOOD FORM (USD BILLION) 2020-2029
TABLE 34 COLOMBIA NON-THERMAL PASTEURIZATION MARKET BY TECHNIQUE (USD BILLION) 2020-2029
TABLE 35 COLOMBIA NON-THERMAL PASTEURIZATION MARKET BY APPLICATION (USD BILLION) 2020-2029
TABLE 36 COLOMBIA NON-THERMAL PASTEURIZATION MARKET BY REGIONS (USD BILLION) 2020-2029
TABLE 37 REST OF SOUTH AMERICA NON-THERMAL PASTEURIZATION MARKET BY FOOD FORM (USD BILLION) 2020-2029
TABLE 38 REST OF SOUTH AMERICA NON-THERMAL PASTEURIZATION MARKET BY TECHNIQUE (USD BILLION) 2020-2029
TABLE 39 REST OF SOUTH AMERICA NON-THERMAL PASTEURIZATION MARKET BY APPLICATION (USD BILLION) 2020-2029
TABLE 40 REST OF SOUTH AMERICA NON-THERMAL PASTEURIZATION MARKET BY REGIONS (USD BILLION) 2020-2029
TABLE 41 ASIA-PACIFIC NON-THERMAL PASTEURIZATION MARKET BY FOOD FORM (USD BILLION) 2020-2029
TABLE 42 ASIA-PACIFIC NON-THERMAL PASTEURIZATION MARKET BY TECHNIQUE (USD BILLION) 2020-2029
TABLE 43 ASIA-PACIFIC NON-THERMAL PASTEURIZATION MARKET BY APPLICATION (USD BILLION) 2020-2029
TABLE 44 ASIA-PACIFIC NON-THERMAL PASTEURIZATION MARKET BY COUNTRY (USD BILLION) 2020-2029
TABLE 45 INDIA NON-THERMAL PASTEURIZATION MARKET BY FOOD FORM (USD BILLION) 2020-2029
TABLE 46 INDIA NON-THERMAL PASTEURIZATION MARKET BY TECHNIQUE (USD BILLION) 2020-2029
TABLE 47 INDIA NON-THERMAL PASTEURIZATION MARKET BY APPLICATION (USD BILLION) 2020-2029
TABLE 48 INDIA NON-THERMAL PASTEURIZATION MARKET BY REGIONS (USD BILLION) 2020-2029
TABLE 49 CHINA NON-THERMAL PASTEURIZATION MARKET BY FOOD FORM (USD BILLION) 2020-2029
TABLE 50 CHINA NON-THERMAL PASTEURIZATION MARKET BY TECHNIQUE (USD BILLION) 2020-2029
TABLE 51 CHINA NON-THERMAL PASTEURIZATION MARKET BY APPLICATION (USD BILLION) 2020-2029
TABLE 52 CHINA NON-THERMAL PASTEURIZATION MARKET BY REGIONS (USD BILLION) 2020-2029
TABLE 53 JAPAN NON-THERMAL PASTEURIZATION MARKET BY FOOD FORM (USD BILLION) 2020-2029
TABLE 54 JAPAN NON-THERMAL PASTEURIZATION MARKET BY TECHNIQUE (USD BILLION) 2020-2029
TABLE 55 JAPAN NON-THERMAL PASTEURIZATION MARKET BY APPLICATION (USD BILLION) 2020-2029
TABLE 56 JAPAN NON-THERMAL PASTEURIZATION MARKET BY REGIONS (USD BILLION) 2020-2029
TABLE 57 SOUTH KOREA NON-THERMAL PASTEURIZATION MARKET BY FOOD FORM (USD BILLION) 2020-2029
TABLE 58 SOUTH KOREA NON-THERMAL PASTEURIZATION MARKET BY TECHNIQUE (USD BILLION) 2020-2029
TABLE 59 SOUTH KOREA NON-THERMAL PASTEURIZATION MARKET BY APPLICATION (USD BILLION) 2020-2029
TABLE 60 SOUTH KOREA NON-THERMAL PASTEURIZATION MARKET BY REGIONS (USD BILLION) 2020-2029
TABLE 61 AUSTRALIA NON-THERMAL PASTEURIZATION MARKET BY FOOD FORM (USD BILLION) 2020-2029
TABLE 62 AUSTRALIA NON-THERMAL PASTEURIZATION MARKET BY TECHNIQUE (USD BILLION) 2020-2029
TABLE 63 AUSTRALIA NON-THERMAL PASTEURIZATION MARKET BY APPLICATION (USD BILLION) 2020-2029
TABLE 64 AUSTRALIA NON-THERMAL PASTEURIZATION MARKET BY REGIONS (USD BILLION) 2020-2029
TABLE 65 SOUTH-EAST ASIA NON-THERMAL PASTEURIZATION MARKET BY FOOD FORM (USD BILLION) 2020-2029
TABLE 66 SOUTH-EAST ASIA NON-THERMAL PASTEURIZATION MARKET BY TECHNIQUE (USD BILLION) 2020-2029
TABLE 67 SOUTH-EAST ASIA NON-THERMAL PASTEURIZATION MARKET BY APPLICATION (USD BILLION) 2020-2029
TABLE 68 SOUTH-EAST ASIA NON-THERMAL PASTEURIZATION MARKET BY REGIONS (USD BILLION) 2020-2029
TABLE 69 REST OF ASIA PACIFIC NON-THERMAL PASTEURIZATION MARKET BY FOOD FORM (USD BILLION) 2020-2029
TABLE 70 REST OF ASIA PACIFIC NON-THERMAL PASTEURIZATION MARKET BY TECHNIQUE (USD BILLION) 2020-2029
TABLE 71 REST OF ASIA PACIFIC NON-THERMAL PASTEURIZATION MARKET BY APPLICATION (USD BILLION) 2020-2029
TABLE 72 REST OF ASIA PACIFIC NON-THERMAL PASTEURIZATION MARKET BY REGIONS (USD BILLION) 2020-2029
TABLE 73 EUROPE NON-THERMAL PASTEURIZATION MARKET BY FOOD FORM (USD BILLION) 2020-2029
TABLE 74 EUROPE NON-THERMAL PASTEURIZATION MARKET BY TECHNIQUE (USD BILLION) 2020-2029
TABLE 75 EUROPE NON-THERMAL PASTEURIZATION MARKET BY APPLICATION (USD BILLION) 2020-2029
TABLE 76 EUROPE NON-THERMAL PASTEURIZATION MARKET BY COUNTRY (USD BILLION) 2020-2029
TABLE 77 GERMANY NON-THERMAL PASTEURIZATION MARKET BY FOOD FORM (USD BILLION) 2020-2029
TABLE 78 GERMANY NON-THERMAL PASTEURIZATION MARKET BY TECHNIQUE (USD BILLION) 2020-2029
TABLE 79 GERMANY NON-THERMAL PASTEURIZATION MARKET BY APPLICATION (USD BILLION) 2020-2029
TABLE 80 GERMANY NON-THERMAL PASTEURIZATION MARKET BY REGIONS (USD BILLION) 2020-2029
TABLE 81 UK NON-THERMAL PASTEURIZATION MARKET BY FOOD FORM (USD BILLION) 2020-2029
TABLE 82 UK NON-THERMAL PASTEURIZATION MARKET BY TECHNIQUE (USD BILLION) 2020-2029
TABLE 83 UK NON-THERMAL PASTEURIZATION MARKET BY APPLICATION (USD BILLION) 2020-2029
TABLE 84 UK NON-THERMAL PASTEURIZATION MARKET BY REGIONS (USD BILLION) 2020-2029
TABLE 85 FRANCE NON-THERMAL PASTEURIZATION MARKET BY FOOD FORM (USD BILLION) 2020-2029
TABLE 86 FRANCE NON-THERMAL PASTEURIZATION MARKET BY TECHNIQUE (USD BILLION) 2020-2029
TABLE 87 FRANCE NON-THERMAL PASTEURIZATION MARKET BY APPLICATION (USD BILLION) 2020-2029
TABLE 88 FRANCE NON-THERMAL PASTEURIZATION MARKET BY REGIONS (USD BILLION) 2020-2029
TABLE 89 ITALY NON-THERMAL PASTEURIZATION MARKET BY FOOD FORM (USD BILLION) 2020-2029
TABLE 90 ITALY NON-THERMAL PASTEURIZATION MARKET BY TECHNIQUE (USD BILLION) 2020-2029
TABLE 91 ITALY NON-THERMAL PASTEURIZATION MARKET BY APPLICATION (USD BILLION) 2020-2029
TABLE 92 ITALY NON-THERMAL PASTEURIZATION MARKET BY REGIONS (USD BILLION) 2020-2029
TABLE 93 SPAIN NON-THERMAL PASTEURIZATION MARKET BY FOOD FORM (USD BILLION) 2020-2029
TABLE 94 SPAIN NON-THERMAL PASTEURIZATION MARKET BY TECHNIQUE (USD BILLION) 2020-2029
TABLE 95 SPAIN NON-THERMAL PASTEURIZATION MARKET BY APPLICATION (USD BILLION) 2020-2029
TABLE 96 SPAIN NON-THERMAL PASTEURIZATION MARKET BY REGIONS (USD BILLION) 2020-2029
TABLE 97 RUSSIA NON-THERMAL PASTEURIZATION MARKET BY FOOD FORM (USD BILLION) 2020-2029
TABLE 98 RUSSIA NON-THERMAL PASTEURIZATION MARKET BY TECHNIQUE (USD BILLION) 2020-2029
TABLE 99 RUSSIA NON-THERMAL PASTEURIZATION MARKET BY APPLICATION (USD BILLION) 2020-2029
TABLE 100 RUSSIA NON-THERMAL PASTEURIZATION MARKET BY REGIONS (USD BILLION) 2020-2029
TABLE 101 REST OF EUROPE NON-THERMAL PASTEURIZATION MARKET BY FOOD FORM (USD BILLION) 2020-2029
TABLE 102 REST OF EUROPE NON-THERMAL PASTEURIZATION MARKET BY TECHNIQUE (USD BILLION) 2020-2029
TABLE 103 REST OF EUROPE NON-THERMAL PASTEURIZATION MARKET BY APPLICATION (USD BILLION) 2020-2029
TABLE 104 REST OF EUROPE NON-THERMAL PASTEURIZATION MARKET BY REGIONS (USD BILLION) 2020-2029
TABLE 105 MIDDLE EAST AND AFRICA NON-THERMAL PASTEURIZATION MARKET BY FOOD FORM (USD BILLION) 2020-2029
TABLE 106 MIDDLE EAST AND AFRICA NON-THERMAL PASTEURIZATION MARKET BY TECHNIQUE (USD BILLION) 2020-2029
TABLE 107 MIDDLE EAST AND AFRICA NON-THERMAL PASTEURIZATION MARKET BY APPLICATION (USD BILLION) 2020-2029
TABLE 108 MIDDLE EAST AND AFRICA NON-THERMAL PASTEURIZATION MARKET BY COUNTRY (USD BILLION) 2020-2029
TABLE 109 UAE NON-THERMAL PASTEURIZATION MARKET BY FOOD FORM (USD BILLION) 2020-2029
TABLE 110 UAE NON-THERMAL PASTEURIZATION MARKET BY TECHNIQUE (USD BILLION) 2020-2029
TABLE 111 UAE NON-THERMAL PASTEURIZATION MARKET BY APPLICATION (USD BILLION) 2020-2029
TABLE 112 UAE NON-THERMAL PASTEURIZATION MARKET BY REGIONS (USD BILLION) 2020-2029
TABLE 113 SAUDI ARABIA NON-THERMAL PASTEURIZATION MARKET BY FOOD FORM (USD BILLION) 2020-2029
TABLE 114 SAUDI ARABIA NON-THERMAL PASTEURIZATION MARKET BY TECHNIQUE (USD BILLION) 2020-2029
TABLE 115 SAUDI ARABIA NON-THERMAL PASTEURIZATION MARKET BY APPLICATION (USD BILLION) 2020-2029
TABLE 116 SAUDI ARABIA NON-THERMAL PASTEURIZATION MARKET BY REGIONS (USD BILLION) 2020-2029
TABLE 117 SOUTH AFRICA NON-THERMAL PASTEURIZATION MARKET BY FOOD FORM (USD BILLION) 2020-2029
TABLE 118 SOUTH AFRICA NON-THERMAL PASTEURIZATION MARKET BY TECHNIQUE (USD BILLION) 2020-2029
TABLE 119 SOUTH AFRICA NON-THERMAL PASTEURIZATION MARKET BY APPLICATION (USD BILLION) 2020-2029
TABLE 120 SOUTH AFRICA NON-THERMAL PASTEURIZATION MARKET BY REGIONS (USD BILLION) 2020-2029
TABLE 121 REST OF MIDDLE EAST AND AFRICA NON-THERMAL PASTEURIZATION MARKET BY FOOD FORM (USD BILLION) 2020-2029
TABLE 122 REST OF MIDDLE EAST AND AFRICA NON-THERMAL PASTEURIZATION MARKET BY TECHNIQUE (USD BILLION) 2020-2029
TABLE 123 REST OF MIDDLE EAST AND AFRICA NON-THERMAL PASTEURIZATION MARKET BY APPLICATION (USD BILLION) 2020-2029
TABLE 124 REST OF MIDDLE EAST AND AFRICA NON-THERMAL PASTEURIZATION MARKET BY REGIONS (USD BILLION) 2020-2029
LIST OF FIGURES
FIGURE 1 MARKET DYNAMICS
FIGURE 2 MARKET SEGMENTATION
FIGURE 3 REPORT TIMELINES: YEARS CONSIDERED
FIGURE 4 DATA TRIANGULATION
FIGURE 5 BOTTOM-UP APPROACH
FIGURE 6 TOP-DOWN APPROACH
FIGURE 7 RESEARCH FLOW
FIGURE 8 GLOBAL NON-THERMAL PASTEURIZATION MARKET BY FOOD FORM (USD BILLION) 2020-2029
FIGURE 9 GLOBAL NON-THERMAL PASTEURIZATION MARKET BY TECHNIQUE (USD BILLION) 2020-2029
FIGURE 10 GLOBAL NON-THERMAL PASTEURIZATION MARKET BY APPLICATION (USD BILLION) 2020-2029
FIGURE 11 GLOBAL NON-THERMAL PASTEURIZATION MARKET BY REGION (USD BILLION) 2020-2029
FIGURE 12 PORTER’S FIVE FORCES MODEL
FIGURE 13 GLOBAL NON-THERMAL PASTEURIZATION MARKET BY FOOD FORM (USD BILLION) 2021
FIGURE 14 GLOBAL NON-THERMAL PASTEURIZATION MARKET BY TECHNIQUE (USD BILLION) 2021
FIGURE 15 GLOBAL NON-THERMAL PASTEURIZATION MARKET BY APPLICATION (USD BILLION) 2021
FIGURE 16 GLOBAL NON-THERMAL PASTEURIZATION MARKET BY REGION (USD BILLION) 2021
FIGURE 17 NORTH AMERICA NON-THERMAL PASTEURIZATION MARKET SNAPSHOT
FIGURE 18 EUROPE NON-THERMAL PASTEURIZATION MARKET SNAPSHOT
FIGURE 19 SOUTH AMERICA NON-THERMAL PASTEURIZATION MARKET SNAPSHOT
FIGURE 20 ASIA PACIFIC NON-THERMAL PASTEURIZATION MARKET SNAPSHOT
FIGURE 21 MIDDLE EAST ASIA AND AFRICA NON-THERMAL PASTEURIZATION MARKET SNAPSHOT
FIGURE 22 MARKET SHARE ANALYSIS
FIGURE 23 HIPERBARIC: COMPANY SNAPSHOT
FIGURE 24 AVURE TECHNOLOGIES: COMPANY SNAPSHOT
FIGURE 25 THYSSENKRUPP AG: COMPANY SNAPSHOT
FIGURE 26 DUKANE: COMPANY SNAPSHOT
FIGURE 27 CHIC FRESHERTECH: COMPANY SNAPSHOT
FIGURE 28 NORDION: COMPANY SNAPSHOT
FIGURE 29 ECOLAB INC.: COMPANY SNAPSHOT
FIGURE 30 BOSCH PACKAGING TECHNOLOGY: COMPANY SNAPSHOT
FIGURE 31 ELEA VERTRIEBS: COMPANY SNAPSHOT
FIGURE 32 JBT CORPORATION: COMPANY SNAPSHOT
FIGURE 33 GRAY STAR INC.: COMPANY SNAPSHOT
FIGURE 34 STANSTED FLUID POWER LTD.: COMPANY SNAPSHOT
FIGURE 35 UNIVERSAL PURE: COMPANY SNAPSHOT
FIGURE 36 PULSEMASTER BV: COMPANY SNAPSHOT
FIGURE 37 PUREPULSE TECHNOLOGIES: COMPANY SNAPSHOT
DOWNLOAD FREE SAMPLE REPORT
License Type
SPEAK WITH OUR ANALYST
Want to know more about the report or any specific requirement?
WANT TO CUSTOMIZE THE REPORT?
Our Clients Speak
We asked them to research ‘ Equipment market’ all over the world, and their whole arrangement was helpful to us. thehealthanalytics.com insightful analysis and reports contributed to our current analysis and in creating a future strategy. Besides, the te
Yosuke Mitsui
Senior Associate Construction Equipment Sales & Marketing
We asked them to research ‘Equipment market’ all over the world, and their whole arrangement was helpful to us. thehealthanalytics.com insightful analysis and reports contributed to our current analysis and in creating a future strategy. Besides, the te


