

Base Year Value ()
x.x %
x.x %
CAGR ()
x.x %
x.x %
Forecast Year Value ()
x.x %
x.x %
Historical Data Period
Largest Region
Forecast Period
Mercado de biosurfactantes por tipo (glicolípidos, lipopéptidos y lipoproteínas, fosfolípidos, poliméricos, otros), aplicación (cuidado personal, limpiadores y detergentes industriales, procesamiento de alimentos, industria petrolera, productos químicos agrícolas, otros) y por región Tendencias globales y pronóstico de 2022 a 2029
Instant access to hundreds of data points and trends
- Market estimates from 2014-2029
- Competitive analysis, industry segmentation, financial benchmarks
- Incorporates SWOT, Porter's Five Forces and risk management frameworks
- PDF report or online database with Word, Excel and PowerPoint export options
- 100% money back guarantee
Descripción general del mercado de biosurfactantes
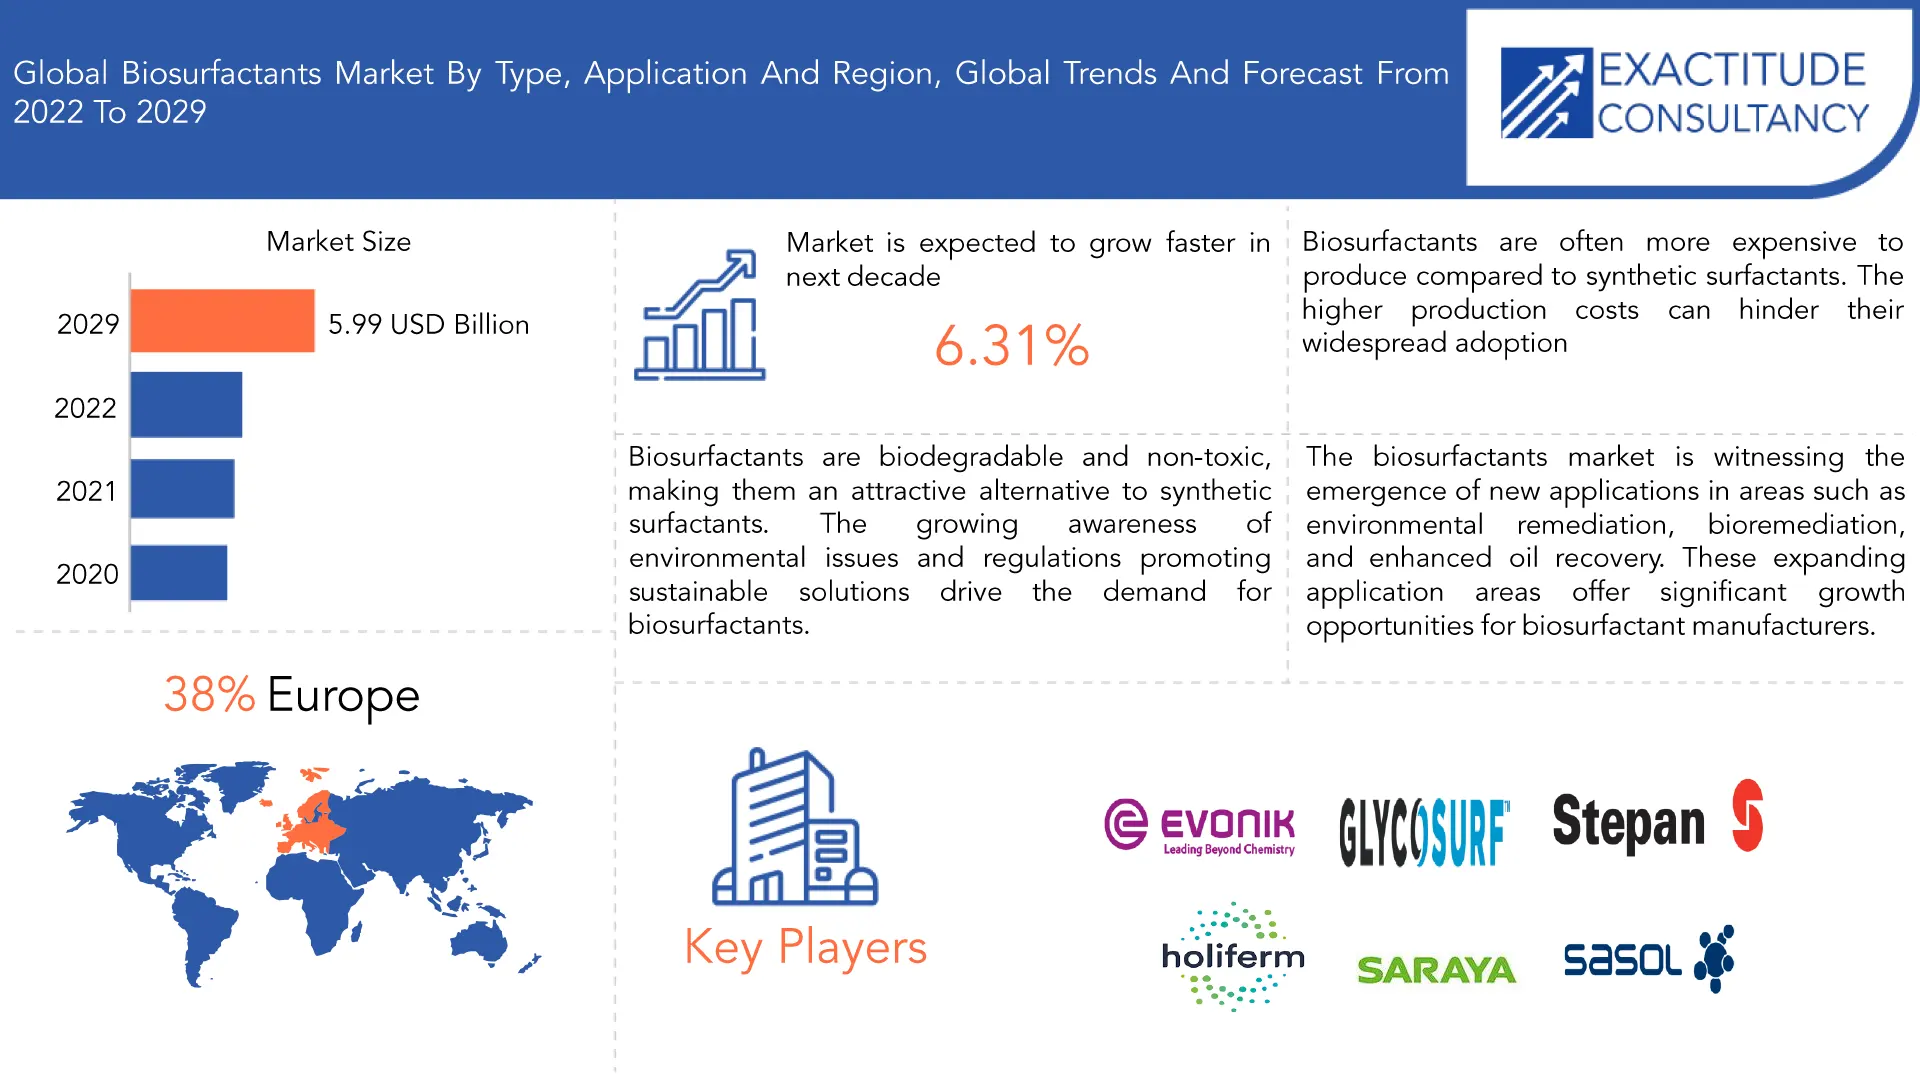
Se proyecta que el mercado mundial de biosurfactantes alcance los 5.990 millones de dólares en 2029, desde los 3.730 millones de dólares en 2020, con una CAGR del 6,31 % entre 2022 y 2029.
Los biosurfactantes también se conocen como surfactantes microbianos. Los biosurfactantes son sustancias químicas anfifílicas. Se trata de biomoléculas activas de superficie generadas por microbios con características ambientales únicas. Los detergentes, agentes humectantes, agentes espumantes y emulsionantes son ejemplos adicionales de biosurfactantes. Los biosurfactantes pueden reemplazar prácticamente cualquier surfactante sintético al tiempo que ofrecen nuevas características fisicoquímicas. Los clientes se sienten atraídos por los biosurfactantes debido a sus cualidades distintivas, como baja toxicidad, precisión, alta biodegradabilidad , capacidades antibacterianas, antifúngicas y antivirales. Los biosurfactantes mejoran el área superficial de los sustratos insolubles en agua hidrófobos utilizados por los organismos para el crecimiento y son útiles en los procesos de biodegradación, biorremediación y biocontrol.
Los biosurfactantes se están eliminando gradualmente debido a los diferentes peligros para la salud asociados con el uso de productos químicos sintéticos . Los biosurfactantes se emplean en una amplia variedad de aplicaciones agrícolas debido a sus características, como emulsificación, formación de espuma, dispersión, humectación, penetración, espesamiento, estimulación del crecimiento microbiano y antimicrobianos. Los biosurfactantes son surfactantes verdes que a menudo son generados por bacterias, levaduras y hongos. Se emplean en aplicaciones agrícolas porque son menos dañinos y mejores para el medio ambiente. La remediación del suelo emplea biosurfactantes para mejorar la calidad del suelo. Funcionan como agentes movilizadores, aumentando la solubilidad de sustancias químicas que plantean un riesgo biológico.
Se prevé que la creciente demanda de biosurfactantes en una variedad de aplicaciones, como jabones y detergentes, productos de cuidado personal y limpieza industrial, mejore las perspectivas de la industria. La conciencia de los consumidores sobre las opciones ecológicas en productos de cuidado personal y cosméticos impulsará la demanda del mercado durante el período proyectado. Debido a sus cualidades ecológicas, no tóxicas y biodegradables, el sector está prosperando. El mercado mundial de biosurfactantes está creciendo debido a una serie de variables microeconómicas y macroeconómicas. La creciente demanda del sector textil es uno de los principales impulsores de la expansión del mercado.
[título id="attachment_26084" align="aligncenter" width="1920"]
La capacidad de los biosurfactantes de penetrar en los tejidos explica el aumento de su demanda en la industria textil. Los biosurfactantes tienen la capacidad de producir micelas, que luego pueden interactuar con el agua y el aceite. Esta interacción ayuda a eliminar manchas difíciles y profundas de la ropa causadas por chocolate, té, ceras, aceites y otras sustancias. Además, el mercado mundial de biosurfactantes se está viendo favorecido por un aumento de la demanda de jabones y detergentes para el hogar, ya que las personas optan por un mejor estilo de vida. Como estas emulsiones incluyen aceites esenciales y antioxidantes naturales, son más adecuadas para los cosméticos orgánicos.
Los altos costos de fabricación que experimentan los productores de biosurfactantes son uno de los principales factores que limitan el crecimiento del mercado de biosurfactantes. Debido al alto costo inicial, no se ha llevado a cabo la producción a escala industrial de biosurfactantes. Las condiciones ambientales juegan un papel crucial en la generación y las propiedades de los biosurfactantes. Se prevé que la escasez de materias primas y los precios excesivos obstaculicen la expansión del mercado. El alto costo de fabricación de los surfactantes químicos tradicionales y los surfactantes de base biológica es un factor clave que restringe el crecimiento del mercado global de biosurfactantes.
Los biosurfactantes son compuestos tensioactivos producidos por microorganismos que ofrecen una alternativa sostenible y ecológica a los surfactantes convencionales derivados de fuentes petroquímicas. Este mercado en auge está impulsado por varios factores, incluida la creciente demanda de soluciones ecológicas y biodegradables en industrias como la cosmética, la farmacéutica, la agricultura y el petróleo y el gas. Los biosurfactantes presentan propiedades notables, que incluyen baja toxicidad, alta biodegradabilidad y excelente rendimiento en diversas aplicaciones, como emulsificación, detergencia, formación de espuma y humectación. Además, poseen características únicas como propiedades antimicrobianas y antiadherentes, lo que los hace ideales para aplicaciones en productos de cuidado personal y sanitario.
| ATRIBUTO | DETALLES |
| Periodo de estudio | 2022-2029 |
| Año base | 2022 |
| Año estimado | 2023 |
| Año pronosticado | 2023-2029 |
| Periodo histórico | 2018-2022 |
| Unidad | Valor (miles de millones de USD) Volumen (kilotones) |
| Segmentación | Por tipo, por aplicación, por región |
| Por producto |
|
| Por aplicación |
|
| Por región |
|
Frequently Asked Questions
• What is the worth of the biosurfactants market?
The global biosurfactants market is projected to reach USD 5.99 billion by 2029 from USD 3.73 billion in 2020, at a CAGR of 6.31 % from 2022 to 2029.
• What is the share of the Europe biosurfactants industry?
Europe dominates the biosurfactants market, with a market share of over 38%.
• Which are the top companies to hold the market share in the biosurfactants market?
Jeneil, Evonik Industries, AGAE Technologies, Glycosurf, Tensiogreen, Stepan Company, Holiferm, Saraya Co., Soliance, Sasol Chemicals, Solvay are among the leading players in the global biosurfactants market.
• What is the CAGR of biosurfactants market?
The global biosurfactants market registered a CAGR of 6.31 % from 2022 to 2029.
• What are the key factors driving the market?
Growing consumer awareness of environmentally friendly and sustainable product alternatives, emerging trends and novel strategies related to biosurfactant manufacturing or industrial production processes, and increased demand from end-use industries are key factors driving the global biosurfactants market's growth.
Biosurfactants Market Segment Analysis
The global biosurfactants market is segmented by type, application and region.
Based on type, the biosurfactants market is segmented into glycolipids, lipopeptides & lipoproteins, phospholipids, polymeric, others. The glycolipid surfactant category accounted for a sizable sales share in 2021. Glycolipids are the most extensively researched low-molecular-weight biosurfactants derived from hydrocarbons and industrial waste. Due to their capacity to diminish surface and interfacial tension and their substantial participation in disrupting biological membranes via the formation of ion channels and holes, glycolipids have been discovered to be particularly efficient against bacteria, viruses, mycoplasma, and fungus. Glycolipids regulate enzyme activity by activating or inhibiting enzymes in a variety of biotechnological processes. They're also used in cosmetics due to their ability to moisturize and anti-adhesive characteristics, which keep microbes from adhering to them.
Rhamnolipids (RLs) are surface-active chemicals that are a kind of glycolipid biosurfactant produced largely by Pseudomonas aeruginosa. Due to their non-toxicity, excellent biodegradability, low surface tension, and low inhibitory concentration values, they have uses in the food, healthcare, pharmaceutical, and petrochemical sectors. Rhamnolipids are effective therapeutic ingredients due to their ecologically friendly biological properties.
Based on application, the biosurfactants market is classified into personal care, industrial cleaners & detergents, food processing, oilfield industry, agriculture chemicals, others. The personal care category had the highest revenue share in 2021. Increasing demand from the skincare and cosmetics sectors is a major element driving this segment's growth. Biosurfactants have showed significant promise in terms of low toxicity, biocompatibility, skin protection, and surface moisturizing, all of which are crucial components of an effective skincare regimen. Furthermore, biosurfactants offer important physiochemical properties that are essential for skin health care.
The industrial cleansers and detergents industry is predicted to have substantial growth in revenue during the forecasted period. They reduce the surface tension of two normally unmixable liquids, allowing them to blend. Microorganisms in bio-enzymatic cleaner may degrade oil molecules when two solutions are mixed together, assisting in stain elimination. Furthermore, biosurfactants in bio-enzymatic cleansers, such as conventional cleaners without bacteria, can break up stains and lift them off a surface in the same way as synthetic surfactants do, making stain removal simpler.
[caption id="attachment_26088" align="aligncenter" width="1920"]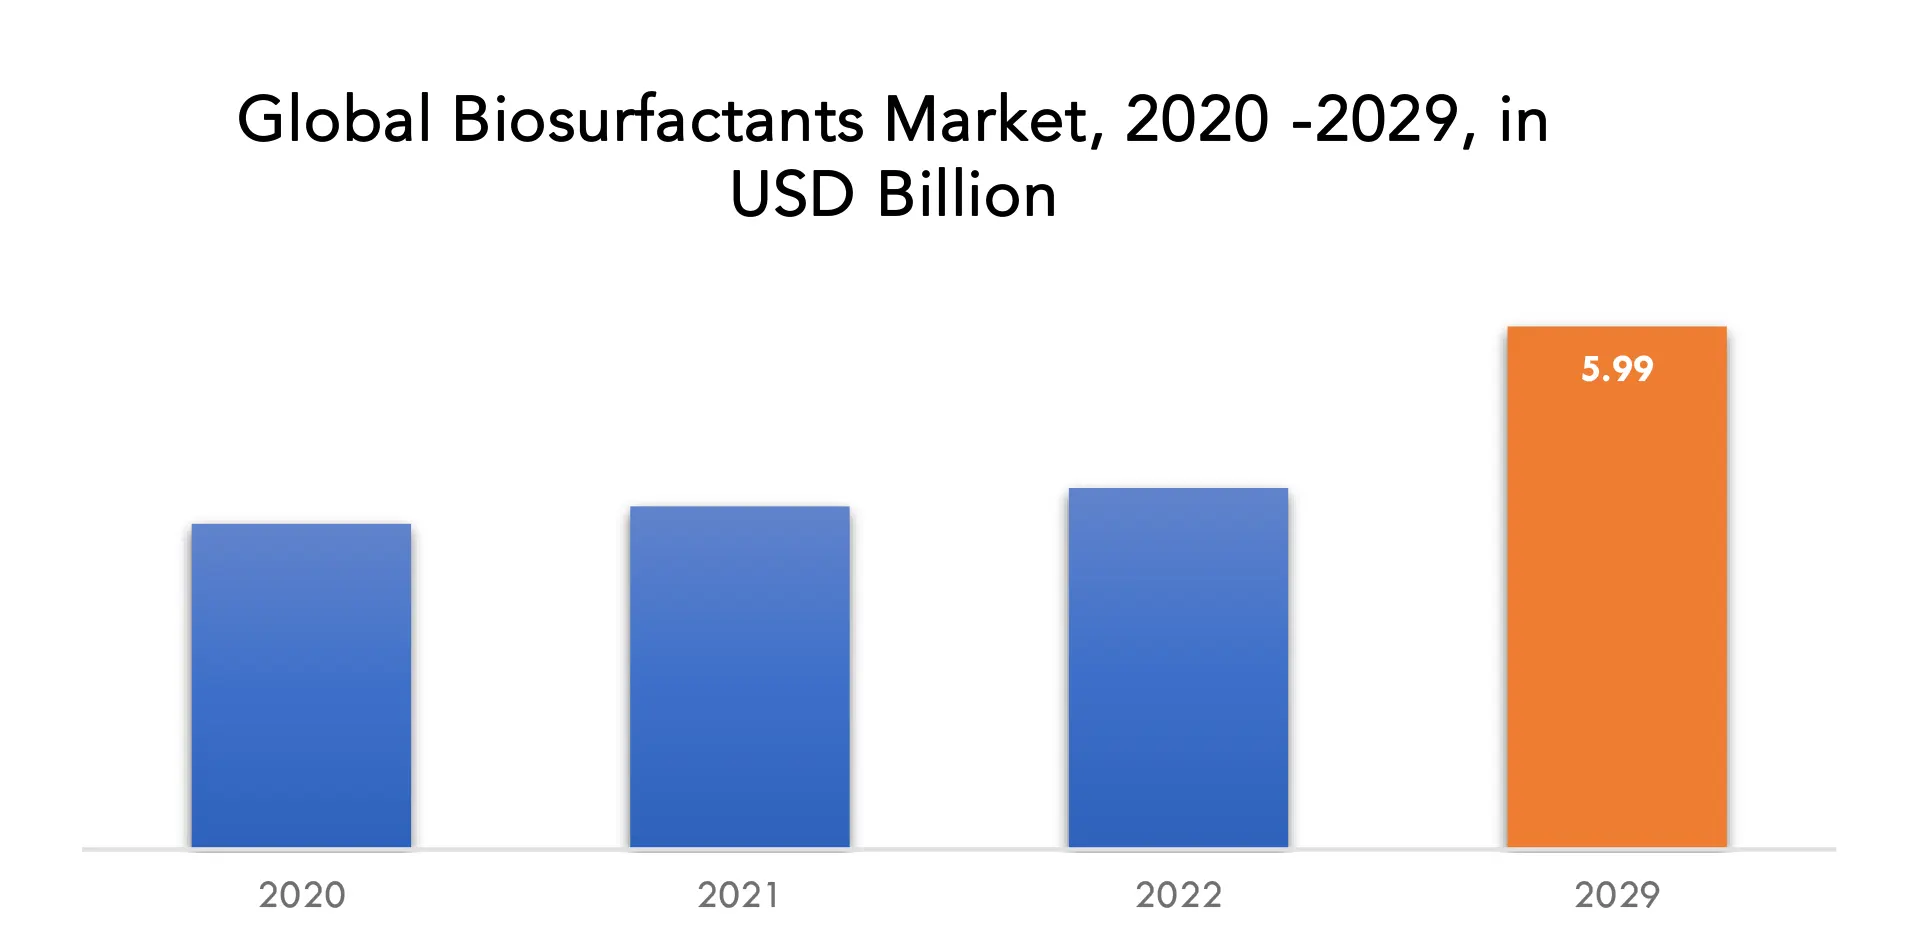
Biosurfactants Market Players
The global biosurfactants market key players include Jeneil, Evonik Industries, AGAE Technologies, Glycosurf, Tensiogreen, Stepan Company, Holiferm, Saraya Co., Soliance, Sasol Chemicals, Solvay.
25 January, 2023: Holiferm Limited and Sasol Chemicals, a business unit of Sasol Ltd. (JSE: SOL; NYSE: SSL), announced a collaboration to produce and market rhamnolipids and mannosylerythritol lipids (MELs). Jun 14, 2022: Solvay, a leading supplier of cosmetic ingredients, introduced Mirasoft® SL L60 and Mirasoft® SL A60 - two new high-performance biosurfactants that enable the development of sustainable beauty care products.Who Should Buy? Or Key stakeholders
- Manufacturers and suppliers of biosurfactants
- Industries and sectors using surfactants
- Research institutions and academia
- Regulatory agencies and policymakers
- Environmental and sustainability organizations
- Investors and financial institutions
- End-users and consumers
- Trade associations and industry groups
- Consultants and market research firms
Biosurfactants Market Regional Analysis
The biosurfactants market by region includes North America, Asia-Pacific (APAC), Europe, South America, and Middle East & Africa (MEA).- North America: includes the US, Canada, Mexico
- Asia Pacific: includes China, Japan, South Korea, India, Australia, ASEAN and Rest of APAC
- Europe: includes UK, Germany, France, Italy, Spain, Russia, and Rest of Europe
- South America: includes Brazil, Argentina and Rest of South America
- Middle East & Africa: includes Turkey, UAE, Saudi Arabia, South Africa, and Rest of MEA
Europe will have the highest revenue share in 2021. The main factors driving market expansion in this area is an increase in R&D efforts and government-funded research programmers in the field of green surfactants. Furthermore, increased manufacturer knowledge of the usage of green surfactant alternatives to minimize carbon output is likely to fuel market expansion. Waste2Func, a BBI-JU-funded European project, has been awarded EURO 6.7 million to develop a technology platform that will collect waste from farmers, food production, supermarkets, auctions, and restaurants and ferment and purify it into lactic acid and biosurfactants for use in cosmetics, personal care, and household care products. Furthermore, as regulatory requirements tighten, biosurfactants are becoming more commonly regarded as a viable alternative to synthetic surfactants, which is expected to boost market expansion.
The Asia Pacific market will account for the second greatest revenue share in 2021.Given its lower surface area and interfacial tension of immiscible fluids, which enhances solubility and sorption of hydrophobic pesticide contaminants, the biosurfactant market is growing in this region, particularly in India, Japan, and China. Furthermore, the pesticide industry commonly uses them as an emulsifiable concentrate in pesticide formulations. In 2021, the North American market accounted for the third-largest revenue share. The growing presence of significant industry participants and others is driving market expansion in this area.
[caption id="attachment_26089" align="aligncenter" width="1920"]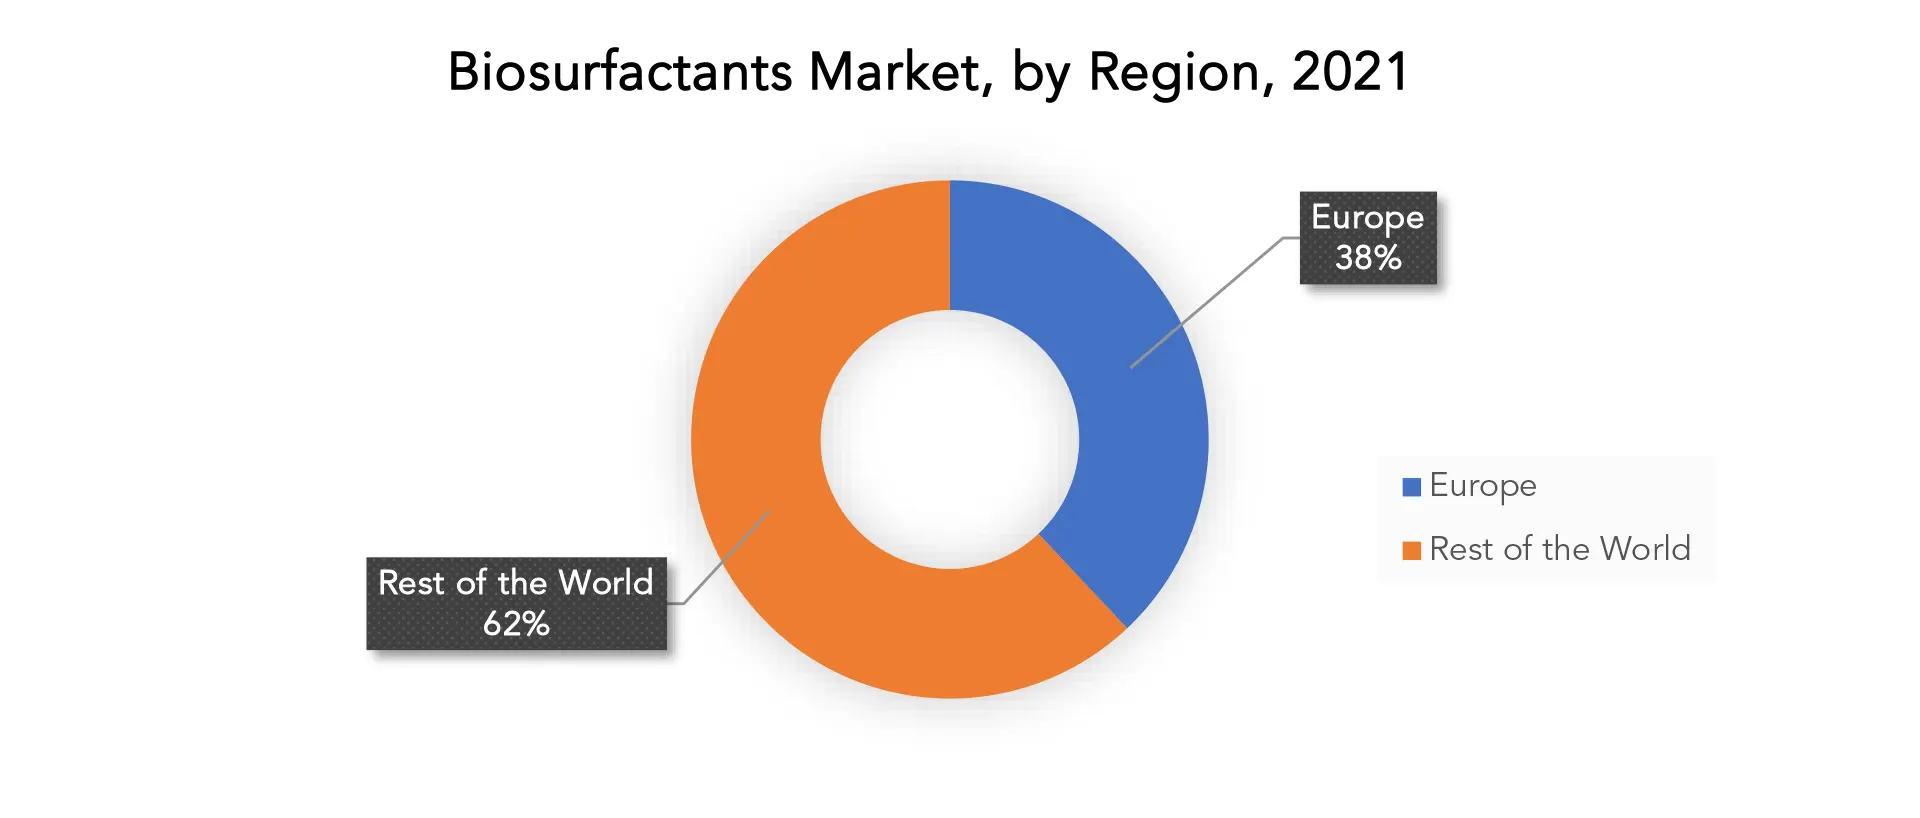
Key Market Segments: Biosurfactants Market
Biosurfactants Market by Type 2022-2029, (USD Billion) (Kilotons)- Glycolipids
- Lipopeptides & Lipoproteins
- Phospholipids
- Polymeric
- Others
- Personal Care
- Industrial Cleaners & Detergents
- Food Processing
- Oilfield Industry
- Agriculture Chemicals
- Others
- North America
- Europe
- Asia Pacific
- South America
- Middle East and Africa
Exactitude Consultancy Services Key Objectives:
- Increasing sales and market share
- Developing new technology
- Improving profitability
- Entering new markets
- Enhancing brand reputation
Key Question Answered
- What is the expected growth rate of the biosurfactants market over the next 7 years?
- Who are the major players in the biosurfactants market and what is their market share?
- What are the end-user industries driving demand for market and what is their outlook?
- What are the opportunities for growth in emerging markets such as Asia-Pacific, Middle East, and Africa?
- How is the economic environment affecting the biosurfactants market, including factors such as interest rates, inflation, and exchange rates?
- What is the expected impact of government policies and regulations on the biosurfactants market?
- What is the current and forecasted size and growth rate of the global biosurfactants market?
- What are the key drivers of growth in the biosurfactants market?
- What are the distribution channels and supply chain dynamics in the biosurfactants market?
- What are the technological advancements and innovations in the biosurfactants market and their impact on product development and growth?
- What are the regulatory considerations and their impact on the market?
- What are the challenges faced by players in the biosurfactants market and how are they addressing these challenges?
- What are the opportunities for growth and expansion in the biosurfactants market?
- What are the product offerings and specifications of leading players in the market?
- What is the pricing trend of biosurfactants in the market and what is the impact of raw material prices on the price trend?
- INTRODUCCIÓN
- DEFINICIÓN DE MERCADO
- SEGMENTACIÓN DEL MERCADO
- CRONOGRAMAS DE INVESTIGACIÓN
- SUPUESTOS Y LIMITACIONES
- METODOLOGÍA DE LA INVESTIGACIÓN
- MINERÍA DE DATOS
- INVESTIGACIÓN SECUNDARIA
- INVESTIGACIÓN PRIMARIA
- ASESORAMIENTO DE EXPERTOS EN LA MATERIA
- CONTROLES DE CALIDAD
- REVISIÓN FINAL
- TRIANGULACIÓN DE DATOS
- ENFOQUE DE ABAJO HACIA ARRIBA
- ENFOQUE DE ARRIBA HACIA ABAJO
- FLUJO DE INVESTIGACIÓN
- FUENTES DE DATOS
- MINERÍA DE DATOS
- RESUMEN EJECUTIVO
- PANORAMA DEL MERCADO
- PERSPECTIVAS DEL MERCADO MUNDIAL DE BIOSURFACTANTES
- IMPULSORES DEL MERCADO
- RESTRICCIONES DEL MERCADO
- OPORTUNIDADES DE MERCADO
- IMPACT OF COVID-19 ON BIOSURFACTANTS MARKET
- PORTER’S FIVE FORCES MODEL
- THREAT FROM NEW ENTRANTS
- THREAT FROM SUBSTITUTES
- BARGAINING POWER OF SUPPLIERS
- BARGAINING POWER OF CUSTOMERS
- DEGREE OF COMPETITION
- INDUSTRY VALUE CHAIN ANALYSIS
- PERSPECTIVAS DEL MERCADO MUNDIAL DE BIOSURFACTANTES
- GLOBAL BIOSURFACTANTS MARKET BY TYPE, 2020-2029, (USD BILLION) (KILOTONS)
- GLYCOLIPIDS
- LIPOPEPTIDES & LIPOPROTEINS
- PHOSPHOLIPIDS
- POLYMERIC
- OTHERS
- GLOBAL BIOSURFACTANTS MARKET BY APPLICATION, 2020-2029, (USD BILLION) (KILOTONS)
- PERSONAL CARE
- INDUSTRIAL CLEANERS & DETERGENTS
- FOOD PROCESSING
- OILFIELD INDUSTRY
- AGRICULTURE CHEMICALS
- OTHERS
- GLOBAL BIOSURFACTANTS MARKET BY REGION, 2020-2029, (USD BILLION) (KILOTONS)
- NORTH AMERICA
- US
- CANADA
- MEXICO
- SOUTH AMERICA
- BRAZIL
- ARGENTINA
- COLOMBIA
- REST OF SOUTH AMERICA
- EUROPE
- GERMANY
- UK
- FRANCE
- ITALY
- SPAIN
- RUSSIA
- REST OF EUROPE
- ASIA PACIFIC
- INDIA
- CHINA
- JAPAN
- SOUTH KOREA
- AUSTRALIA
- SOUTH-EAST ASIA
- REST OF ASIA PACIFIC
- MIDDLE EAST AND AFRICA
- UAE
- SAUDI ARABIA
- SOUTH AFRICA
- REST OF MIDDLE EAST AND AFRICA
- NORTH AMERICA
- COMPANY PROFILES*(BUSINESS OVERVIEW, COMPANY SNAPSHOT, PRODUCT OFFERED, RECENT DEVELOPMENTS)
- JENEIL
- EVONIK INDUSTRIES
- AGAE TECHNOLOGIES
- GLYCOSURF
- TENSIOGREEN
- STEPAN COMPANY
- HOLIFERM
- SARAYA CO.
- SOLIANCE
- SASOL CHEMICALS
- SOLVAY*THE COMPANY LIST IS INDICATIVE
LIST OF TABLES
TABLE 1 GLOBAL BIOSURFACTANTS MARKET BY TYPE (USD BILLION) 2020-2029
TABLE 2 GLOBAL BIOSURFACTANTS MARKET BY TYPE (KILOTONS) 2020-2029
TABLE 3 GLOBAL BIOSURFACTANTS MARKET BY APPLICATION (USD BILLION) 2020-2029
TABLE 4 GLOBAL BIOSURFACTANTS MARKET BY APPLICATION (KILOTONS) 2020-2029
TABLE 5 GLOBAL BIOSURFACTANTS MARKET BY REGION (USD BILLION) 2020-2029
TABLE 6 GLOBAL BIOSURFACTANTS MARKET BY REGION (KILOTONS) 2020-2029
TABLE 7 NORTH AMERICA BIOSURFACTANTS MARKET BY COUNTRY (USD BILLION) 2020-2029
TABLE 8 NORTH AMERICA BIOSURFACTANTS MARKET BY COUNTRY (KILOTONS) 2020-2029
TABLE 9 NORTH AMERICA BIOSURFACTANTS MARKET BY TYPE (USD BILLION) 2020-2029
TABLE 10 NORTH AMERICA BIOSURFACTANTS MARKET BY TYPE (KILOTONS) 2020-2029
TABLE 11 NORTH AMERICA BIOSURFACTANTS MARKET BY APPLICATION (USD BILLION) 2020-2029
TABLE 12 NORTH AMERICA BIOSURFACTANTS MARKET BY APPLICATION (KILOTONS) 2020-2029
TABLE 13 US BIOSURFACTANTS MARKET BY TYPE (USD BILLION) 2020-2029
TABLE 14 US BIOSURFACTANTS MARKET BY TYPE (KILOTONS) 2020-2029
TABLE 15 US BIOSURFACTANTS MARKET BY APPLICATION (USD BILLION) 2020-2029
TABLE 16 US BIOSURFACTANTS MARKET BY APPLICATION (KILOTONS) 2020-2029
TABLE 17 CANADA BIOSURFACTANTS MARKET BY TYPE (USD BILLION) 2020-2029
TABLE 18 CANADA BIOSURFACTANTS MARKET BY TYPE (KILOTONS) 2020-2029
TABLE 19 CANADA BIOSURFACTANTS MARKET BY APPLICATION (USD BILLION) 2020-2029
TABLE 20 CANADA BIOSURFACTANTS MARKET BY APPLICATION (KILOTONS) 2020-2029
TABLE 21 MEXICO BIOSURFACTANTS MARKET BY TYPE (USD BILLION) 2020-2029
TABLE 22 MEXICO BIOSURFACTANTS MARKET BY TYPE (KILOTONS) 2020-2029
TABLE 23 MEXICO BIOSURFACTANTS MARKET BY APPLICATION (USD BILLION) 2020-2029
TABLE 24 MEXICO BIOSURFACTANTS MARKET BY APPLICATION (KILOTONS) 2020-2029
TABLE 25 SOUTH AMERICA BIOSURFACTANTS MARKET BY COUNTRY (USD BILLION) 2020-2029
TABLE 26 SOUTH AMERICA BIOSURFACTANTS MARKET BY COUNTRY (KILOTONS) 2020-2029
TABLE 27 SOUTH AMERICA BIOSURFACTANTS MARKET BY TYPE (USD BILLION) 2020-2029
TABLE 28 SOUTH AMERICA BIOSURFACTANTS MARKET BY TYPE (KILOTONS) 2020-2029
TABLE 29 SOUTH AMERICA BIOSURFACTANTS MARKET BY APPLICATION (USD BILLION) 2020-2029
TABLE 30 SOUTH AMERICA BIOSURFACTANTS MARKET BY APPLICATION (KILOTONS) 2020-2029
TABLE 31 BRAZIL BIOSURFACTANTS MARKET BY TYPE (USD BILLION) 2020-2029
TABLE 32 BRAZIL BIOSURFACTANTS MARKET BY TYPE (KILOTONS) 2020-2029
TABLE 33 BRAZIL BIOSURFACTANTS MARKET BY APPLICATION (USD BILLION) 2020-2029
TABLE 34 BRAZIL BIOSURFACTANTS MARKET BY APPLICATION (KILOTONS) 2020-2029
TABLE 35 ARGENTINA BIOSURFACTANTS MARKET BY TYPE (USD BILLION) 2020-2029
TABLE 36 ARGENTINA BIOSURFACTANTS MARKET BY TYPE (KILOTONS) 2020-2029
TABLE 37 ARGENTINA BIOSURFACTANTS MARKET BY APPLICATION (USD BILLION) 2020-2029
TABLE 38 ARGENTINA BIOSURFACTANTS MARKET BY APPLICATION (KILOTONS) 2020-2029
TABLE 39 COLOMBIA BIOSURFACTANTS MARKET BY TYPE (USD BILLION) 2020-2029
TABLE 40 COLOMBIA BIOSURFACTANTS MARKET BY TYPE (KILOTONS) 2020-2029
TABLE 41 COLOMBIA BIOSURFACTANTS MARKET BY APPLICATION (USD BILLION) 2020-2029
TABLE 42 COLOMBIA BIOSURFACTANTS MARKET BY APPLICATION (KILOTONS) 2020-2029
TABLE 43 REST OF SOUTH AMERICA BIOSURFACTANTS MARKET BY TYPE (USD BILLION) 2020-2029
TABLE 44 REST OF SOUTH AMERICA BIOSURFACTANTS MARKET BY TYPE (KILOTONS) 2020-2029
TABLE 45 REST OF SOUTH AMERICA BIOSURFACTANTS MARKET BY APPLICATION (USD BILLION) 2020-2029
TABLE 46 REST OF SOUTH AMERICA BIOSURFACTANTS MARKET BY APPLICATION (KILOTONS) 2020-2029
TABLE 47 ASIA-PACIFIC BIOSURFACTANTS MARKET BY COUNTRY (USD BILLION) 2020-2029
TABLE 48 ASIA-PACIFIC BIOSURFACTANTS MARKET BY COUNTRY (KILOTONS) 2020-2029
TABLE 49 ASIA-PACIFIC BIOSURFACTANTS MARKET BY TYPE (USD BILLION) 2020-2029
TABLE 50 ASIA-PACIFIC BIOSURFACTANTS MARKET BY TYPE (KILOTONS) 2020-2029
TABLE 51 ASIA-PACIFIC BIOSURFACTANTS MARKET BY APPLICATION (USD BILLION) 2020-2029
TABLE 52 ASIA-PACIFIC BIOSURFACTANTS MARKET BY APPLICATION (KILOTONS) 2020-2029
TABLE 53 INDIA BIOSURFACTANTS MARKET BY TYPE (USD BILLION) 2020-2029
TABLE 54 INDIA BIOSURFACTANTS MARKET BY TYPE (KILOTONS) 2020-2029
TABLE 55 INDIA BIOSURFACTANTS MARKET BY APPLICATION (USD BILLION) 2020-2029
TABLE 56 INDIA BIOSURFACTANTS MARKET BY APPLICATION (KILOTONS) 2020-2029
TABLE 57 CHINA BIOSURFACTANTS MARKET BY TYPE (USD BILLION) 2020-2029
TABLE 58 CHINA BIOSURFACTANTS MARKET BY TYPE (KILOTONS) 2020-2029
TABLE 59 CHINA BIOSURFACTANTS MARKET BY APPLICATION (USD BILLION) 2020-2029
TABLE 60 CHINA BIOSURFACTANTS MARKET BY APPLICATION (KILOTONS) 2020-2029
TABLE 61 JAPAN BIOSURFACTANTS MARKET BY TYPE (USD BILLION) 2020-2029
TABLE 62 JAPAN BIOSURFACTANTS MARKET BY TYPE (KILOTONS) 2020-2029
TABLE 63 JAPAN BIOSURFACTANTS MARKET BY APPLICATION (USD BILLION) 2020-2029
TABLE 64 JAPAN BIOSURFACTANTS MARKET BY APPLICATION (KILOTONS) 2020-2029
TABLE 65 SOUTH KOREA BIOSURFACTANTS MARKET BY TYPE (USD BILLION) 2020-2029
TABLE 66 SOUTH KOREA BIOSURFACTANTS MARKET BY TYPE (KILOTONS) 2020-2029
TABLE 67 SOUTH KOREA BIOSURFACTANTS MARKET BY APPLICATION (USD BILLION) 2020-2029
TABLE 68 SOUTH KOREA BIOSURFACTANTS MARKET BY APPLICATION (KILOTONS) 2020-2029
TABLE 69 AUSTRALIA BIOSURFACTANTS MARKET BY TYPE (USD BILLION) 2020-2029
TABLE 70 AUSTRALIA BIOSURFACTANTS MARKET BY TYPE (KILOTONS) 2020-2029
TABLE 71 AUSTRALIA BIOSURFACTANTS MARKET BY APPLICATION (USD BILLION) 2020-2029
TABLE 72 AUSTRALIA BIOSURFACTANTS MARKET BY APPLICATION (KILOTONS) 2020-2029
TABLE 73 SOUTH-EAST ASIA BIOSURFACTANTS MARKET BY TYPE (USD BILLION) 2020-2029
TABLE 74 SOUTH-EAST ASIA BIOSURFACTANTS MARKET BY TYPE (KILOTONS) 2020-2029
TABLE 75 SOUTH-EAST ASIA BIOSURFACTANTS MARKET BY APPLICATION (USD BILLION) 2020-2029
TABLE 76 SOUTH-EAST ASIA BIOSURFACTANTS MARKET BY APPLICATION (KILOTONS) 2020-2029
TABLE 77 REST OF ASIA PACIFIC BIOSURFACTANTS MARKET BY TYPE (USD BILLION) 2020-2029
TABLE 78 REST OF ASIA PACIFIC BIOSURFACTANTS MARKET BY TYPE (KILOTONS) 2020-2029
TABLE 79 REST OF ASIA PACIFIC BIOSURFACTANTS MARKET BY APPLICATION (USD BILLION) 2020-2029
TABLE 80 REST OF ASIA PACIFIC BIOSURFACTANTS MARKET BY APPLICATION (KILOTONS) 2020-2029
TABLE 81 EUROPE BIOSURFACTANTS MARKET BY COUNTRY (USD BILLION) 2020-2029
TABLE 82 EUROPE BIOSURFACTANTS MARKET BY COUNTRY (KILOTONS) 2020-2029
TABLE 83 EUROPE BIOSURFACTANTS MARKET BY TYPE (USD BILLION) 2020-2029
TABLE 84 EUROPE BIOSURFACTANTS MARKET BY TYPE (KILOTONS) 2020-2029
TABLE 85 EUROPE BIOSURFACTANTS MARKET BY APPLICATION (USD BILLION) 2020-2029
TABLE 86 EUROPE BIOSURFACTANTS MARKET BY APPLICATION (KILOTONS) 2020-2029
TABLE 87 GERMANY BIOSURFACTANTS MARKET BY TYPE (USD BILLION) 2020-2029
TABLE 88 GERMANY BIOSURFACTANTS MARKET BY TYPE (KILOTONS) 2020-2029
TABLE 89 GERMANY BIOSURFACTANTS MARKET BY APPLICATION (USD BILLION) 2020-2029
TABLE 90 GERMANY BIOSURFACTANTS MARKET BY APPLICATION (KILOTONS) 2020-2029
TABLE 91 UK BIOSURFACTANTS MARKET BY TYPE (USD BILLION) 2020-2029
TABLE 92 UK BIOSURFACTANTS MARKET BY TYPE (KILOTONS) 2020-2029
TABLE 93 UK BIOSURFACTANTS MARKET BY APPLICATION (USD BILLION) 2020-2029
TABLE 94 UK BIOSURFACTANTS MARKET BY APPLICATION (KILOTONS) 2020-2029
TABLE 95 FRANCE BIOSURFACTANTS MARKET BY TYPE (USD BILLION) 2020-2029
TABLE 96 FRANCE BIOSURFACTANTS MARKET BY TYPE (KILOTONS) 2020-2029
TABLE 97 FRANCE BIOSURFACTANTS MARKET BY APPLICATION (USD BILLION) 2020-2029
TABLE 98 FRANCE BIOSURFACTANTS MARKET BY APPLICATION (KILOTONS) 2020-2029
TABLE 99 ITALY BIOSURFACTANTS MARKET BY TYPE (USD BILLION) 2020-2029
TABLE 100 ITALY BIOSURFACTANTS MARKET BY TYPE (KILOTONS) 2020-2029
TABLE 101 ITALY BIOSURFACTANTS MARKET BY APPLICATION (USD BILLION) 2020-2029
TABLE 102 ITALY BIOSURFACTANTS MARKET BY APPLICATION (KILOTONS) 2020-2029
TABLE 103 SPAIN BIOSURFACTANTS MARKET BY TYPE (USD BILLION) 2020-2029
TABLE 104 SPAIN BIOSURFACTANTS MARKET BY TYPE (KILOTONS) 2020-2029
TABLE 105 SPAIN BIOSURFACTANTS MARKET BY APPLICATION (USD BILLION) 2020-2029
TABLE 106 SPAIN BIOSURFACTANTS MARKET BY APPLICATION (KILOTONS) 2020-2029
TABLE 107 RUSSIA BIOSURFACTANTS MARKET BY TYPE (USD BILLION) 2020-2029
TABLE 108 RUSSIA BIOSURFACTANTS MARKET BY TYPE (KILOTONS) 2020-2029
TABLE 109 RUSSIA BIOSURFACTANTS MARKET BY APPLICATION (USD BILLION) 2020-2029
TABLE 110 RUSSIA BIOSURFACTANTS MARKET BY APPLICATION (KILOTONS) 2020-2029
TABLE 111 REST OF EUROPE BIOSURFACTANTS MARKET BY TYPE (USD BILLION) 2020-2029
TABLE 112 REST OF EUROPE BIOSURFACTANTS MARKET BY TYPE (KILOTONS) 2020-2029
TABLE 113 REST OF EUROPE BIOSURFACTANTS MARKET BY APPLICATION (USD BILLION) 2020-2029
TABLE 114 REST OF EUROPE BIOSURFACTANTS MARKET BY APPLICATION (KILOTONS) 2020-2029
TABLE 115 MIDDLE EAST AND AFRICA BIOSURFACTANTS MARKET BY COUNTRY (USD BILLION) 2020-2029
TABLE 116 MIDDLE EAST AND AFRICA BIOSURFACTANTS MARKET BY COUNTRY (KILOTONS) 2020-2029
TABLE 117 MIDDLE EAST AND AFRICA BIOSURFACTANTS MARKET BY TYPE (USD BILLION) 2020-2029
TABLE 118 MIDDLE EAST AND AFRICA BIOSURFACTANTS MARKET BY TYPE (KILOTONS) 2020-2029
TABLE 119 MIDDLE EAST AND AFRICA BIOSURFACTANTS MARKET BY APPLICATION (USD BILLION) 2020-2029
TABLE 120 MIDDLE EAST AND AFRICA BIOSURFACTANTS MARKET BY APPLICATION (KILOTONS) 2020-2029
TABLE 121 UAE BIOSURFACTANTS MARKET BY TYPE (USD BILLION) 2020-2029
TABLE 122 UAE BIOSURFACTANTS MARKET BY TYPE (KILOTONS) 2020-2029
TABLE 123 UAE BIOSURFACTANTS MARKET BY APPLICATION (USD BILLION) 2020-2029
TABLE 124 UAE BIOSURFACTANTS MARKET BY APPLICATION (KILOTONS) 2020-2029
TABLE 125 SAUDI ARABIA BIOSURFACTANTS MARKET BY TYPE (USD BILLION) 2020-2029
TABLE 126 SAUDI ARABIA BIOSURFACTANTS MARKET BY TYPE (KILOTONS) 2020-2029
TABLE 127 SAUDI ARABIA BIOSURFACTANTS MARKET BY APPLICATION (USD BILLION) 2020-2029
TABLE 128 SAUDI ARABIA BIOSURFACTANTS MARKET BY APPLICATION (KILOTONS) 2020-2029
TABLE 129 SOUTH AFRICA BIOSURFACTANTS MARKET BY TYPE (USD BILLION) 2020-2029
TABLE 130 SOUTH AFRICA BIOSURFACTANTS MARKET BY TYPE (KILOTONS) 2020-2029
TABLE 131 SOUTH AFRICA BIOSURFACTANTS MARKET BY APPLICATION (USD BILLION) 2020-2029
TABLE 132 SOUTH AFRICA BIOSURFACTANTS MARKET BY APPLICATION (KILOTONS) 2020-2029
TABLE 133 REST OF MIDDLE EAST AND AFRICA BIOSURFACTANTS MARKET BY TYPE (USD BILLION) 2020-2029
TABLE 134 REST OF MIDDLE EAST AND AFRICA BIOSURFACTANTS MARKET BY TYPE (KILOTONS) 2020-2029
TABLE 135 REST OF MIDDLE EAST AND AFRICA BIOSURFACTANTS MARKET BY APPLICATION (USD BILLION) 2020-2029
TABLE 136 REST OF MIDDLE EAST AND AFRICA BIOSURFACTANTS MARKET BY APPLICATION (KILOTONS) 2020-2029
LIST OF FIGURES
FIGURE 1 MARKET DYNAMICS
FIGURE 2 MARKET SEGMENTATION
FIGURE 3 REPORT TIMELINES: YEARS CONSIDERED
FIGURE 4 DATA TRIANGULATION
FIGURE 5 BOTTOM-UP APPROACH
FIGURE 6 TOP-DOWN APPROACH
FIGURE 7 RESEARCH FLOW
FIGURE 8 GLOBAL BIOSURFACTANTS MARKET BY TYPE (USD BILLION) 2020-2029
FIGURE 9 GLOBAL BIOSURFACTANTS MARKET BY APPLICATION (USD BILLION) 2020-2029
FIGURE 11 GLOBAL BIOSURFACTANTS MARKET BY REGION (USD BILLION) 2020-2029
FIGURE 12 PORTER’S FIVE FORCES MODEL
FIGURE 13 GLOBAL BIOSURFACTANTS MARKET BY TYPE (USD BILLION) 2021
FIGURE 14 GLOBAL BIOSURFACTANTS MARKET BY APPLICATION (USD BILLION) 2021
FIGURE 16 GLOBAL BIOSURFACTANTS MARKET BY REGION (USD BILLION) 2021
FIGURE 17 MARKET SHARE ANALYSIS
FIGURE 18 JENEIL: COMPANY SNAPSHOT
FIGURE 19 EVONIK INDUSTRIES: COMPANY SNAPSHOT
FIGURE 20 AGAE TECHNOLOGIES: COMPANY SNAPSHOT
FIGURE 21 GLYCOSURF: COMPANY SNAPSHOT
FIGURE 22 TENSIOGREEN: COMPANY SNAPSHOT
FIGURE 23 STEPAN COMPANY: COMPANY SNAPSHOT
FIGURE 24 HOLIFERM: COMPANY SNAPSHOT
FIGURE 25 SARAYA CO.: COMPANY SNAPSHOT
FIGURE 26 SOLIANCE: COMPANY SNAPSHOT
FIGURE 27 SASOL CHEMICALS: COMPANY SNAPSHOT
FIGURE 28 SOLVAY: COMPANY SNAPSHOT
DOWNLOAD FREE SAMPLE REPORT
License Type
SPEAK WITH OUR ANALYST
Want to know more about the report or any specific requirement?
WANT TO CUSTOMIZE THE REPORT?
Our Clients Speak
We asked them to research ‘ Equipment market’ all over the world, and their whole arrangement was helpful to us. thehealthanalytics.com insightful analysis and reports contributed to our current analysis and in creating a future strategy. Besides, the te
Yosuke Mitsui
Senior Associate Construction Equipment Sales & Marketing
We asked them to research ‘Equipment market’ all over the world, and their whole arrangement was helpful to us. thehealthanalytics.com insightful analysis and reports contributed to our current analysis and in creating a future strategy. Besides, the te


