

Base Year Value ()
x.x %
x.x %
CAGR ()
x.x %
x.x %
Forecast Year Value ()
x.x %
x.x %
Historical Data Period
Largest Region
Forecast Period
Mercado de subestaciones empaquetadas por tipo (subestación interior, subestación empaquetada exterior y subestación empaquetada subterránea), voltaje (por debajo de 36 kV, 36-150 kV), aplicación (industrias, infraestructura, energía) y por región Tendencias globales y pronóstico de 2023 a 2030
Instant access to hundreds of data points and trends
- Market estimates from 2014-2029
- Competitive analysis, industry segmentation, financial benchmarks
- Incorporates SWOT, Porter's Five Forces and risk management frameworks
- PDF report or online database with Word, Excel and PowerPoint export options
- 100% money back guarantee
Descripción general del mercado de subestaciones empaquetadas
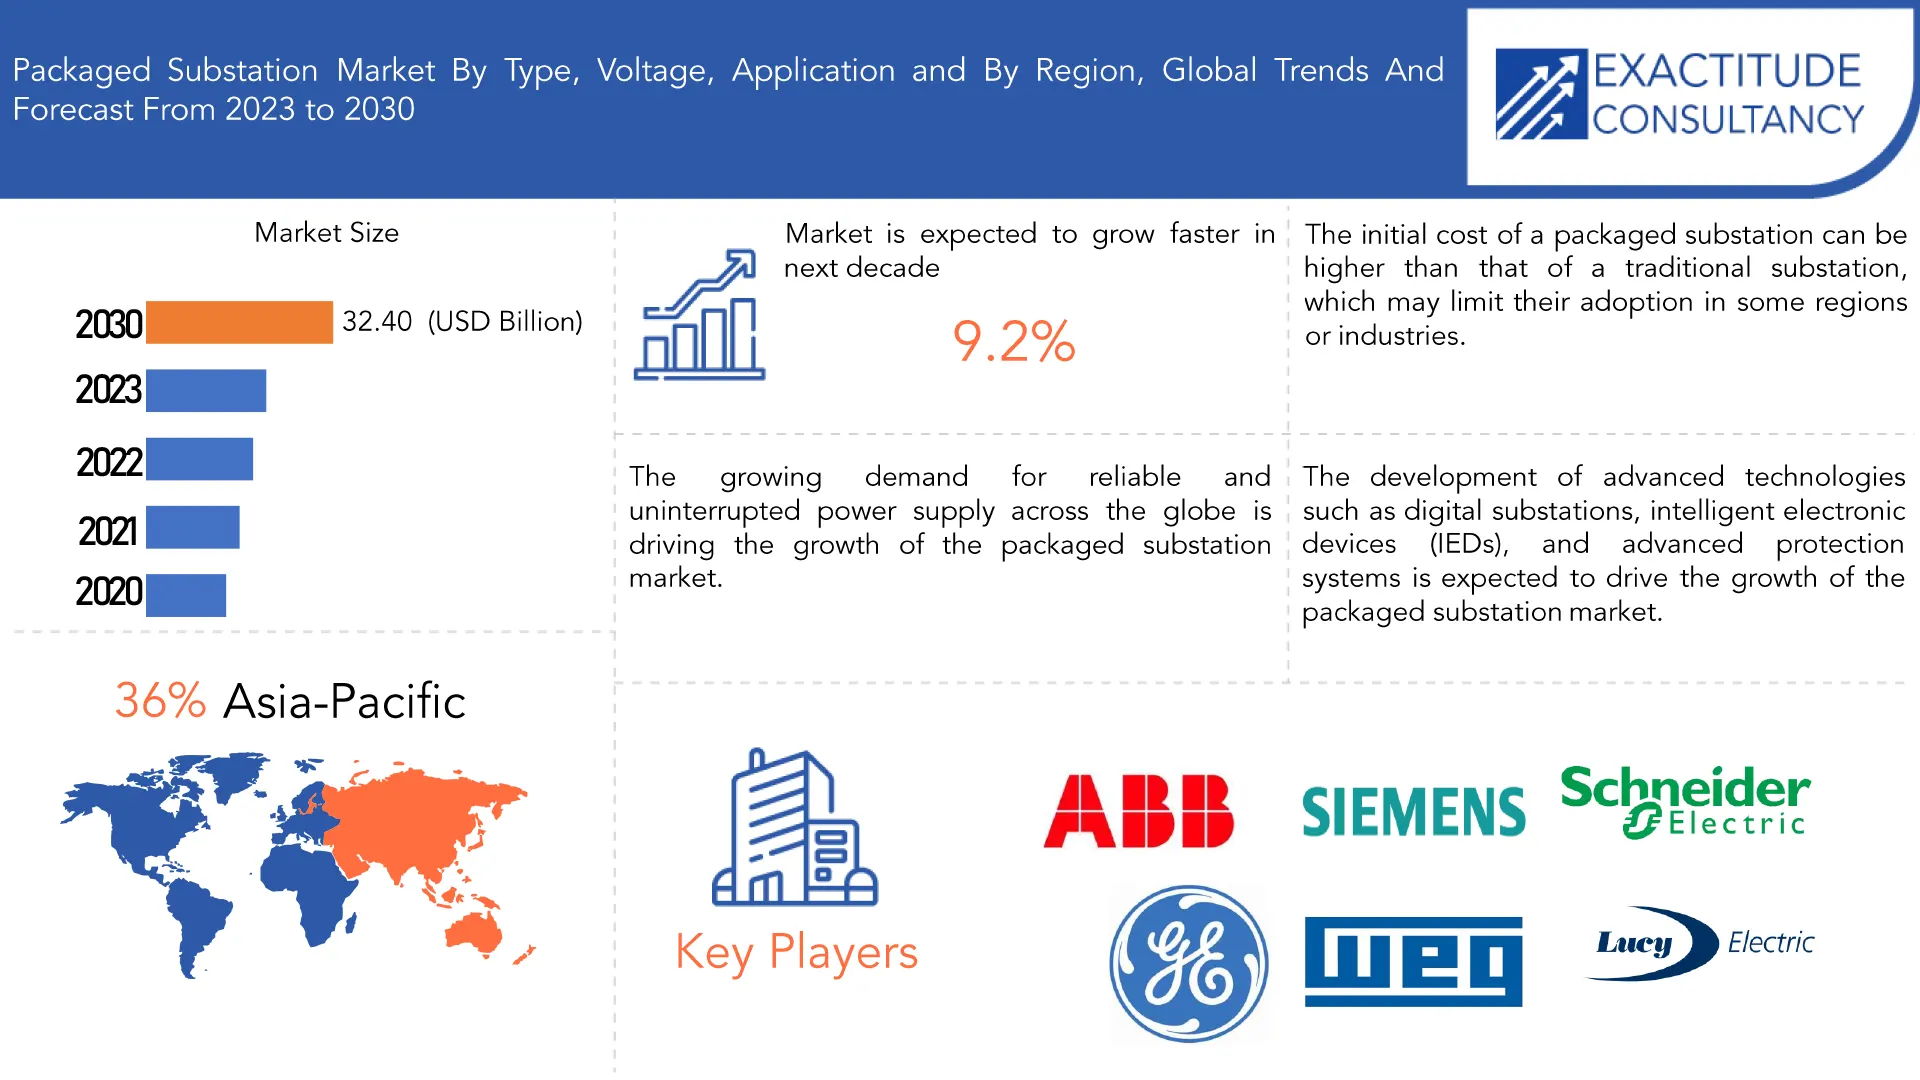
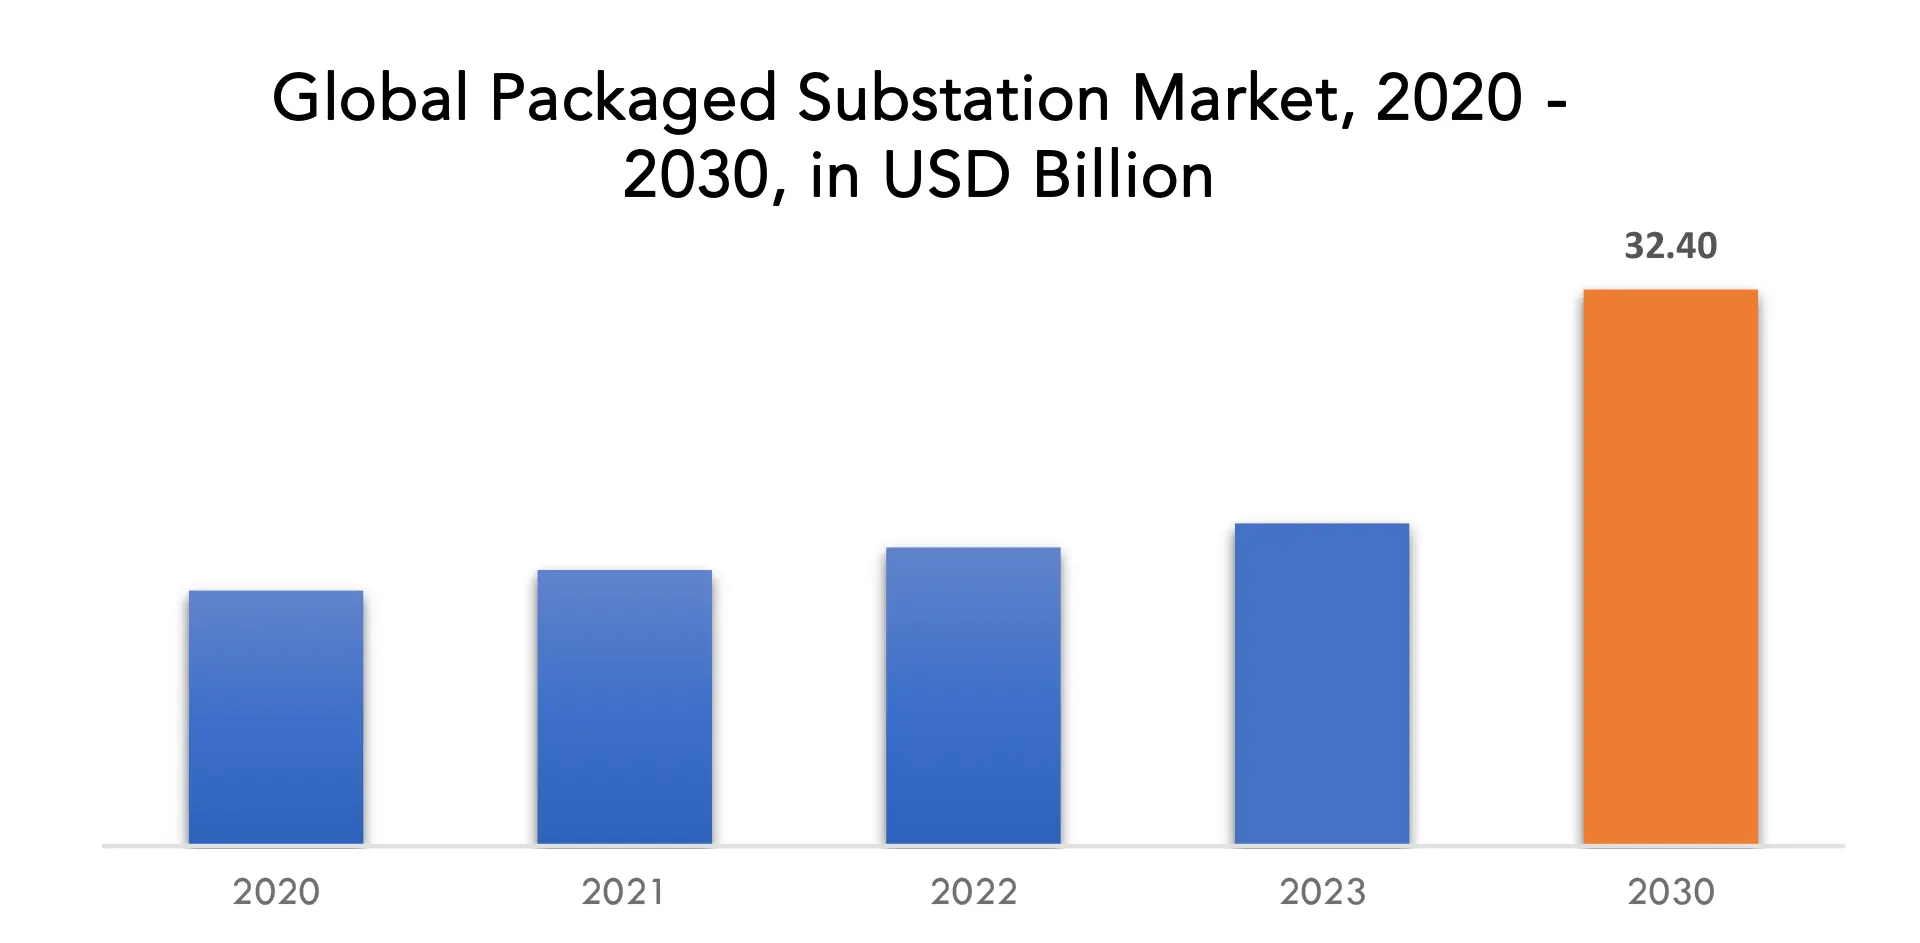
Se proyecta que el mercado global de subestaciones empaquetadas alcance los USD 32,40 mil millones para 2030 desde USD 18,78 mil millones en 2023, a una CAGR del 9,2 % entre 2023 y 2030.
Una subestación es una instalación eléctrica de alto voltaje que puede usarse para regular generadores, circuitos y sistemas. La configuración se utiliza principalmente para convertir CA en CC y está disponible en una variedad de tamaños y voltajes, así como un transformador interno e interruptores asociados. Algunas de las enormes subestaciones están equipadas con varios transformadores, disyuntores , interruptores y otros equipos. Una subestación empaquetada (PSS) es un conjunto prediseñado de equipos eléctricos que está diseñado para instalarse rápida y fácilmente en un sitio para proporcionar distribución de energía eléctrica en una unidad compacta y autónoma. A menudo se utiliza en aplicaciones donde la disponibilidad de energía eléctrica es crítica, como en plantas industriales, edificios comerciales, centros de datos y subestaciones de servicios públicos. También se utilizan comúnmente en lugares remotos donde es difícil o poco práctico instalar subestaciones tradicionales de mayor tamaño. Las subestaciones compactas están diseñadas para ser modulares y escalables, lo que significa que se pueden personalizar fácilmente para cumplir con requisitos de energía específicos. También suelen estar diseñadas para ser respetuosas con el medio ambiente, con características como reducción de ruido y componentes de eficiencia energética. [caption id="attachment_30566" align="aligncenter" width="1920"]
| ATRIBUTO | DETALLES |
| Periodo de estudio | 2020-2030 |
| Año base | 2022 |
| Año estimado | 2023 |
| Año pronosticado | 2023-2030 |
| Periodo histórico | 2019-2021 |
| Unidad | Valor (miles de millones de USD) |
| Segmentación | Por tipo, por voltaje, por aplicación, por región |
| Por tipo |
|
| Por voltaje |
|
| Por aplicación |
|
| Por región |
|
Frequently Asked Questions
• What is the worth of the packaged substation market?
The global packaged substation market is projected to reach USD 32.40 billion by 2030 from USD 18.78 billion in 2023, at a CAGR of 9.2 % from 2023 to 2030.
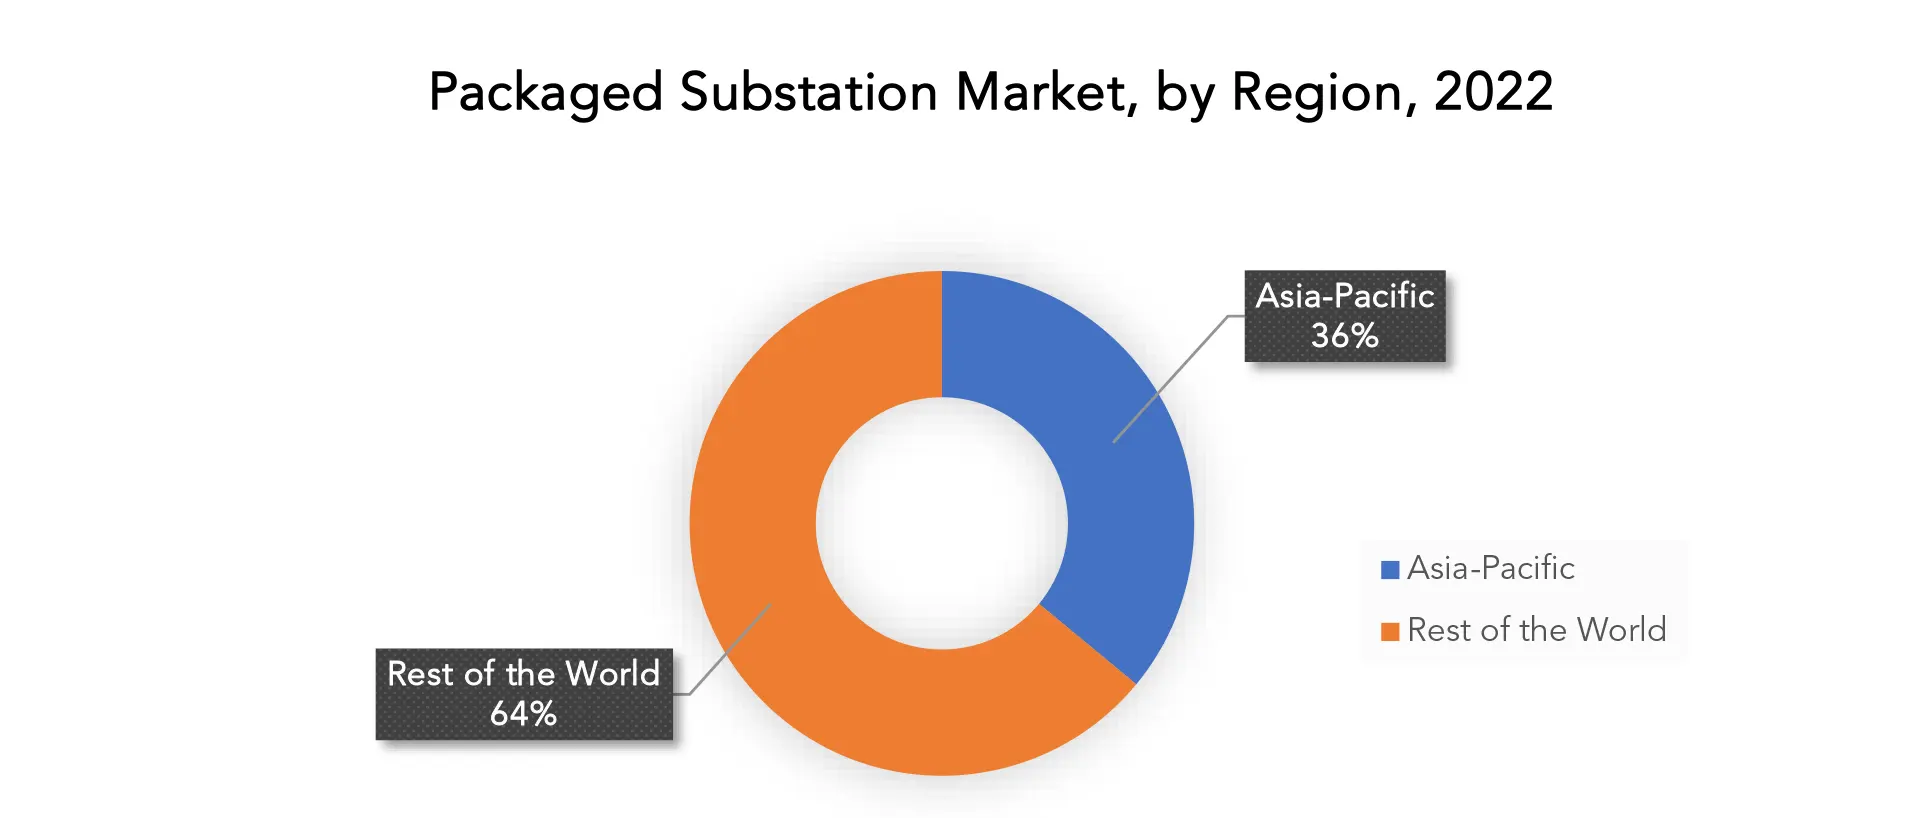
• What is the share of the Asia-pacific packaged substation industry?
Asia-Pacific dominates the packaged substation market, with a market share of over 36%.
• Which are the top companies to hold the market share in the packaged substation market?
ABB Ltd., Siemens AG, Schneider Electric SE, General Electric Company, Eaton Corporation PLC, Crompton Greaves Ltd., WEG Industries, Lucy Electric Ltd, Toshiba Corporation, Alstom, Matelec, Littlefuse Inc. are among the leading players in the global packaged substation market.
• What is the CAGR of packaged substation market?
The global packaged substation market registered a CAGR of 9.2 % from 2023 to 2030.
• What are the key factors driving the market?
The increasing industrialization and urbanization, cost effectiveness, and growing power demand are the main factors driving the packaged substation market.
Packaged Substation Market Segment Analysis
The global packaged substation market is segmented by type, voltage, application and region. [caption id="attachment_30567" align="aligncenter" width="1920"]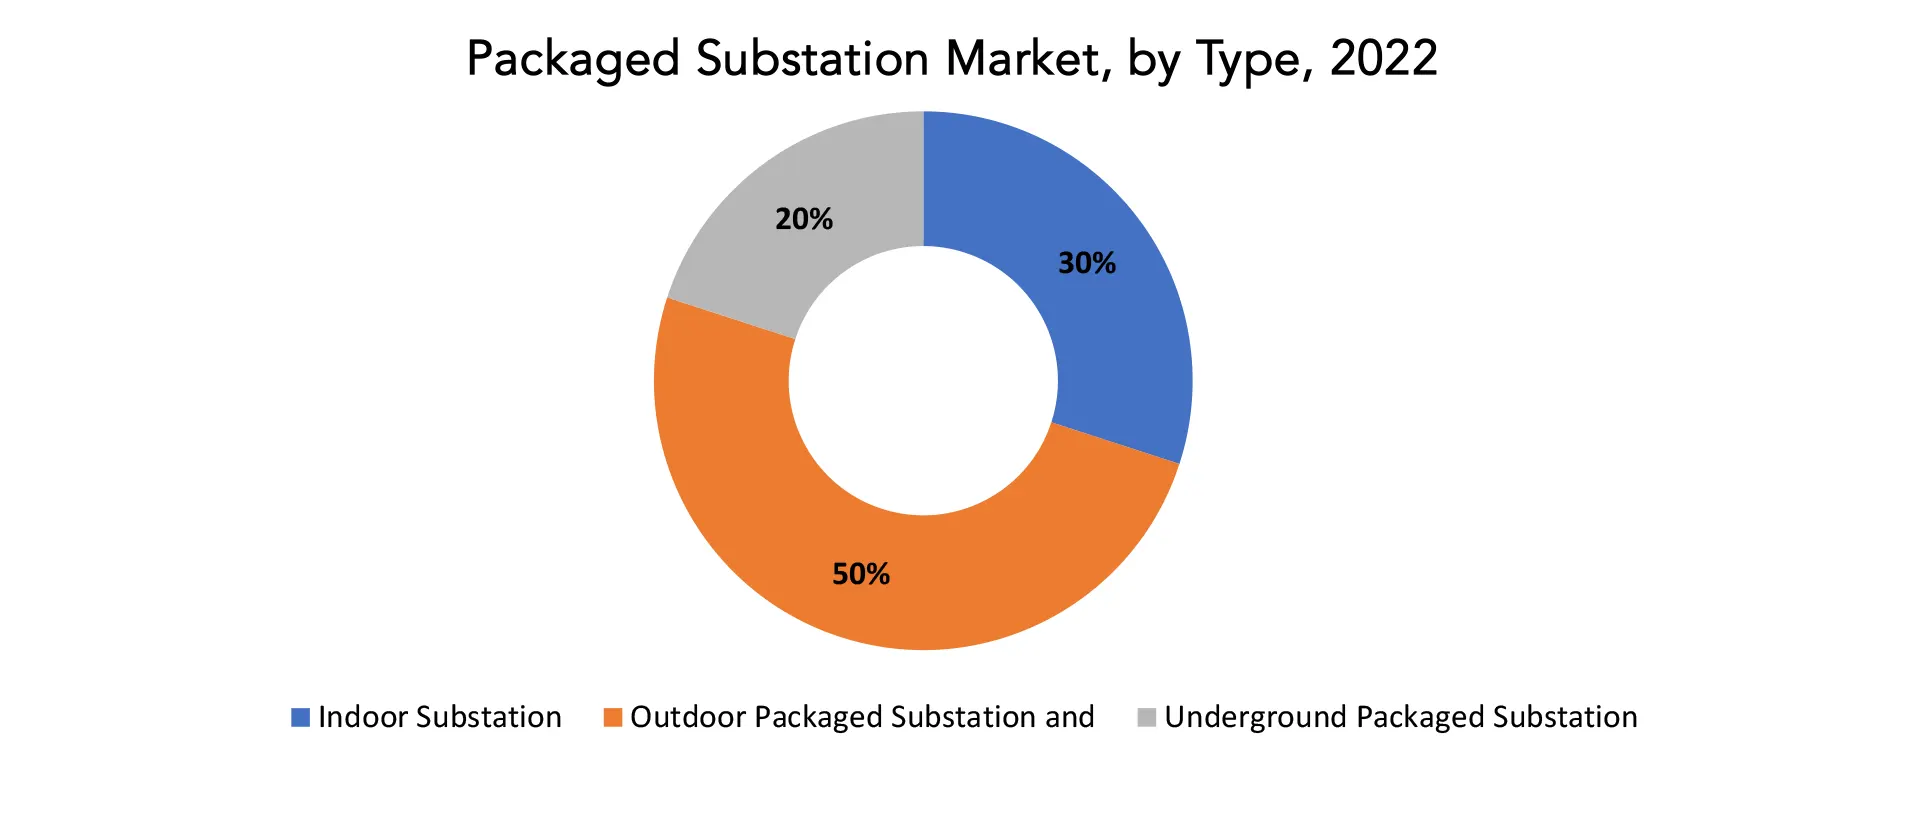
Packaged Substation Market Players
The global packaged substation market key players include ABB Ltd., Siemens AG, Schneider Electric SE, General Electric Company, Eaton Corporation PLC, Crompton Greaves Ltd., WEG Industries, Lucy Electric Ltd, Toshiba Corporation, Alstom, Matelec, Littlefuse Inc. Recent Developments: 3 May 2023: ABB announced that it has completed its acquisition of the Siemens low voltage NEMA motor business. The transaction was originally announced August 11, 2022, and financial terms of the transaction were not disclosed. The business employs around 600 people and generated revenues of approximately $63 million in 2021. January 12, 2022: Toshiba Corporation, a company committed to advancing carbon neutrality through its technologies, products and services, expanded its SCiBTM product offering with the launch of an innovative 20Ah-HP lithium-ion rechargeable battery cell that delivers high energy and high power at the same time.Who Should Buy? Or Key stakeholders
- Component Suppliers
- Investors and Venture Capital Firms
- Integrated Device Manufacturers (IDMs)
- System Integrators
- Electric Hardware Equipment Manufacturers
- Assembly and Packaging Vendors
- Companies in the Electric Utilities Sector
- Analysts and Strategic Business Planners
- End-use Industries
- Governments, Financial Institutions, and Investment Communities
- Research Organizations
Packaged Substation Market Regional Analysis
The packaged substation market by region includes North America, Asia-Pacific (APAC), Europe, South America, and Middle East & Africa (MEA).- North America: includes the US, Canada, Mexico
- Asia Pacific: includes China, Japan, South Korea, India, Australia, ASEAN and Rest of APAC
- Europe: includes UK, Germany, France, Italy, Spain, Russia, and Rest of Europe
- South America: includes Brazil, Argentina and Rest of South America
- Middle East & Africa: includes Turkey, UAE, Saudi Arabia, South Africa, and Rest of MEA
Key Market Segments: Packaged Substation Market
Packaged Substation Market by Type 2020-2030, (USD Billion) (Mega Watts)- Indoor Substation
- Outdoor Packaged Substation and
- Underground Packaged Substation
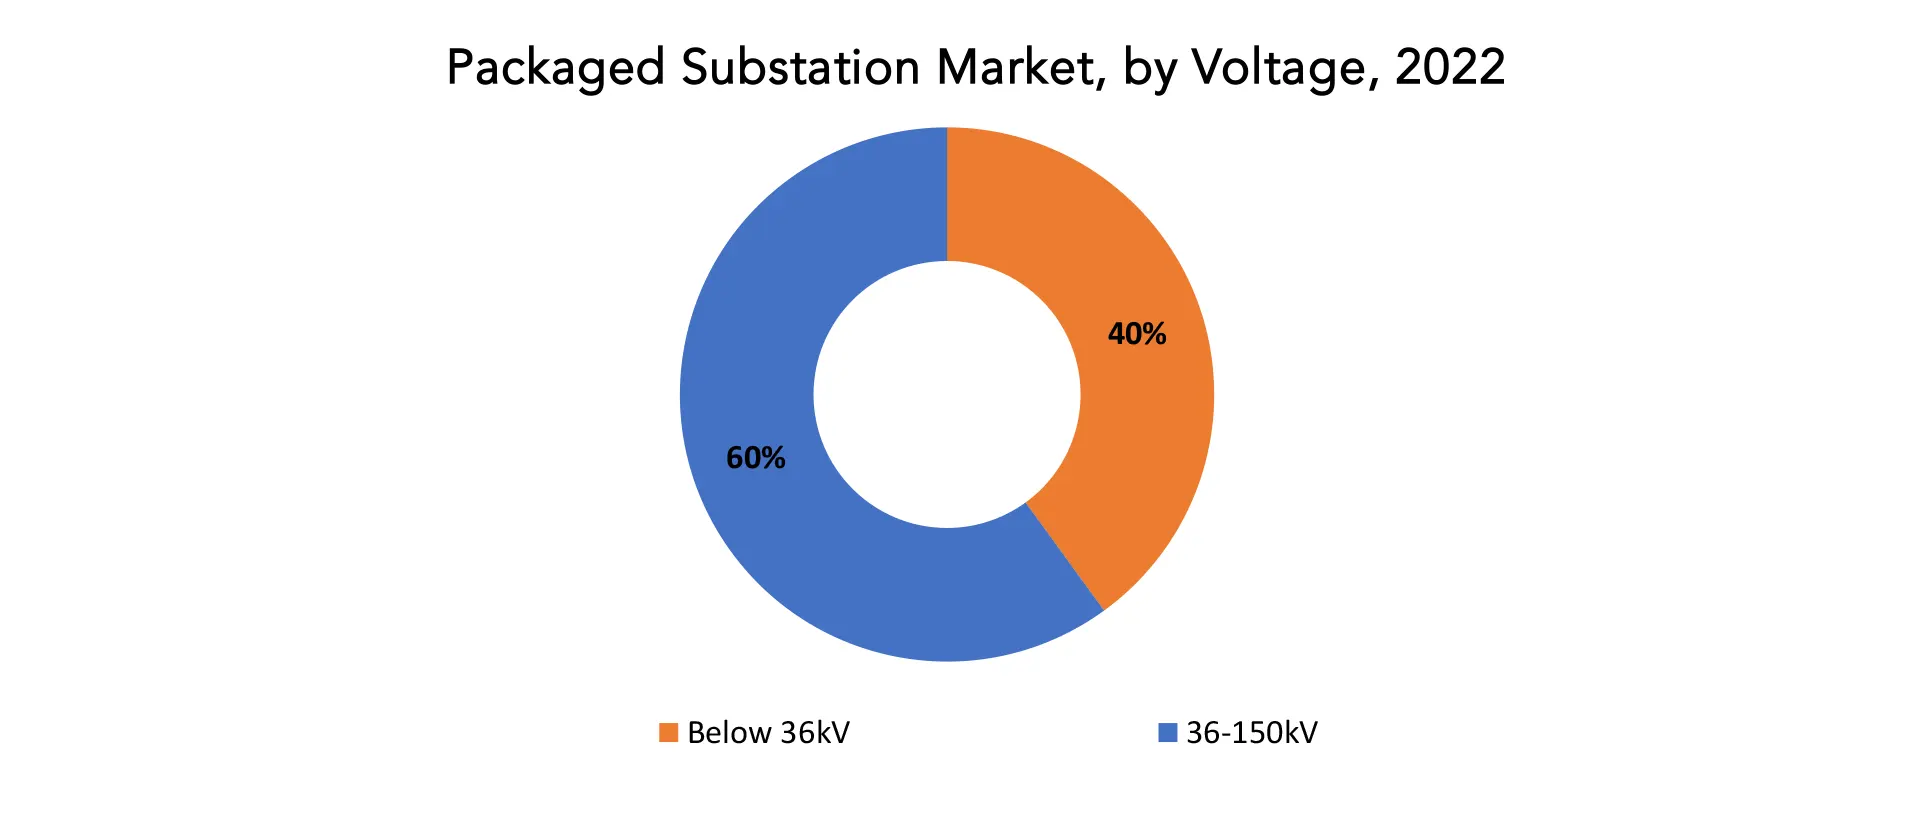
- Below 36kV
- 36-150kV
- Industries
- Infrastructure
- Power
- North America
- Europe
- Asia Pacific
- South America
- Middle East and Africa
Exactitude Consultancy Services Key Objectives
- Increasing sales and market share
- Developing new technology
- Improving profitability
- Entering new markets
- Enhancing brand reputation
Key Question Answered
- What is the expected growth rate of the packaged substation market over the next 7 years?
- Who are the major players in the packaged substation market and what is their market share?
- What are the end-user industries driving demand for market and what is their outlook?
- What are the opportunities for growth in emerging markets such as Asia-Pacific, Middle East, and Africa?
- How is the economic environment affecting the packaged substation market, including factors such as interest rates, inflation, and exchange rates?
- What is the expected impact of government policies and regulations on the packaged substation market?
- What is the current and forecasted size and growth rate of the global packaged substation market?
- What are the key drivers of growth in the packaged substation market?
- What are the distribution channels and supply chain dynamics in the packaged substation market?
- What are the technological advancements and innovations in the packaged substation market and their impact on product development and growth?
- What are the regulatory considerations and their impact on the market?
- What are the challenges faced by players in the packaged substation market and how are they addressing these challenges?
- What are the opportunities for growth and expansion in the packaged substation market?
- What are the products offerings and specifications of leading players in the market?
- What is the pricing trend of packaged substation in the market and what is the impact of raw material prices on the price trend?
- INTRODUCCIÓN
- DEFINICIÓN DE MERCADO
- SEGMENTACIÓN DEL MERCADO
- CRONOGRAMAS DE INVESTIGACIÓN
- SUPUESTOS Y LIMITACIONES
- METODOLOGÍA DE LA INVESTIGACIÓN
- MINERÍA DE DATOS
- INVESTIGACIÓN SECUNDARIA
- INVESTIGACIÓN PRIMARIA
- ASESORAMIENTO DE EXPERTOS EN LA MATERIA
- CONTROLES DE CALIDAD
- REVISIÓN FINAL
- TRIANGULACIÓN DE DATOS
- ENFOQUE DE ABAJO HACIA ARRIBA
- ENFOQUE DE ARRIBA HACIA ABAJO
- FLUJO DE INVESTIGACIÓN
- FUENTES DE DATOS
- MINERÍA DE DATOS
- RESUMEN EJECUTIVO
- PANORAMA DEL MERCADO
- PERSPECTIVAS DEL MERCADO GLOBAL DE SUBESTACIONES PAQUETADAS
- IMPULSORES DEL MERCADO
- RESTRICCIONES DEL MERCADO
- OPORTUNIDADES DE MERCADO
- IMPACT OF COVID-19 ON PACKAGED SUBSTATION MARKET
- PORTER’S FIVE FORCES MODEL
- THREAT FROM NEW ENTRANTS
- THREAT FROM SUBSTITUTES
- BARGAINING POWER OF SUPPLIERS
- BARGAINING POWER OF CUSTOMERS
- DEGREE OF COMPETITION
- INDUSTRY VALUE CHAIN ANALYSIS
- PERSPECTIVAS DEL MERCADO GLOBAL DE SUBESTACIONES PAQUETADAS
- GLOBAL PACKAGED SUBSTATION MARKET BY TYPE, 2020-2030, (USD BILLION) (MEGA WATTS)
- INDOOR SUBSTATION
- OUTDOOR PACKAGED SUBSTATION AND
- UNDERGROUND PACKAGED SUBSTATION
- GLOBAL PACKAGED SUBSTATION MARKET BY VOLTAGE, 2020-2030, (USD BILLION) (MEGA WATTS)
- BELOW 36KV
- 36-150KV
- GLOBAL PACKAGED SUBSTATION MARKET BY APPLICATION, 2020-2030, (USD BILLION) (MEGA WATTS)
- INDUSTRIES
- INFRASTRUCTURE
- POWER
- GLOBAL PACKAGED SUBSTATION MARKET BY REGION, 2020-2030, (USD BILLION) (MEGA WATTS)
- NORTH AMERICA
- US
- CANADA
- MEXICO
- SOUTH AMERICA
- BRAZIL
- ARGENTINA
- COLOMBIA
- REST OF SOUTH AMERICA
- EUROPE
- GERMANY
- UK
- FRANCE
- ITALY
- SPAIN
- RUSSIA
- REST OF EUROPE
- ASIA PACIFIC
- INDIA
- CHINA
- JAPAN
- SOUTH KOREA
- AUSTRALIA
- SOUTH-EAST ASIA
- REST OF ASIA PACIFIC
- MIDDLE EAST AND AFRICA
- UAE
- SAUDI ARABIA
- SOUTH AFRICA
- REST OF MIDDLE EAST AND AFRICA
- NORTH AMERICA
- COMPANY PROFILES*(BUSINESS OVERVIEW, COMPANY SNAPSHOT, PRODUCT OFFERED, RECENT DEVELOPMENTS)
9.1. ABB LTD
9.2. SIEMENS AG
9.3. SCHNEIDER ELECTRIC SE
9.4. GENERAL ELECTRIC COMPANY
9.5. EATON CORPORATION PLC
9.6. CROMPTON GREAVES LTD.
9.7. WEG INDUSTRIES
9.8. LUCY ELECTRIC LTD
9.9. TOSHIBA CORPORATION
9.10. ALSTOM
9.11. MATELEC
9.12. LITTLEFUSE INC.*THE COMPANY LIST IS INDICATIVE
LIST OF TABLES
TABLE 1 GLOBAL PACKAGED SUBSTATION MARKET BY TYPE (USD BILLION) 2020-2030
TABLE 2 GLOBAL PACKAGED SUBSTATION MARKET BY TYPE (MEGA WATTS) 2020-2030
TABLE 3 GLOBAL PACKAGED SUBSTATION MARKET BY VOLTAGE (USD BILLION) 2020-2030
TABLE 4 GLOBAL PACKAGED SUBSTATION MARKET BY VOLTAGE (MEGA WATTS) 2020-2030
TABLE 5 GLOBAL PACKAGED SUBSTATION MARKET BY APPLICATION (USD BILLION) 2020-2030
TABLE 6 GLOBAL PACKAGED SUBSTATION MARKET BY APPLICATION (MEGA WATTS) 2020-2030
TABLE 7 GLOBAL PACKAGED SUBSTATION MARKET BY REGION (USD BILLION) 2020-2030
TABLE 8 GLOBAL PACKAGED SUBSTATION MARKET BY REGION (MEGA WATTS) 2020-2030
TABLE 9 NORTH AMERICA PACKAGED SUBSTATION MARKET BY COUNTRY (USD BILLION) 2020-2030
TABLE 10 NORTH AMERICA PACKAGED SUBSTATION MARKET BY COUNTRY (MEGA WATTS) 2020-2030
TABLE 11 NORTH AMERICA PACKAGED SUBSTATION MARKET BY TYPE (USD BILLION) 2020-2030
TABLE 12 NORTH AMERICA PACKAGED SUBSTATION MARKET BY TYPE (MEGA WATTS) 2020-2030
TABLE 13 NORTH AMERICA PACKAGED SUBSTATION MARKET BY VOLTAGE (USD BILLION) 2020-2030
TABLE 14 NORTH AMERICA PACKAGED SUBSTATION MARKET BY VOLTAGE (MEGA WATTS) 2020-2030
TABLE 15 NORTH AMERICA PACKAGED SUBSTATION MARKET BY APPLICATION (USD BILLION) 2020-2030
TABLE 16 NORTH AMERICA PACKAGED SUBSTATION MARKET BY APPLICATION (MEGA WATTS) 2020-2030
TABLE 17 US PACKAGED SUBSTATION MARKET BY TYPE (USD BILLION) 2020-2030
TABLE 18 US PACKAGED SUBSTATION MARKET BY TYPE (MEGA WATTS) 2020-2030
TABLE 19 US PACKAGED SUBSTATION MARKET BY VOLTAGE (USD BILLION) 2020-2030
TABLE 20 US PACKAGED SUBSTATION MARKET BY VOLTAGE (MEGA WATTS) 2020-2030
TABLE 21 US PACKAGED SUBSTATION MARKET BY APPLICATION (USD BILLION) 2020-2030
TABLE 22 US PACKAGED SUBSTATION MARKET BY APPLICATION (MEGA WATTS) 2020-2030
TABLE 23 CANADA PACKAGED SUBSTATION MARKET BY TYPE (USD BILLION) 2020-2030
TABLE 24 CANADA PACKAGED SUBSTATION MARKET BY TYPE (MEGA WATTS) 2020-2030
TABLE 25 CANADA PACKAGED SUBSTATION MARKET BY VOLTAGE (USD BILLION) 2020-2030
TABLE 26 CANADA PACKAGED SUBSTATION MARKET BY VOLTAGE (MEGA WATTS) 2020-2030
TABLE 27 CANADA PACKAGED SUBSTATION MARKET BY APPLICATION (USD BILLION) 2020-2030
TABLE 28 CANADA PACKAGED SUBSTATION MARKET BY APPLICATION (MEGA WATTS) 2020-2030
TABLE 29 MEXICO PACKAGED SUBSTATION MARKET BY TYPE (USD BILLION) 2020-2030
TABLE 30 MEXICO PACKAGED SUBSTATION MARKET BY TYPE (MEGA WATTS) 2020-2030
TABLE 31 MEXICO PACKAGED SUBSTATION MARKET BY VOLTAGE (USD BILLION) 2020-2030
TABLE 32 MEXICO PACKAGED SUBSTATION MARKET BY VOLTAGE (MEGA WATTS) 2020-2030
TABLE 33 MEXICO PACKAGED SUBSTATION MARKET BY APPLICATION (USD BILLION) 2020-2030
TABLE 34 MEXICO PACKAGED SUBSTATION MARKET BY APPLICATION (MEGA WATTS) 2020-2030
TABLE 35 SOUTH AMERICA PACKAGED SUBSTATION MARKET BY COUNTRY (USD BILLION) 2020-2030
TABLE 36 SOUTH AMERICA PACKAGED SUBSTATION MARKET BY COUNTRY (MEGA WATTS) 2020-2030
TABLE 37 SOUTH AMERICA PACKAGED SUBSTATION MARKET BY TYPE (USD BILLION) 2020-2030
TABLE 38 SOUTH AMERICA PACKAGED SUBSTATION MARKET BY TYPE (MEGA WATTS) 2020-2030
TABLE 39 SOUTH AMERICA PACKAGED SUBSTATION MARKET BY VOLTAGE (USD BILLION) 2020-2030
TABLE 40 SOUTH AMERICA PACKAGED SUBSTATION MARKET BY VOLTAGE (MEGA WATTS) 2020-2030
TABLE 41 SOUTH AMERICA PACKAGED SUBSTATION MARKET BY APPLICATION (USD BILLION) 2020-2030
TABLE 42 SOUTH AMERICA PACKAGED SUBSTATION MARKET BY APPLICATION (MEGA WATTS) 2020-2030
TABLE 43 BRAZIL PACKAGED SUBSTATION MARKET BY TYPE (USD BILLION) 2020-2030
TABLE 44 BRAZIL PACKAGED SUBSTATION MARKET BY TYPE (MEGA WATTS) 2020-2030
TABLE 45 BRAZIL PACKAGED SUBSTATION MARKET BY VOLTAGE (USD BILLION) 2020-2030
TABLE 46 BRAZIL PACKAGED SUBSTATION MARKET BY VOLTAGE (MEGA WATTS) 2020-2030
TABLE 47 BRAZIL PACKAGED SUBSTATION MARKET BY APPLICATION (USD BILLION) 2020-2030
TABLE 48 BRAZIL PACKAGED SUBSTATION MARKET BY APPLICATION (MEGA WATTS) 2020-2030
TABLE 49 ARGENTINA PACKAGED SUBSTATION MARKET BY TYPE (USD BILLION) 2020-2030
TABLE 50 ARGENTINA PACKAGED SUBSTATION MARKET BY TYPE (MEGA WATTS) 2020-2030
TABLE 51 ARGENTINA PACKAGED SUBSTATION MARKET BY VOLTAGE (USD BILLION) 2020-2030
TABLE 52 ARGENTINA PACKAGED SUBSTATION MARKET BY VOLTAGE (MEGA WATTS) 2020-2030
TABLE 53 ARGENTINA PACKAGED SUBSTATION MARKET BY APPLICATION (USD BILLION) 2020-2030
TABLE 54 ARGENTINA PACKAGED SUBSTATION MARKET BY APPLICATION (MEGA WATTS) 2020-2030
TABLE 55 COLOMBIA PACKAGED SUBSTATION MARKET BY TYPE (USD BILLION) 2020-2030
TABLE 56 COLOMBIA PACKAGED SUBSTATION MARKET BY TYPE (MEGA WATTS) 2020-2030
TABLE 57 COLOMBIA PACKAGED SUBSTATION MARKET BY VOLTAGE (USD BILLION) 2020-2030
TABLE 58 COLOMBIA PACKAGED SUBSTATION MARKET BY VOLTAGE (MEGA WATTS) 2020-2030
TABLE 59 COLOMBIA PACKAGED SUBSTATION MARKET BY APPLICATION (USD BILLION) 2020-2030
TABLE 60 COLOMBIA PACKAGED SUBSTATION MARKET BY APPLICATION (MEGA WATTS) 2020-2030
TABLE 61 REST OF SOUTH AMERICA PACKAGED SUBSTATION MARKET BY TYPE (USD BILLION) 2020-2030
TABLE 62 REST OF SOUTH AMERICA PACKAGED SUBSTATION MARKET BY TYPE (MEGA WATTS) 2020-2030
TABLE 63 REST OF SOUTH AMERICA PACKAGED SUBSTATION MARKET BY VOLTAGE (USD BILLION) 2020-2030
TABLE 64 REST OF SOUTH AMERICA PACKAGED SUBSTATION MARKET BY VOLTAGE (MEGA WATTS) 2020-2030
TABLE 65 REST OF SOUTH AMERICA PACKAGED SUBSTATION MARKET BY APPLICATION (USD BILLION) 2020-2030
TABLE 66 REST OF SOUTH AMERICA PACKAGED SUBSTATION MARKET BY APPLICATION (MEGA WATTS) 2020-2030
TABLE 67 ASIA-PACIFIC PACKAGED SUBSTATION MARKET BY COUNTRY (USD BILLION) 2020-2030
TABLE 68 ASIA-PACIFIC PACKAGED SUBSTATION MARKET BY COUNTRY (MEGA WATTS) 2020-2030
TABLE 69 ASIA-PACIFIC PACKAGED SUBSTATION MARKET BY TYPE (USD BILLION) 2020-2030
TABLE 70 ASIA-PACIFIC PACKAGED SUBSTATION MARKET BY TYPE (MEGA WATTS) 2020-2030
TABLE 71 ASIA-PACIFIC PACKAGED SUBSTATION MARKET BY VOLTAGE (USD BILLION) 2020-2030
TABLE 72 ASIA-PACIFIC PACKAGED SUBSTATION MARKET BY VOLTAGE (MEGA WATTS) 2020-2030
TABLE 73 ASIA-PACIFIC PACKAGED SUBSTATION MARKET BY APPLICATION (USD BILLION) 2020-2030
TABLE 74 ASIA-PACIFIC PACKAGED SUBSTATION MARKET BY APPLICATION (MEGA WATTS) 2020-2030
TABLE 75 INDIA PACKAGED SUBSTATION MARKET BY TYPE (USD BILLION) 2020-2030
TABLE 76 INDIA PACKAGED SUBSTATION MARKET BY TYPE (MEGA WATTS) 2020-2030
TABLE 77 INDIA PACKAGED SUBSTATION MARKET BY VOLTAGE (USD BILLION) 2020-2030
TABLE 78 INDIA PACKAGED SUBSTATION MARKET BY VOLTAGE (MEGA WATTS) 2020-2030
TABLE 79 INDIA PACKAGED SUBSTATION MARKET BY APPLICATION (USD BILLION) 2020-2030
TABLE 80 INDIA PACKAGED SUBSTATION MARKET BY APPLICATION (MEGA WATTS) 2020-2030
TABLE 81 CHINA PACKAGED SUBSTATION MARKET BY TYPE (USD BILLION) 2020-2030
TABLE 82 CHINA PACKAGED SUBSTATION MARKET BY TYPE (MEGA WATTS) 2020-2030
TABLE 83 CHINA PACKAGED SUBSTATION MARKET BY VOLTAGE (USD BILLION) 2020-2030
TABLE 84 CHINA PACKAGED SUBSTATION MARKET BY VOLTAGE (MEGA WATTS) 2020-2030
TABLE 85 CHINA PACKAGED SUBSTATION MARKET BY APPLICATION (USD BILLION) 2020-2030
TABLE 86 CHINA PACKAGED SUBSTATION MARKET BY APPLICATION (MEGA WATTS) 2020-2030
TABLE 87 JAPAN PACKAGED SUBSTATION MARKET BY TYPE (USD BILLION) 2020-2030
TABLE 88 JAPAN PACKAGED SUBSTATION MARKET BY TYPE (MEGA WATTS) 2020-2030
TABLE 89 JAPAN PACKAGED SUBSTATION MARKET BY VOLTAGE (USD BILLION) 2020-2030
TABLE 90 JAPAN PACKAGED SUBSTATION MARKET BY VOLTAGE (MEGA WATTS) 2020-2030
TABLE 91 JAPAN PACKAGED SUBSTATION MARKET BY APPLICATION (USD BILLION) 2020-2030
TABLE 92 JAPAN PACKAGED SUBSTATION MARKET BY APPLICATION (MEGA WATTS) 2020-2030
TABLE 93 SOUTH KOREA PACKAGED SUBSTATION MARKET BY TYPE (USD BILLION) 2020-2030
TABLE 94 SOUTH KOREA PACKAGED SUBSTATION MARKET BY TYPE (MEGA WATTS) 2020-2030
TABLE 95 SOUTH KOREA PACKAGED SUBSTATION MARKET BY VOLTAGE (USD BILLION) 2020-2030
TABLE 96 SOUTH KOREA PACKAGED SUBSTATION MARKET BY VOLTAGE (MEGA WATTS) 2020-2030
TABLE 97 SOUTH KOREA PACKAGED SUBSTATION MARKET BY APPLICATION (USD BILLION) 2020-2030
TABLE 98 SOUTH KOREA PACKAGED SUBSTATION MARKET BY APPLICATION (MEGA WATTS) 2020-2030
TABLE 99 AUSTRALIA PACKAGED SUBSTATION MARKET BY TYPE (USD BILLION) 2020-2030
TABLE 100 AUSTRALIA PACKAGED SUBSTATION MARKET BY TYPE (MEGA WATTS) 2020-2030
TABLE 101 AUSTRALIA PACKAGED SUBSTATION MARKET BY VOLTAGE (USD BILLION) 2020-2030
TABLE 102 AUSTRALIA PACKAGED SUBSTATION MARKET BY VOLTAGE (MEGA WATTS) 2020-2030
TABLE 103 AUSTRALIA PACKAGED SUBSTATION MARKET BY APPLICATION (USD BILLION) 2020-2030
TABLE 104 AUSTRALIA PACKAGED SUBSTATION MARKET BY APPLICATION (MEGA WATTS) 2020-2030
TABLE 105 SOUTH-EAST ASIA PACKAGED SUBSTATION MARKET BY TYPE (USD BILLION) 2020-2030
TABLE 106 SOUTH-EAST ASIA PACKAGED SUBSTATION MARKET BY TYPE (MEGA WATTS) 2020-2030
TABLE 107 SOUTH-EAST ASIA PACKAGED SUBSTATION MARKET BY VOLTAGE (USD BILLION) 2020-2030
TABLE 108 SOUTH-EAST ASIA PACKAGED SUBSTATION MARKET BY VOLTAGE (MEGA WATTS) 2020-2030
TABLE 109 SOUTH-EAST ASIA PACKAGED SUBSTATION MARKET BY APPLICATION (USD BILLION) 2020-2030
TABLE 110 SOUTH-EAST ASIA PACKAGED SUBSTATION MARKET BY APPLICATION (MEGA WATTS) 2020-2030
TABLE 111 REST OF ASIA PACIFIC PACKAGED SUBSTATION MARKET BY TYPE (USD BILLION) 2020-2030
TABLE 112 REST OF ASIA PACIFIC PACKAGED SUBSTATION MARKET BY TYPE (MEGA WATTS) 2020-2030
TABLE 113 REST OF ASIA PACIFIC PACKAGED SUBSTATION MARKET BY VOLTAGE (USD BILLION) 2020-2030
TABLE 114 REST OF ASIA PACIFIC PACKAGED SUBSTATION MARKET BY VOLTAGE (MEGA WATTS) 2020-2030
TABLE 115 REST OF ASIA PACIFIC PACKAGED SUBSTATION MARKET BY APPLICATION (USD BILLION) 2020-2030
TABLE 116 REST OF ASIA PACIFIC PACKAGED SUBSTATION MARKET BY APPLICATION (MEGA WATTS) 2020-2030
TABLE 117 EUROPE PACKAGED SUBSTATION MARKET BY COUNTRY (USD BILLION) 2020-2030
TABLE 118 EUROPE PACKAGED SUBSTATION MARKET BY COUNTRY (MEGA WATTS) 2020-2030
TABLE 119 EUROPE PACKAGED SUBSTATION MARKET BY TYPE (USD BILLION) 2020-2030
TABLE 120 EUROPE PACKAGED SUBSTATION MARKET BY TYPE (MEGA WATTS) 2020-2030
TABLE 121 EUROPE PACKAGED SUBSTATION MARKET BY VOLTAGE (USD BILLION) 2020-2030
TABLE 122 EUROPE PACKAGED SUBSTATION MARKET BY VOLTAGE (MEGA WATTS) 2020-2030
TABLE 123 EUROPE PACKAGED SUBSTATION MARKET BY APPLICATION (USD BILLION) 2020-2030
TABLE 124 EUROPE PACKAGED SUBSTATION MARKET BY APPLICATION (MEGA WATTS) 2020-2030
TABLE 125 GERMANY PACKAGED SUBSTATION MARKET BY TYPE (USD BILLION) 2020-2030
TABLE 126 GERMANY PACKAGED SUBSTATION MARKET BY TYPE (MEGA WATTS) 2020-2030
TABLE 127 GERMANY PACKAGED SUBSTATION MARKET BY VOLTAGE (USD BILLION) 2020-2030
TABLE 128 GERMANY PACKAGED SUBSTATION MARKET BY VOLTAGE (MEGA WATTS) 2020-2030
TABLE 129 GERMANY PACKAGED SUBSTATION MARKET BY APPLICATION (USD BILLION) 2020-2030
TABLE 130 GERMANY PACKAGED SUBSTATION MARKET BY APPLICATION (MEGA WATTS) 2020-2030
TABLE 131 UK PACKAGED SUBSTATION MARKET BY TYPE (USD BILLION) 2020-2030
TABLE 132 UK PACKAGED SUBSTATION MARKET BY TYPE (MEGA WATTS) 2020-2030
TABLE 133 UK PACKAGED SUBSTATION MARKET BY VOLTAGE (USD BILLION) 2020-2030
TABLE 134 UK PACKAGED SUBSTATION MARKET BY VOLTAGE (MEGA WATTS) 2020-2030
TABLE 135 UK PACKAGED SUBSTATION MARKET BY APPLICATION (USD BILLION) 2020-2030
TABLE 136 UK PACKAGED SUBSTATION MARKET BY APPLICATION (MEGA WATTS) 2020-2030
TABLE 137 FRANCE PACKAGED SUBSTATION MARKET BY TYPE (USD BILLION) 2020-2030
TABLE 138 FRANCE PACKAGED SUBSTATION MARKET BY TYPE (MEGA WATTS) 2020-2030
TABLE 139 FRANCE PACKAGED SUBSTATION MARKET BY VOLTAGE (USD BILLION) 2020-2030
TABLE 140 FRANCE PACKAGED SUBSTATION MARKET BY VOLTAGE (MEGA WATTS) 2020-2030
TABLE 141 FRANCE PACKAGED SUBSTATION MARKET BY APPLICATION (USD BILLION) 2020-2030
TABLE 142 FRANCE PACKAGED SUBSTATION MARKET BY APPLICATION (MEGA WATTS) 2020-2030
TABLE 143 ITALY PACKAGED SUBSTATION MARKET BY TYPE (USD BILLION) 2020-2030
TABLE 144 ITALY PACKAGED SUBSTATION MARKET BY TYPE (MEGA WATTS) 2020-2030
TABLE 145 ITALY PACKAGED SUBSTATION MARKET BY VOLTAGE (USD BILLION) 2020-2030
TABLE 146 ITALY PACKAGED SUBSTATION MARKET BY VOLTAGE (MEGA WATTS) 2020-2030
TABLE 147 ITALY PACKAGED SUBSTATION MARKET BY APPLICATION (USD BILLION) 2020-2030
TABLE 148 ITALY PACKAGED SUBSTATION MARKET BY APPLICATION (MEGA WATTS) 2020-2030
TABLE 149 SPAIN PACKAGED SUBSTATION MARKET BY TYPE (USD BILLION) 2020-2030
TABLE 150 SPAIN PACKAGED SUBSTATION MARKET BY TYPE (MEGA WATTS) 2020-2030
TABLE 151 SPAIN PACKAGED SUBSTATION MARKET BY VOLTAGE (USD BILLION) 2020-2030
TABLE 152 SPAIN PACKAGED SUBSTATION MARKET BY VOLTAGE (MEGA WATTS) 2020-2030
TABLE 153 SPAIN PACKAGED SUBSTATION MARKET BY APPLICATION (USD BILLION) 2020-2030
TABLE 154 SPAIN PACKAGED SUBSTATION MARKET BY APPLICATION (MEGA WATTS) 2020-2030
TABLE 155 RUSSIA PACKAGED SUBSTATION MARKET BY TYPE (USD BILLION) 2020-2030
TABLE 156 RUSSIA PACKAGED SUBSTATION MARKET BY TYPE (MEGA WATTS) 2020-2030
TABLE 157 RUSSIA PACKAGED SUBSTATION MARKET BY VOLTAGE (USD BILLION) 2020-2030
TABLE 158 RUSSIA PACKAGED SUBSTATION MARKET BY VOLTAGE (MEGA WATTS) 2020-2030
TABLE 159 RUSSIA PACKAGED SUBSTATION MARKET BY APPLICATION (USD BILLION) 2020-2030
TABLE 160 RUSSIA PACKAGED SUBSTATION MARKET BY APPLICATION (MEGA WATTS) 2020-2030
TABLE 161 REST OF EUROPE PACKAGED SUBSTATION MARKET BY TYPE (USD BILLION) 2020-2030
TABLE 162 REST OF EUROPE PACKAGED SUBSTATION MARKET BY TYPE (MEGA WATTS) 2020-2030
TABLE 163 REST OF EUROPE PACKAGED SUBSTATION MARKET BY VOLTAGE (USD BILLION) 2020-2030
TABLE 164 REST OF EUROPE PACKAGED SUBSTATION MARKET BY VOLTAGE (MEGA WATTS) 2020-2030
TABLE 165 REST OF EUROPE PACKAGED SUBSTATION MARKET BY APPLICATION (USD BILLION) 2020-2030
TABLE 166 REST OF EUROPE PACKAGED SUBSTATION MARKET BY APPLICATION (MEGA WATTS) 2020-2030
TABLE 167 MIDDLE EAST AND AFRICA PACKAGED SUBSTATION MARKET BY COUNTRY (USD BILLION) 2020-2030
TABLE 168 MIDDLE EAST AND AFRICA PACKAGED SUBSTATION MARKET BY COUNTRY (MEGA WATTS) 2020-2030
TABLE 169 MIDDLE EAST AND AFRICA PACKAGED SUBSTATION MARKET BY TYPE (USD BILLION) 2020-2030
TABLE 170 MIDDLE EAST AND AFRICA PACKAGED SUBSTATION MARKET BY TYPE (MEGA WATTS) 2020-2030
TABLE 171 MIDDLE EAST AND AFRICA PACKAGED SUBSTATION MARKET BY VOLTAGE (USD BILLION) 2020-2030
TABLE 172 MIDDLE EAST AND AFRICA PACKAGED SUBSTATION MARKET BY VOLTAGE (MEGA WATTS) 2020-2030
TABLE 173 MIDDLE EAST AND AFRICA PACKAGED SUBSTATION MARKET BY APPLICATION (USD BILLION) 2020-2030
TABLE 174 MIDDLE EAST AND AFRICA PACKAGED SUBSTATION MARKET BY APPLICATION (MEGA WATTS) 2020-2030
TABLE 175 UAE PACKAGED SUBSTATION MARKET BY TYPE (USD BILLION) 2020-2030
TABLE 176 UAE PACKAGED SUBSTATION MARKET BY TYPE (MEGA WATTS) 2020-2030
TABLE 177 UAE PACKAGED SUBSTATION MARKET BY VOLTAGE (USD BILLION) 2020-2030
TABLE 178 UAE PACKAGED SUBSTATION MARKET BY VOLTAGE (MEGA WATTS) 2020-2030
TABLE 179 UAE PACKAGED SUBSTATION MARKET BY APPLICATION (USD BILLION) 2020-2030
TABLE 180 UAE PACKAGED SUBSTATION MARKET BY APPLICATION (MEGA WATTS) 2020-2030
TABLE 181 SAUDI ARABIA PACKAGED SUBSTATION MARKET BY TYPE (USD BILLION) 2020-2030
TABLE 182 SAUDI ARABIA PACKAGED SUBSTATION MARKET BY TYPE (MEGA WATTS) 2020-2030
TABLE 183 SAUDI ARABIA PACKAGED SUBSTATION MARKET BY VOLTAGE (USD BILLION) 2020-2030
TABLE 184 SAUDI ARABIA PACKAGED SUBSTATION MARKET BY VOLTAGE (MEGA WATTS) 2020-2030
TABLE 185 SAUDI ARABIA PACKAGED SUBSTATION MARKET BY APPLICATION (USD BILLION) 2020-2030
TABLE 186 SAUDI ARABIA PACKAGED SUBSTATION MARKET BY APPLICATION (MEGA WATTS) 2020-2030
TABLE 187 SOUTH AFRICA PACKAGED SUBSTATION MARKET BY TYPE (USD BILLION) 2020-2030
TABLE 188 SOUTH AFRICA PACKAGED SUBSTATION MARKET BY TYPE (MEGA WATTS) 2020-2030
TABLE 189 SOUTH AFRICA PACKAGED SUBSTATION MARKET BY VOLTAGE (USD BILLION) 2020-2030
TABLE 190 SOUTH AFRICA PACKAGED SUBSTATION MARKET BY VOLTAGE (MEGA WATTS) 2020-2030
TABLE 191 SOUTH AFRICA PACKAGED SUBSTATION MARKET BY APPLICATION (USD BILLION) 2020-2030
TABLE 192 SOUTH AFRICA PACKAGED SUBSTATION MARKET BY APPLICATION (MEGA WATTS) 2020-2030
TABLE 193 REST OF MIDDLE EAST AND AFRICA PACKAGED SUBSTATION MARKET BY TYPE (USD BILLION) 2020-2030
TABLE 194 REST OF MIDDLE EAST AND AFRICA PACKAGED SUBSTATION MARKET BY TYPE (MEGA WATTS) 2020-2030
TABLE 195 REST OF MIDDLE EAST AND AFRICA PACKAGED SUBSTATION MARKET BY VOLTAGE (USD BILLION) 2020-2030
TABLE 196 REST OF MIDDLE EAST AND AFRICA PACKAGED SUBSTATION MARKET BY VOLTAGE (MEGA WATTS) 2020-2030
TABLE 197 REST OF MIDDLE EAST AND AFRICA PACKAGED SUBSTATION MARKET BY APPLICATION (USD BILLION) 2020-2030
TABLE 198 REST OF MIDDLE EAST AND AFRICA PACKAGED SUBSTATION MARKET BY APPLICATION (MEGA WATTS) 2020-2030
LIST OF FIGURES
FIGURE 1 MARKET DYNAMICS
FIGURE 2 MARKET SEGMENTATION
FIGURE 3 REPORT TIMELINES: YEARS CONSIDERED
FIGURE 4 DATA TRIANGULATION
FIGURE 5 BOTTOM-UP APPROACH
FIGURE 6 TOP-DOWN APPROACH
FIGURE 7 RESEARCH FLOW
FIGURE 8 GLOBAL PACKAGED SUBSTATION MARKET BY TYPE (USD BILLION) 2020-2030
FIGURE 9 GLOBAL PACKAGED SUBSTATION MARKET BY VOLTAGE (USD BILLION) 2020-2030
FIGURE 10 GLOBAL PACKAGED SUBSTATION MARKET BY APPLICATION (USD BILLION) 2020-2030
FIGURE 11 GLOBAL PACKAGED SUBSTATION MARKET BY REGION (USD BILLION) 2020-2030
FIGURE 12 PORTER’S FIVE FORCES MODEL
FIGURE 13 GLOBAL PACKAGED SUBSTATION MARKET BY TYPE (USD BILLION) 2022
FIGURE 14 GLOBAL PACKAGED SUBSTATION MARKET BY VOLTAGE (USD BILLION) 2022
FIGURE 15 GLOBAL PACKAGED SUBSTATION MARKET BY APPLICATION (USD BILLION) 2022
FIGURE 16 GLOBAL PACKAGED SUBSTATION MARKET BY REGION (USD BILLION) 2022
FIGURE 17 MARKET SHARE ANALYSIS
FIGURE 18 ABB LTD.: COMPANY SNAPSHOT
FIGURE 19 SIEMENS AG: COMPANY SNAPSHOT
FIGURE 20 SCHNEIDER ELECTRIC SE: COMPANY SNAPSHOT
FIGURE 21 GENERAL ELECTRIC COMPANY: COMPANY SNAPSHOT
FIGURE 22 EATON CORPORATION PLC: COMPANY SNAPSHOT
FIGURE 23 CROMPTON GREAVES LTD.: COMPANY SNAPSHOT
FIGURE 24 WEG INDUSTRIES: COMPANY SNAPSHOT
FIGURE 25 LUCY ELECTRIC LTD: COMPANY SNAPSHOT
FIGURE 26 TOSHIBA CORPORATION: COMPANY SNAPSHOT
FIGURE 27 ALSTOM: COMPANY SNAPSHOT
FIGURE 28 MATELEC: COMPANY SNAPSHOT
FIGURE 29 LITTLEFUSE INC.: COMPANY SNAPSHOT
DOWNLOAD FREE SAMPLE REPORT
License Type
SPEAK WITH OUR ANALYST
Want to know more about the report or any specific requirement?
WANT TO CUSTOMIZE THE REPORT?
Our Clients Speak
We asked them to research ‘ Equipment market’ all over the world, and their whole arrangement was helpful to us. thehealthanalytics.com insightful analysis and reports contributed to our current analysis and in creating a future strategy. Besides, the te
Yosuke Mitsui
Senior Associate Construction Equipment Sales & Marketing
We asked them to research ‘Equipment market’ all over the world, and their whole arrangement was helpful to us. thehealthanalytics.com insightful analysis and reports contributed to our current analysis and in creating a future strategy. Besides, the te


