

Base Year Value ()
x.x %
x.x %
CAGR ()
x.x %
x.x %
Forecast Year Value ()
x.x %
x.x %
Historical Data Period
Largest Region
Forecast Period
Mercado de terapia génica por tipo de vector (vector viral y vector no viral), tipo de gen (antígeno, citocina, supresor de tumores, suicidio, deficiencia, factores de crecimiento, receptores y otros) y aplicación (trastornos oncológicos, enfermedades raras, enfermedades cardiovasculares, trastornos neurológicos, enfermedades infecciosas y otras enfermedades), y por región, tendencias globales y pronóstico de 2022 a 2029
Instant access to hundreds of data points and trends
- Market estimates from 2014-2029
- Competitive analysis, industry segmentation, financial benchmarks
- Incorporates SWOT, Porter's Five Forces and risk management frameworks
- PDF report or online database with Word, Excel and PowerPoint export options
- 100% money back guarantee
Descripción general del mercado de la terapia génica
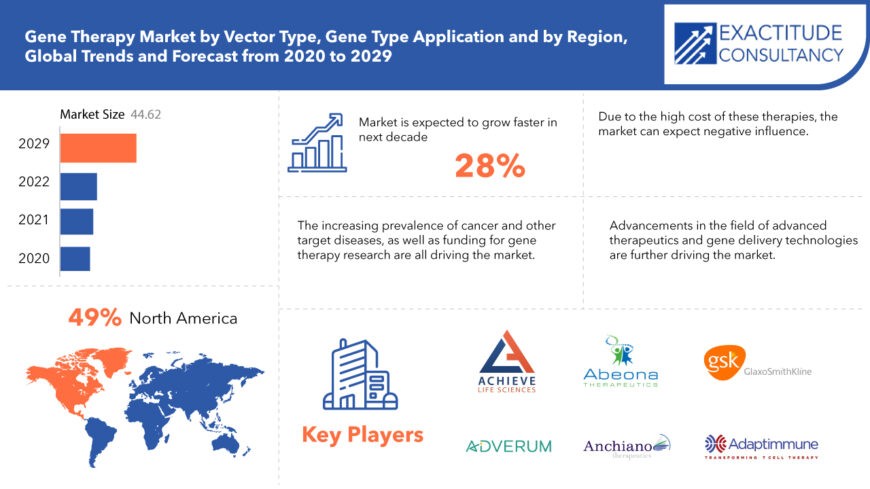
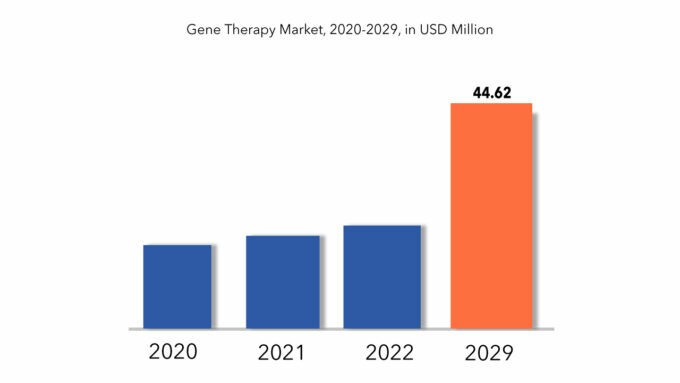
Se estima que el tamaño del mercado mundial de terapia génica fue de USD 4.83 mil millones en 2020 y se proyecta que alcance los USD 44.6 mil millones para 2029, con una CAGR del 28 %.
La terapia génica consiste en una intervención médica destinada a tratar trastornos genéticos mediante la introducción, eliminación o alteración de genes específicos en las células de un paciente . Este enfoque terapéutico resulta prometedor para abordar enfermedades hereditarias como la fibrosis quística o el cáncer, ya que actúa directamente sobre la causa genética subyacente. Representa una vía potencial para la medicina personalizada y ha mostrado resultados prometedores en ensayos clínicos.
Antes de recibir la aprobación, los productos de terapia génica se someten a una evaluación regulatoria exhaustiva. Funcionan a nivel genético y producen efectos terapéuticos que son comparativamente más eficaces y duraderos que los medicamentos tradicionales. El creciente número de aprobaciones de productos de terapia génica es indicativo de esta importante ventaja. Entre 2021 y 2023, la FDA estadounidense aprobó más de 10 productos de este tipo, y se espera que una importante cartera de productos obtenga la aprobación final en los próximos años, lo que impulsará el crecimiento del mercado.
El campo de las terapias celulares y genéticas ha experimentado un aumento de los esfuerzos de investigación y desarrollo. Este aumento se debe principalmente al potencial sustancial de estas terapias para abordar numerosas necesidades no satisfechas, en particular en neurología, donde los tratamientos efectivos siguen siendo difíciles de conseguir. En consecuencia, existe una oportunidad considerable para que las empresas farmacéuticas y biotecnológicas inviertan en el desarrollo y la comercialización de terapias celulares y genéticas innovadoras. Además, estas terapias ofrecen efectos terapéuticos específicos, lo que las hace atractivas para su adopción con el objetivo de reducir los costos de tratamiento a largo plazo. Por lo tanto, la creciente demanda de terapias celulares y genéticas, impulsada por sus beneficios asociados, presenta una oportunidad significativa dentro del mercado de la terapia génica.
[título id="attachment_3746" align="aligncenter" width="680"]
Gene Therapy Market Segment Analysis
Gene therapy market is segmented on the basis of vector type, gene type, application and by region. The market is divided into two types of vectors: viral vector and nonviral vector. Due to easy modifications of various viruses such as Lentivirus, Adeno-Associated Virus (AAV), Retrovirus, and Gamma Retrovirus to deliver gene therapy medications, as well as improvements in DNA, RNA, and oncolytic viral vectors gene therapy, the viral vector sector contributed the most to market growth. However, due to advancements in physicochemical approaches such as physical methods and chemical methods of nonviral vector for gene therapies during preclinical and clinical trials for the treatment of various diseases, the nonviral vector segment is expected to grow at the fastest rate during the forecast period.
Oncological problems, uncommon diseases, cardiovascular diseases, neurological disorders, infectious disease, and other applications are covered in the study. Because of the rising frequency of cancer globally and the increasing regulatory approval of gene therapy for cancer, the oncological diseases sector contributed the most to market growth. However, due to a growth in the number of clinical trials of gene therapies for the treatment of various disorders, the cardiovascular diseases segment is expected to develop at a profitable pace throughout the projection period.
Gene Therapy Market Key Players
The key players operating in the global gene therapy market include Adaptimmune Therapeutics Plc., Anchiano Therapeutics Ltd., Achieve Life Sciences, Inc., Adverum Biotechnologies, Inc., Abeona Therapeutics Inc., Applied Genetic Technologies Corporation, Arbutus Biopharma Corporation, Audentes Therapeutics, Inc., AveXis, Inc., Bluebird Bio, Inc., Celgene Corporation, CRISPR Therapeutics AG, Editas Medicine, Inc., Editas Medicine, Inc., GlaxoSmithKline Plc., Intellia Therapeutics, Inc., Merck & Co., Inc., Novartis AG, REGENXBIO Inc., Spark Therapeutics, Inc., Sangamo Therapeutics, Inc., Uniqure N. V., Voyager Therapeutics, Inc. Other prominent players in the value chain (companies not profiled in the report) includes Amgen, Epeius Biotechnologies, Sanofi, Juno Therapeutics, and Advantagene.
- Adaptimmune is a clinical-stage biopharmaceutical company focused on the development of novel cancer immunotherapy products for cancer patients.
- Anchiano is a clinical-stage biopharmaceutical company focused on the discovery and development of novel therapies to treat cancer.
- Achieve Life Sciences is a specialty pharmaceutical company committed to addressing the global smoking health and nicotine addiction epidemic through the development and commercialization of cytisinicline.
Who Should Buy? Or Key stakeholders
- Pharmaceutical Industry
- Chemical Industry
- Healthcare Industry
- Hospitals and Clinics
- Clinical Laboratories
- Investors
- Manufacturing companies
- Scientific Research and Development
- End user companies
- Others
Key Takeaways:
- The global gene therapy market size is projected to grow at a CAGR of 28% for the forecasted year.
- The gene silencing therapy accounted for the largest share of the type segment in overall gene therapy industry.
- The neurology segment dominated the therapeutic area segment in overall gene therapy industry.
- North America was the largest market for overall gene therapy industry in 2022 and also during the forecast period.
- A notable trend in gene therapy is the increasing number of approvals for products targeting genetic disorders, demonstrating its growing acceptance and efficacy.
Gene Therapy Market Regional Analysis
The global gene therapy market by region includes North America, Asia-Pacific (APAC), Europe, South America, and Middle East & Africa (MEA).
- North America: includes the US, Canada, Mexico
- Asia Pacific: includes China, Japan, South Korea, India, Australia, ASEAN and Rest of APAC
- Europe: includes UK, Germany, France, Italy, Spain, Russia, and Rest of Europe
- South America: includes Brazil, Argentina and Rest of South America
- Middle East & Africa: includes Turkey, UAE, Saudi Arabia, South Africa, and Rest of MEA
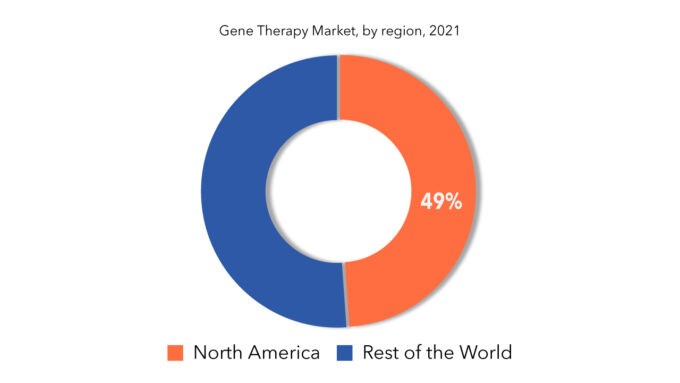
Because of the high prevalence rate of cancer, the presence of high disposable income, and an increase in funding for R&D activities associated with gene therapy, North America accounted for the largest market share in the gene therapy market, and this trend is expected to continue during the forecast period. However, due to an increase in the number of persons susceptible to different chronic diseases, Asia-Pacific is predicted to expand the fastest throughout the projection period.
Key Market Segments: Gene Therapy Market
Gene Therapy Market By Vector Type, 2020-2029, (USD Million)- Viral Vector
- Non-Viral Vector
- Antigen
- Cytokine
- Tumor Suppressor
- Suicide
- Deficiency
- Growth Factors
- Receptors
- Oncological Disorders
- Rare Diseases
- Cardiovascular Diseases
- Neurological Disorders
- Infectious Disease
- North America
- Europe
- Asia Pacific
- South America
- Middle East And Africa
Key Question Answered
- What are the growth opportunities related to the adoption of gene therapy across major regions in the future?
- What are the new trends and advancements in the gene therapy market?
- Which product categories are expected to have highest growth rate in the gene therapy market?
- Which are the key factors driving the gene therapy market?
- What will the market growth rate, growth momentum or acceleration the market carries during the forecast period?
- Introducción
- Definición de mercado
- Segmentación del mercado
- Cronología de la investigación
- Supuestos y limitaciones
- Metodología de la investigación
- Minería de datos
- Investigación secundaria
- Investigación primaria
- Subject-Matter Experts’ Advice
- Quality Checks
- Final Review
- Data Triangulation
- Bottom-Up Approach
- Top-Down Approach
- Research Flow
- Data Sources
- Minería de datos
- Executive Summary
- Market Overview
- Global Gene Therapy Market Outlook
- Market Drivers
- Market Restraints
- Market Opportunities
- Impact of Covid-19 On Gene Therapy Market
- Porter’s five forces model
- Threat from new entrants
- Threat from substitutes
- Bargaining power of suppliers
- Bargaining power of customers
- Degree of competition
- Industry value chain Analysis
- Global Gene Therapy Market Outlook
- Global Gene Therapy Market by Vector Type (USD Million)
- Viral Vector
- Non-Viral Vector
- Global Gene Therapy Market by Gene Type (USD Million)
- Antigen
- Cytokine
- Tumor Suppressor
- Suicide
- Deficiency
- Growth Factors
- Receptors
- Global Gene Therapy Market by Application (USD Million)
- Oncological Disorders
- Rare Diseases
- Cardiovascular Diseases
- Neurological Disorders
- Infectious Disease
- Global Gene Therapy Market by Region (USD Million)
- North America
- US
- Canada
- Mexico
- South America
- Brazil
- Argentina
- Colombia
- Rest Of South America
- Europe
- Germany
- UK
- France
- Italy
- Spain
- Russia
- Rest Of Europe
- Asia Pacific
- India
- China
- Japan
- South Korea
- Australia
- South-East Asia
- Rest Of Asia Pacific
- Middle East and Africa
- UAE
- Saudi Arabia
- South Africa
- Rest Of Middle East and Africa
- North America
- Company Profiles* (Business Overview, Company Snapshot, Products Offered, Recent Developments)
- Adaptimmune Therapeutics Plc.
- Anchiano Therapeutics Ltd.
- Achieve Life Sciences, Inc.
- Adverum Biotechnologies, Inc.
- Abeona Therapeutics Inc.
- Applied Genetic Technologies Corporation
- Arbutus Biopharma Corporation
- Audentes Therapeutics, Inc.
- AveXis, Inc.
- Bluebird Bio, Inc.
- Epeius Biotechnologies
- Sanofi *The Company List Is Indicative
LIST OF TABLES
TABLE 1 GLOBAL GENE THERAPY MARKET BY VECTOR TYPE (USD MILLIONS) 2020-2029
TABLE 2 GLOBAL GENE THERAPY MARKET BY APPLICATION (USD MILLIONS) 2020-2029
TABLE 3 GLOBAL GENE THERAPY MARKET BY GENE TYPE (USD MILLIONS) 2020-2029
TABLE 4 GLOBAL GENE THERAPY MARKET BY REGION (USD MILLIONS) 2020-2029
TABLE 5 US GENE THERAPY MARKET BY VECTOR TYPE (USD MILLIONS) 2020-2029
TABLE 6 US GENE THERAPY MARKET BY APPLICATION (USD MILLIONS) 2020-2029
TABLE 7 US GENE THERAPY MARKET BY GENE TYPE (USD MILLIONS) 2020-2029
TABLE 8 CANADA GENE THERAPY MARKET BY VECTOR TYPE (USD MILLIONS) 2020-2029
TABLE 9 CANADA GENE THERAPY MARKET BY APPLICATION (USD MILLIONS) 2020-2029
TABLE 10 CANADA GENE THERAPY MARKET BY GENE TYPE (USD MILLIONS) 2020-2029
TABLE 11 MEXICO GENE THERAPY MARKET BY VECTOR TYPE (USD MILLIONS) 2020-2029
TABLE 12 MEXICO GENE THERAPY MARKET BY APPLICATION (USD MILLIONS) 2020-2029
TABLE 13 MEXICO GENE THERAPY MARKET BY GENE TYPE (USD MILLIONS) 2020-2029
TABLE 14 BRAZIL GENE THERAPY MARKET BY VECTOR TYPE (USD MILLIONS) 2020-2029
TABLE 15 BRAZIL GENE THERAPY MARKET BY APPLICATION (USD MILLIONS) 2020-2029
TABLE 16 BRAZIL GENE THERAPY MARKET BY GENE TYPE (USD MILLIONS) 2020-2029
TABLE 17 ARGENTINA GENE THERAPY MARKET BY VECTOR TYPE (USD MILLIONS) 2020-2029
TABLE 18 ARGENTINA GENE THERAPY MARKET BY APPLICATION (USD MILLIONS) 2020-2029
TABLE 19 ARGENTINA GENE THERAPY MARKET BY GENE TYPE (USD MILLIONS) 2020-2029
TABLE 20 COLOMBIA GENE THERAPY MARKET BY VECTOR TYPE (USD MILLIONS) 2020-2029
TABLE 21 COLOMBIA GENE THERAPY MARKET BY APPLICATION (USD MILLIONS) 2020-2029
TABLE 22 COLOMBIA GENE THERAPY MARKET BY GENE TYPE (USD MILLIONS) 2020-2029
TABLE 23 REST OF SOUTH AMERICA GENE THERAPY MARKET BY VECTOR TYPE (USD MILLIONS) 2020-2029
TABLE 24 REST OF SOUTH AMERICA GENE THERAPY MARKET BY APPLICATION (USD MILLIONS) 2020-2029
TABLE 25 REST OF SOUTH AMERICA GENE THERAPY MARKET BY GENE TYPE (USD MILLIONS) 2020-2029
TABLE 26 INDIA GENE THERAPY MARKET BY VECTOR TYPE (USD MILLIONS) 2020-2029
TABLE 27 INDIA GENE THERAPY MARKET BY APPLICATION (USD MILLIONS) 2020-2029
TABLE 28 INDIA GENE THERAPY MARKET BY GENE TYPE (USD MILLIONS) 2020-2029
TABLE 29 CHINA GENE THERAPY MARKET BY VECTOR TYPE (USD MILLIONS) 2020-2029
TABLE 30 CHINA GENE THERAPY MARKET BY APPLICATION (USD MILLIONS) 2020-2029
TABLE 31 CHINA GENE THERAPY MARKET BY GENE TYPE (USD MILLIONS) 2020-2029
TABLE 32 JAPAN GENE THERAPY MARKET BY VECTOR TYPE (USD MILLIONS) 2020-2029
TABLE 33 JAPAN GENE THERAPY MARKET BY APPLICATION (USD MILLIONS) 2020-2029
TABLE 34 JAPAN GENE THERAPY MARKET BY GENE TYPE (USD MILLIONS) 2020-2029
TABLE 35 SOUTH KOREA GENE THERAPY MARKET BY VECTOR TYPE (USD MILLIONS) 2020-2029
TABLE 36 SOUTH KOREA GENE THERAPY MARKET BY APPLICATION (USD MILLIONS) 2020-2029
TABLE 37 SOUTH KOREA GENE THERAPY MARKET BY GENE TYPE (USD MILLIONS) 2020-2029
TABLE 38 AUSTRALIA GENE THERAPY MARKET BY VECTOR TYPE (USD MILLIONS) 2020-2029
TABLE 39 AUSTRALIA GENE THERAPY MARKET BY APPLICATION (USD MILLIONS) 2020-2029
TABLE 40 AUSTRALIA GENE THERAPY MARKET BY GENE TYPE (USD MILLIONS) 2020-2029
TABLE 41 SOUTH-EAST ASIA GENE THERAPY MARKET BY VECTOR TYPE (USD MILLIONS) 2020-2029
TABLE 42 SOUTH-EAST ASIA GENE THERAPY MARKET BY APPLICATION (USD MILLIONS) 2020-2029
TABLE 43 SOUTH-EAST ASIA GENE THERAPY MARKET BY GENE TYPE (USD MILLIONS) 2020-2029
TABLE 44 REST OF ASIA PACIFIC GENE THERAPY MARKET BY VECTOR TYPE (USD MILLIONS) 2020-2029
TABLE 45 REST OF ASIA PACIFIC GENE THERAPY MARKET BY APPLICATION (USD MILLIONS) 2020-2029
TABLE 46 REST OF ASIA PACIFIC GENE THERAPY MARKET BY GENE TYPE (USD MILLIONS) 2020-2029
TABLE 47 GERMANY GENE THERAPY MARKET BY VECTOR TYPE (USD MILLIONS) 2020-2029
TABLE 48 GERMANY GENE THERAPY MARKET BY APPLICATION (USD MILLIONS) 2020-2029
TABLE 49 GERMANY GENE THERAPY MARKET BY GENE TYPE (USD MILLIONS) 2020-2029
TABLE 50 UK GENE THERAPY MARKET BY VECTOR TYPE (USD MILLIONS) 2020-2029
TABLE 51 UK GENE THERAPY MARKET BY APPLICATION (USD MILLIONS) 2020-2029
TABLE 52 UK GENE THERAPY MARKET BY GENE TYPE (USD MILLIONS) 2020-2029
TABLE 53 FRANCE GENE THERAPY MARKET BY VECTOR TYPE (USD MILLIONS) 2020-2029
TABLE 54 FRANCE GENE THERAPY MARKET BY APPLICATION (USD MILLIONS) 2020-2029
TABLE 55 FRANCE GENE THERAPY MARKET BY GENE TYPE (USD MILLIONS) 2020-2029
TABLE 56 ITALY GENE THERAPY MARKET BY VECTOR TYPE (USD MILLIONS) 2020-2029
TABLE 57 ITALY GENE THERAPY MARKET BY APPLICATION (USD MILLIONS) 2020-2029
TABLE 58 ITALY GENE THERAPY MARKET BY GENE TYPE (USD MILLIONS) 2020-2029
TABLE 59 SPAIN GENE THERAPY MARKET BY VECTOR TYPE (USD MILLIONS) 2020-2029
TABLE 60 SPAIN GENE THERAPY MARKET BY APPLICATION (USD MILLIONS) 2020-2029
TABLE 61 SPAIN GENE THERAPY MARKET BY GENE TYPE (USD MILLIONS) 2020-2029
TABLE 62 RUSSIA GENE THERAPY MARKET BY VECTOR TYPE (USD MILLIONS) 2020-2029
TABLE 63 RUSSIA GENE THERAPY MARKET BY APPLICATION (USD MILLIONS) 2020-2029
TABLE 64 RUSSIA GENE THERAPY MARKET BY GENE TYPE (USD MILLIONS) 2020-2029
TABLE 65 REST OF EUROPE GENE THERAPY MARKET BY VECTOR TYPE (USD MILLIONS) 2020-2029
TABLE 66 REST OF EUROPE GENE THERAPY MARKET BY APPLICATION (USD MILLIONS) 2020-2029
TABLE 67 REST OF EUROPE GENE THERAPY MARKET BY GENE TYPE (USD MILLIONS) 2020-2029
TABLE 68 UAE GENE THERAPY MARKET BY VECTOR TYPE (USD MILLIONS) 2020-2029
TABLE 69 UAE GENE THERAPY MARKET BY APPLICATION (USD MILLIONS) 2020-2029
TABLE 70 UAE GENE THERAPY MARKET BY GENE TYPE (USD MILLIONS) 2020-2029
TABLE 71 SAUDI ARABIA GENE THERAPY MARKET BY VECTOR TYPE (USD MILLIONS) 2020-2029
TABLE 72 SAUDI ARABIA GENE THERAPY MARKET BY APPLICATION (USD MILLIONS) 2020-2029
TABLE 73 SAUDI ARABIA GENE THERAPY MARKET BY GENE TYPE (USD MILLIONS) 2020-2029
TABLE 74 SOUTH AFRICA GENE THERAPY MARKET BY VECTOR TYPE (USD MILLIONS) 2020-2029
TABLE 75 SOUTH AFRICA GENE THERAPY MARKET BY APPLICATION (USD MILLIONS) 2020-2029
TABLE 76 SOUTH AFRICA GENE THERAPY MARKET BY GENE TYPE (USD MILLIONS) 2020-2029
TABLE 77 REST OF MIDDLE EAST AND AFRICA GENE THERAPY MARKET BY VECTOR TYPE (USD MILLIONS) 2020-2029
TABLE 78 REST OF MIDDLE EAST AND AFRICA GENE THERAPY MARKET BY APPLICATION (USD MILLIONS) 2020-2029
TABLE 79 REST OF MIDDLE EAST AND AFRICA GENE THERAPY MARKET BY GENE TYPE (USD MILLIONS) 2020-2029
LIST OF FIGURES
FIGURE 1 MARKET DYNAMICS
FIGURE 2 MARKET SEGMENTATION
FIGURE 3 REPORT TIMELINES: YEARS CONSIDERED
FIGURE 4 DATA TRIANGULATION
FIGURE 5 BOTTOM-UP APPROACH
FIGURE 6 TOP-DOWN APPROACH
FIGURE 7 RESEARCH FLOW
FIGURE 8 GLOBAL GENE THERAPY MARKET BY VECTOR TYPE, USD MILLION, 2019-2028
FIGURE 9 GLOBAL GENE THERAPY MARKET BY GENE TYPE, USD MILLION, 2019-2028
FIGURE 10 GLOBAL GENE THERAPY MARKET BY APPLICATION, USD MILLION, 2019-2028
FIGURE 11 GLOBAL GENE THERAPY MARKET BY REGION, USD MILLION, 2019-2028
FIGURE 12 PORTER’S FIVE FORCES MODEL
FIGURE 13 NORTH AMERICA GENE THERAPY MARKET SNAPSHOT
FIGURE 14 EUROPE GENE THERAPY MARKET SNAPSHOT
FIGURE 15 ASIA PACIFIC GENE THERAPY MARKET SNAPSHOT
FIGURE 16 SOUTH AMERICA GENE THERAPY MARKET SNAPSHOT
FIGURE 17 MIDDLE EAST & AFRICA GENE THERAPY MARKET SNAPSHOT
FIGURE 18 ADAPTIMMUNE THERAPEUTICS PLC.: COMPANY SNAPSHOT
FIGURE 19 ANCHIANO THERAPEUTICS LTD.: COMPANY SNAPSHOT
FIGURE 20 ACHIEVE LIFE SCIENCES, INC.: COMPANY SNAPSHOT
FIGURE 21 ADVERUM BIOTECHNOLOGIES, INC.: COMPANY SNAPSHOT
FIGURE 22 ABEONA THERAPEUTICS INC.: COMPANY SNAPSHOT
FIGURE 23 APPLIED GENETIC TECHNOLOGIES CORPORATION: COMPANY SNAPSHOT
FIGURE 24 ARBUTUS BIOPHARMA CORPORATION: COMPANY SNAPSHOT
FIGURE 25 AUDENTES THERAPEUTICS, INC.: COMPANY SNAPSHOT
FIGURE 26 AVEXIS, INC.: COMPANY SNAPSHOT
FIGURE 27 BLUEBIRD BIO, INC.: COMPANY SNAPSHOT
FIGURE 28 EPEIUS BIOTECHNOLOGIES: COMPANY SNAPSHOT
DOWNLOAD FREE SAMPLE REPORT
License Type
SPEAK WITH OUR ANALYST
Want to know more about the report or any specific requirement?
WANT TO CUSTOMIZE THE REPORT?
Our Clients Speak
We asked them to research ‘ Equipment market’ all over the world, and their whole arrangement was helpful to us. thehealthanalytics.com insightful analysis and reports contributed to our current analysis and in creating a future strategy. Besides, the te
Yosuke Mitsui
Senior Associate Construction Equipment Sales & Marketing
We asked them to research ‘Equipment market’ all over the world, and their whole arrangement was helpful to us. thehealthanalytics.com insightful analysis and reports contributed to our current analysis and in creating a future strategy. Besides, the te


