

Base Year Value ()
x.x %
x.x %
CAGR ()
x.x %
x.x %
Forecast Year Value ()
x.x %
x.x %
Historical Data Period
Largest Region
Forecast Period
Mercado de diluyentes reactivos por tipo (alifáticos, aromáticos y cicloalifáticos), usuario final (construcción, automoción, electricidad y electrónica, energía eólica y otros), aplicación (pinturas y revestimientos, compuestos, adhesivos y selladores y otros (fundición eléctrica, encapsulación eléctrica y fibras)) y región (Norteamérica, Europa, Asia Pacífico, Sudamérica, Oriente Medio y África), tendencias globales y pronóstico de 2022 a 2029
Instant access to hundreds of data points and trends
- Market estimates from 2014-2029
- Competitive analysis, industry segmentation, financial benchmarks
- Incorporates SWOT, Porter's Five Forces and risk management frameworks
- PDF report or online database with Word, Excel and PowerPoint export options
- 100% money back guarantee
Descripción general del mercado de diluyentes reactivos
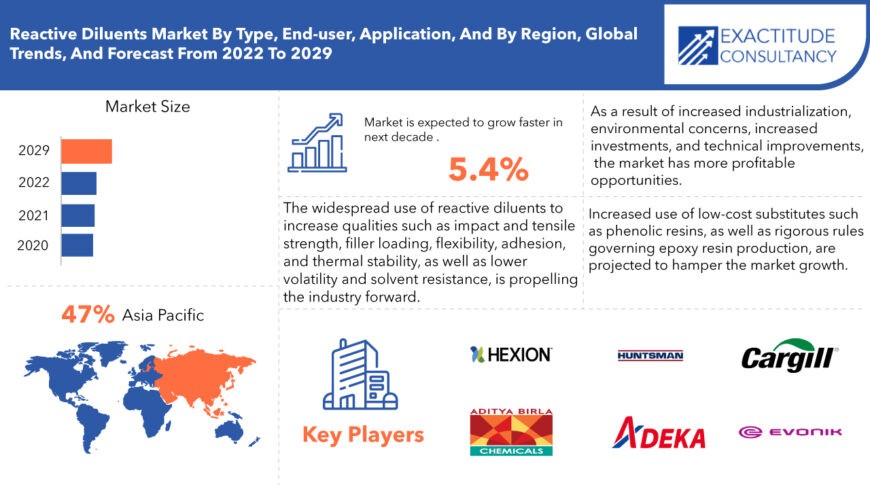
El tamaño del mercado global de diluyentes reactivos fue de USD 952,00 millones en 2020 y se proyecta que alcance los USD 1.528,28 millones para 2029, exhibiendo una CAGR del 5,4% durante el período de pronóstico.
Los diluyentes reactivos se utilizan para reducir la viscosidad de las sustancias. No solo reducen la viscosidad, sino que también ayudan a la polimerización de la sustancia a la que se añaden. Para aumentar la flexibilidad y las cualidades de manipulación de la resina epoxi , se utilizan habitualmente diluyentes reactivos.
El diluyente reactivo está compuesto de éteres de glicidilo derivados de alquilfenoles alifáticos de cadena corta o alcoholes con una viscosidad baja. Esto se utiliza para reducir la viscosidad de las resinas epoxi y hacer que sean más fáciles de manejar y procesar en una variedad de aplicaciones. Los diluyentes reactivos también ayudan con cualidades que incluyen estabilidad térmica, resistencia a la tracción, carga de filtro y adhesión. Las resinas epoxi se utilizan ampliamente en la producción de recubrimientos, pinturas, compuestos , adhesivos y selladores . Los recubrimientos y pinturas a base de solventes y a base de agua requieren diluyentes reactivos. La liberación de moléculas orgánicas volátiles se reduce mediante diluyentes reactivos (VOC).
| ATRIBUTO | DETALLES |
| Periodo de estudio | 2020-2029 |
| Año base | 2021 |
| Año estimado | 2022 |
| Año pronosticado | 2022-2029 |
| Periodo histórico | 2018-2020 |
| Unidad | Valor (millones de USD, kilotones) |
| Segmentación | Por tipo, por usuario final, por aplicación, por región |
| Por tipo |
|
| Por el usuario final |
|
| Por aplicación |
|
| Por región |
|
Se estima que la creciente demanda de diluyentes reactivos en diferentes aplicaciones, como pinturas, revestimientos y materiales compuestos, es un factor importante que impulsará el crecimiento del mercado potencial en los próximos 10 años. Además, se prevé que la creciente demanda de un diluyente reactivo en la producción de adhesivos y selladores impulsará el crecimiento de los ingresos en el mercado potencial durante los próximos diez años.
Uno de los principales factores que impulsan el crecimiento del mercado de diluyentes reactivos es el aumento del uso de materiales compuestos en todo el mundo. El uso generalizado de diluyentes reactivos para aumentar cualidades como la resistencia al impacto y a la tracción, la carga de relleno, la flexibilidad, la adhesión y la estabilidad térmica, así como una menor volatilidad y resistencia a los disolventes, está impulsando la industria hacia adelante. El mercado también se ve influenciado por un aumento de la demanda del producto en adhesivos y selladores, polímeros y compuestos, y formulaciones de pinturas y revestimientos para reducir la emisión de compuestos orgánicos volátiles (COV). Además, el mercado de diluyentes reactivos se beneficia de la rápida industrialización, las crecientes preocupaciones ambientales, el aumento de las inversiones y la expansión del sector de la construcción en todo el mundo. Además, en el período de pronóstico de 2022 a 2029, los avances tecnológicos brindan oportunidades rentables para los actores del mercado.
Por otra parte, se prevé que el aumento del uso de sustitutos de bajo coste, como las resinas fenólicas, así como las estrictas normas que rigen la producción de resina epoxi, frenarán la expansión del mercado. Se espera que el mercado de diluyentes reactivos se vea desafiado por los precios impredecibles de las materias primas de resina epoxi durante el período de pronóstico de 2022 a 2029.
Además, es probable que la creciente demanda de diluyentes reactivos por parte de las industrias automotriz, de construcción y naval impulse el crecimiento del mercado objetivo durante el período de pronóstico. Otros factores que se prevé que impulsen el crecimiento del mercado potencial incluyen la creciente demanda de materiales con alta resistencia mecánica, resistencia a la corrosión y propiedades livianas, así como mayores inversiones en I+D y el desarrollo de productos innovadores.
Sin embargo, se prevé que el uso creciente de sustitutos de bajo costo, como las resinas fenólicas, así como los estrictos requisitos reglamentarios que rigen el uso de resinas epoxi, limiten en cierta medida el crecimiento del mercado global.
[título id="attachment_8086" align="aligncenter" width="870"]
Frequently Asked Questions
• What is the worth of global reactive diluents market?
The reactive diluents market size had crossed USD 952.00 Million in 2020 and will observe a CAGR of more than 5.4% up to 2029 driven by the increased use of composite materials and increase in demand for the product in adhesives and sealants, polymers, and composites, and paints and coatings.
• What is the size of the Asia Pacific reactive diluents industry?
The Asia Pacific held more than 47% of the reactive diluents market revenue share in 2020 and will witness expansion as the rising of various end-use industries, including construction, automotive, electrical & electronics, and wind energy, and the technological development of reactive diluents accelerates in countries, including China, Japan, India, and Australia.
• What are the upcoming trends in the reactive diluents market, globally?
The upcoming trends are likely rising demand for reactive diluent from the automotive, building & construction, and marine industries boosting market expansion during the projection period
• What is the CAGR of the reactive diluents market?
The global reactive diluents market registered a CAGR of 5.4% from 2022 to 2029. Based on type, the aliphatic type of reactive diluent segment is expected to have the biggest market segment was the highest revenue contributor to the market.
• Which are the top companies to hold the market share in the reactive diluents market?
Key players profiled in the report include Hexion, Huntsman Corporation, Kukdo Chemica, Aditya Birla Chemicals, Evonik Industries, R. Coats Inks and Resin Pvt. Ltd, Adeka Corporation, Mercury Synthetic Resins, Grasim Industries Ltd., Cargill, Olin Corporation, ASH Chem, Admark Polycoats Pvt Ltd, Champion Adva Mat Private Limited, Hindusthan Speciality Chemicals Limited, Dhingra Plastic, And Plasticisers Private Limited
• What is the leading application of the reactive diluents market?
The paints and coatings category application segment is also a major driver segment of the global reactive diluents market.
• Which is the largest regional market for reactive diluents market?
Asia Pacific is accounted for the highest share of the global reactive diluents market.
Reactive diluents Market Segment Analysis
The global reactive diluents market is segmented based on type, end-user, application, and region. By type, the market is classified into aliphatic, aromatic, and cycloaliphatic. By end-user, it is divided into construction, automotive, electrical & electronics, wind energy, and others. By application, it is divided into paints & coatings, composites, adhesives & sealants, and others (electrical casting, electrical encapsulation, and fibers).
By type, the aliphatic type of reactive diluent had the highest market share of 47.0 percent in 2018 and is expected to grow at the fastest rate of 5.1 percent over the projected period. The extensive use of this category across end-user sectors ranging from the automotive to the construction industries has resulted in its high market share. Because this sort of reactive diluent has a high impact strength and is regarded as an effective diluent, it is widely used in a variety of sectors. In addition, when compared to other types of reactive diluents, the segment's growth rate is aided by its simple manufacturing process and lower raw material costs. During the forecast period, the aromatic type is expected to grow at a significant rate. It is estimated to account for almost 32.0 percent of the market by 2029, with a CAGR of 5.4 percent over the forecast period. Its increasing popularity among end-user industries, such as the construction industry, is attributed to characteristics such as effective chemical resistance. Because of the aforementioned characteristics, it is suitable for application in a variety of end-user sectors, and the expansion of these industries is increasing demand.
By end-user, automobile and construction sectors are two examples of end-user industries that are constantly growing. The growth of the aforementioned end-user sectors is driving up demand for coatings and paintings to protect against the elements while also improving aesthetic appeal. The expansion of the reactive diluent market is aided by the increase in demand for coatings and paintings.
By application, the paints and coatings category led the global market with a share of about 40% in 2019 and is expected to continue dominating the market over the forecast period. In an emerging country, this growth is attributable to increased residential and commercial activities. Furthermore, the rising demand for environmentally friendly and solvent-free anti-corrosive coatings, as well as UV curable coatings and inks, would drive the worldwide reactive diluent market share throughout the projection period.
[caption id="attachment_8087" align="alignnone" width="680"]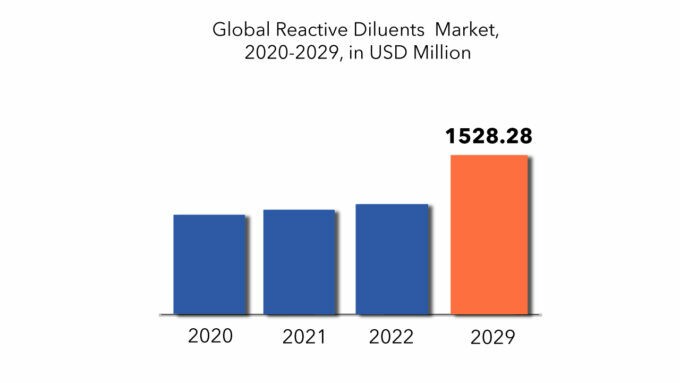
Reactive diluents Market Players
The reactive diluents market key players include Hexion, Huntsman Corporation, Kukdo Chemica, Aditya Birla Chemicals, Evonik Industries, R. Coats Inks and Resin Pvt. Ltd, Adeka Corporation, Mercury Synthetic Resins, Grasim Industries Ltd., Cargill, Olin Corporation, ASH Chem, Admark Polycoats Pvt Ltd, Champion Adva Mat Private Limited, Hindusthan Speciality Chemicals Limited, Dhingra Plastic, And Plasticisers Private Limited. To increase their market position, these businesses have implemented a variety of growth tactics. These companies are using expansion, new product development, mergers and acquisitions, and collaboration as important growth strategies to improve their product portfolio and geographical presence in order to meet the rising demand for reactive diluents from emerging economies. Industry News:- In December 2021: The Bodo Möller Chemie Group, a market leader in reactive diluents, announced that it is strengthening its partnership with Imerys, a French mining company which is a global pioneer in mineral-based speciality solutions for industry.
- In February 2020, Huntsman launched a snap cure VITROX RTM 00410 resin. This new resin will help in the high-volume manufacturing of lightweight and cost-effective composite parts. This new development will help the company meet the customer needs in the composites industry.
Who Should Buy? Or Key stakeholders
- Structural analysis
- Product industries.
- Leading companies.
- Institutional & retail players.
- Investment research firms
- Others
Reactive diluents Market Regional Analysis
The reactive diluents market by region includes North America, Asia-Pacific (APAC), Europe, South America, and Middle East & Africa (MEA).- North America: includes the US, Canada, Mexico
- Asia Pacific: includes China, Japan, South Korea, India, Australia, ASEAN and Rest of APAC
- Europe: includes UK, Germany, France, Italy, Spain, Russia, and Rest of Europe
- South America: includes Brazil, Argentina and Rest of South America
- Middle East & Africa: includes Turkey, UAE, Saudi Arabia, South Africa, and Rest of MEA
The Asia Pacific is accounted for the highest share of the global reactive diluents market. During the projection period, Asia-Pacific is expected to be the largest and fastest-growing market for reactive diluents, with China, Japan, India, and Australia being the prominent nations with promising growth prospects. The rise of various end-use industries, including construction, automotive, electrical & electronics, and wind-energy, is driving the market, which is producing massive demand for reactive diluents and a big number of reactive diluents manufacturers in the Asia-Pacific region. During the projected period, North America and Europe are expected to offer significant growth prospects.
With a market share of more than 43% in 2019, APAC dominated the reactive diluents market, followed by North America and Europe. The APAC area's growth is linked to expanding transportation, urbanization, and population, as well as a substantial industrial base throughout the region. Furthermore, the rising renewable energy sector, especially solar and wind energy, in emerging economies of APAC, including China, India, and South Korea, would boost the expansion of the reactive diluent market business in APAC during the projection period, owing to the abundance of sunshine.
[caption id="attachment_8088" align="alignnone" width="680"]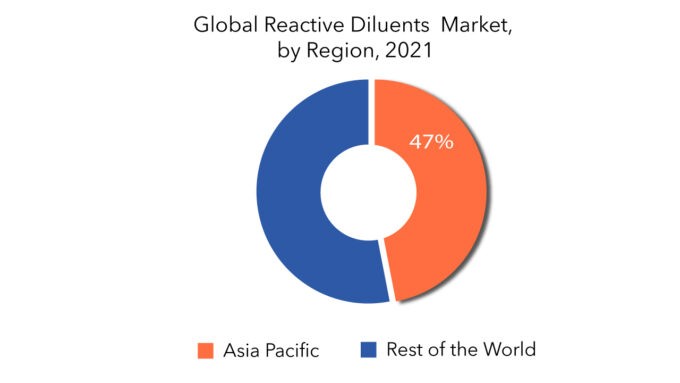
Key Market Segments: Reactive Diluent Market
Global Reactive Diluents Market By Type, 2020-2029, (USD Million), (Kilotons)- Aliphatic
- Aromatic
- Cycloaliphatic
- Construction
- Automotive
- Electrical & Electronics
- Wind-Energy
- Others
- Paints & Coatings
- Composites
- Adhesives & Sealants
- Others (Electrical Casting, Electrical Encapsulation, And Fibres)
- North America
- Europe
- Asia Pacific
- South America
- Middle East And Africa
Key Question Answered
- What is the current size of the reactive diluents market?
- What are the key factors influencing the growth of reactive diluents?
- What are the major applications for reactive diluents?
- Who are the major key players in the reactive diluents market?
- Which region will provide more business opportunities for the reactive diluents’ future?
- Which segment holds the maximum share of the reactive diluents market?
- INTRODUCCIÓN
- DEFINICIÓN DE MERCADO
- SEGMENTACIÓN DEL MERCADO
- CRONOGRAMAS DE INVESTIGACIÓN
- SUPUESTOS Y LIMITACIONES
- METODOLOGÍA DE LA INVESTIGACIÓN
- MINERÍA DE DATOS
- INVESTIGACIÓN SECUNDARIA
- INVESTIGACIÓN PRIMARIA
- ASESORAMIENTO DE EXPERTOS EN LA MATERIA
- CONTROLES DE CALIDAD
- REVISIÓN FINAL
- TRIANGULACIÓN DE DATOS
- ENFOQUE DE ABAJO HACIA ARRIBA
- ENFOQUE DE ARRIBA HACIA ABAJO
- FLUJO DE INVESTIGACIÓN
- FUENTES DE DATOS
- MINERÍA DE DATOS
- RESUMEN EJECUTIVO
- PANORAMA DEL MERCADO
- PERSPECTIVA DEL MERCADO GLOBAL DE DILUYENTES REACTIVOS
- IMPULSORES DEL MERCADO
- RESTRICCIONES DEL MERCADO
- OPORTUNIDADES DE MERCADO
- IMPACTO DEL COVID-19 EN EL MERCADO GLOBAL DE DILUYENTES REACTIVOS
- PERSPECTIVA DEL MERCADO GLOBAL DE DILUYENTES REACTIVOS
- MERCADO GLOBAL DE DILUYENTES REACTIVOS POR TIPO (MILLONES DE USD) (KILOTONELADAS)
- ALIFÁTICO
- AROMÁTICO
- CICLOALIFÁTICO
- MERCADO GLOBAL DE DILUYENTES REACTIVOS POR USUARIO FINAL (MILLONES DE USD) (KILOTONELADAS)
- CONSTRUCCIÓN
- AUTOMOTOR
- ELECTRICIDAD Y ELECTRÓNICA
- ENERGÍA EÓLICA
- OTROS
- MERCADO GLOBAL DE DILUYENTES REACTIVOS POR APLICACIÓN (MILLONES DE USD) (KILOTONELADAS)
- PINTURAS Y RECUBRIMIENTOS
- COMPUESTOS
- ADHESIVES & SEALANTS
- OTHERS (ELECTRICAL CASTING, ELECTRICAL ENCAPSULATION, AND FIBRES)
- GLOBAL REACTIVE DILUENTS MARKET BY REGION, (USD MILLION) (KILOTONS)
- INTRODUCTION
- ASIA-PACIFIC
- CHINA
- INDIA
- JAPAN
- SOUTH KOREA
- AUSTRALIA
- SOUTH-EAST ASIA
- REST OF ASIA-PACIFIC
- NORTH AMERICA
- UNITED STATES
- CANADA
- MEXICO
- EUROPE
- GERMANY
- UNITED KINGDOM
- FRANCE
- ITALY
- SPAIN
- RUSSIA
- REST OF EUROPE
- SOUTH AMERICA
- BRAZIL
- ARGENTINA
- COLOMBIA
- REST OF SOUTH AMERICA
- MIDDLE EAST AND AFRICA
- UAE
- SAUDI ARABIA
- SOUTH AFRICA
- REST OF MIDDLE EAST AND AFRICA
- COMPANY PROFILES* (BUSINESS OVERVIEW, COMPANY SNAPSHOT, TYPES OFFERED, RECENT DEVELOPMENTS)
- HEXION
- HUNTSMAN CORPORATION
- KUKDO CHEMICAL
- ADITYA BIRLA CHEMICALS
- EVONIK INDUSTRIES
- COATS INKS AND RESIN PVT. LTD
- ADEKA CORPORATION
- MERCURY SYNTHETIC RESINS
- GRASIM INDUSTRIES LTD.
- CARGILL
- OLIN CORPORATION
- ASH CHEM
- ADMARK POLYCOATS PVT LTD
- CHAMPION ADVA MAT PRIVATE LIMITED
- HINDUSTHAN SPECIALITY CHEMICALS LIMITED,
- DHINGRA PLASTIC AND PLASTISCISERS PRIVATE LIMITED (BUSINESS OVERVIEW, COMPANY SNAPSHOT, TYPES OFFERED, RECENT DEVELOPMENTS) *THE COMPANY LIST IS INDICATIVE
LIST OF TABLES
TABLE 1 GLOBAL REACTIVE DILUENTS MARKET BY TYPE (USD MILLIONS) 2020-2029
TABLE 2 GLOBAL REACTIVE DILUENTS MARKET BY TYPE (KILOTONS) 2020-2029
TABLE 3 GLOBAL REACTIVE DILUENTS MARKET BY END-USER (USD MILLIONS) 2020-2029
TABLE 4 GLOBAL REACTIVE DILUENTS MARKET BY END-USER (KILOTONS) 2020-2029
TABLE 5 GLOBAL REACTIVE DILUENTS MARKET BY APPLICATION (USD MILLIONS) 2020-2029
TABLE 6 GLOBAL REACTIVE DILUENTS MARKET BY APPLICATION (KILOTONS) 2020-2029
TABLE 7 GLOBAL REACTIVE DILUENTS MARKET BY REGION (USD MILLIONS) 2020-2029
TABLE 8 GLOBAL REACTIVE DILUENTS MARKET BY REGION (KILOTONS) 2020-2029
TABLE 9 NORTH AMERICA REACTIVE DILUENTS MARKET BY COUNTRY (USD MILLIONS) 2020-2029
TABLE 10 NORTH AMERICA REACTIVE DILUENTS MARKET BY COUNTRY (KILOTONS) 2020-2029
TABLE 11 US REACTIVE DILUENTS MARKET BY TYPE (USD MILLIONS) 2020-2029
TABLE 12 US REACTIVE DILUENTS MARKET BY TYPE (KILOTONS) 2020-2029
TABLE 13 US REACTIVE DILUENTS MARKET BY END-USER (USD MILLIONS) 2020-2029
TABLE 14 US REACTIVE DILUENTS MARKET BY END-USER (KILOTONS) 2020-2029
TABLE 15 US REACTIVE DILUENTS MARKET BY APPLICATION (USD MILLIONS) 2020-2029
TABLE 16 US REACTIVE DILUENTS MARKET BY APPLICATION (KILOTONS) 2020-2029
TABLE 17 CANADA REACTIVE DILUENTS MARKET BY TYPE (USD MILLIONS) 2020-2029
TABLE 18 CANADA REACTIVE DILUENTS MARKET BY TYPE (KILOTONS) 2020-2029
TABLE 19 CANADA REACTIVE DILUENTS MARKET BY END-USER (USD MILLIONS) 2020-2029
TABLE 20 CANADA REACTIVE DILUENTS MARKET BY END-USER (KILOTONS) 2020-2029
TABLE 21 CANADA REACTIVE DILUENTS MARKET BY APPLICATION (USD MILLIONS) 2020-2029
TABLE 22 CANADA REACTIVE DILUENTS MARKET BY APPLICATION (KILOTONS) 2020-2029
TABLE 23 MEXICO REACTIVE DILUENTS MARKET BY TYPE (USD MILLIONS) 2020-2029
TABLE 24 MEXICO REACTIVE DILUENTS MARKET BY TYPE (KILOTONS) 2020-2029
TABLE 25 MEXICO REACTIVE DILUENTS MARKET BY END-USER (USD MILLIONS) 2020-2029
TABLE 26 MEXICO REACTIVE DILUENTS MARKET BY END-USER (KILOTONS) 2020-2029
TABLE 27 MEXICO REACTIVE DILUENTS MARKET BY APPLICATION (USD MILLIONS) 2020-2029
TABLE 28 MEXICO REACTIVE DILUENTS MARKET BY APPLICATION (KILOTONS) 2020-2029
TABLE 29 SOUTH AMERICA REACTIVE DILUENTS MARKET BY COUNTRY (USD MILLIONS) 2020-2029
TABLE 30 SOUTH AMERICA REACTIVE DILUENTS MARKET BY COUNTRY (KILOTONS) 2020-2029
TABLE 31 BRAZIL REACTIVE DILUENTS MARKET BY TYPE (USD MILLIONS) 2020-2029
TABLE 32 BRAZIL REACTIVE DILUENTS MARKET BY TYPE (KILOTONS) 2020-2029
TABLE 33 BRAZIL REACTIVE DILUENTS MARKET BY END-USER (USD MILLIONS) 2020-2029
TABLE 34 BRAZIL REACTIVE DILUENTS MARKET BY END-USER (KILOTONS) 2020-2029
TABLE 35 BRAZIL REACTIVE DILUENTS MARKET BY APPLICATION (USD MILLIONS) 2020-2029
TABLE 36 BRAZIL REACTIVE DILUENTS MARKET BY APPLICATION (KILOTONS) 2020-2029
TABLE 37 ARGENTINA REACTIVE DILUENTS MARKET BY TYPE (USD MILLIONS) 2020-2029
TABLE 38 ARGENTINA REACTIVE DILUENTS MARKET BY TYPE (KILOTONS) 2020-2029
TABLE 39 ARGENTINA REACTIVE DILUENTS MARKET BY END-USER (USD MILLIONS) 2020-2029
TABLE 40 ARGENTINA REACTIVE DILUENTS MARKET BY END-USER (KILOTONS) 2020-2029
TABLE 41 ARGENTINA REACTIVE DILUENTS MARKET BY APPLICATION (USD MILLIONS) 2020-2029
TABLE 42 ARGENTINA REACTIVE DILUENTS MARKET BY APPLICATION (KILOTONS) 2020-2029
TABLE 43 COLOMBIA REACTIVE DILUENTS MARKET BY TYPE (USD MILLIONS) 2020-2029
TABLE 44 COLOMBIA REACTIVE DILUENTS MARKET BY TYPE (KILOTONS) 2020-2029
TABLE 45 COLOMBIA REACTIVE DILUENTS MARKET BY END-USER (USD MILLIONS) 2020-2029
TABLE 46 COLOMBIA REACTIVE DILUENTS MARKET BY END-USER (KILOTONS) 2020-2029
TABLE 47 COLOMBIA REACTIVE DILUENTS MARKET BY APPLICATION (USD MILLIONS) 2020-2029
TABLE 48 COLOMBIA REACTIVE DILUENTS MARKET BY APPLICATION (KILOTONS) 2020-2029
TABLE 49 REST OF SOUTH AMERICA REACTIVE DILUENTS MARKET BY TYPE (USD MILLIONS) 2020-2029
TABLE 50 REST OF SOUTH AMERICA REACTIVE DILUENTS MARKET BY TYPE (KILOTONS) 2020-2029
TABLE 51 REST OF SOUTH AMERICA REACTIVE DILUENTS MARKET BY END-USER (USD MILLIONS) 2020-2029
TABLE 52 REST OF SOUTH AMERICA REACTIVE DILUENTS MARKET BY END-USER (KILOTONS) 2020-2029
TABLE 53 REST OF SOUTH AMERICA REACTIVE DILUENTS MARKET BY APPLICATION (USD MILLIONS) 2020-2029
TABLE 54 REST OF SOUTH AMERICA REACTIVE DILUENTS MARKET BY APPLICATION (KILOTONS) 2020-2029
TABLE 55 ASIA-PACIFIC REACTIVE DILUENTS MARKET BY COUNTRY (USD MILLIONS) 2020-2029
TABLE 56 ASIA-PACIFIC REACTIVE DILUENTS MARKET BY COUNTRY (KILOTONS) 2020-2029
TABLE 57 INDIA REACTIVE DILUENTS MARKET BY TYPE (USD MILLIONS) 2020-2029
TABLE 58 INDIA REACTIVE DILUENTS MARKET BY TYPE (KILOTONS) 2020-2029
TABLE 59 INDIA REACTIVE DILUENTS MARKET BY END-USER (USD MILLIONS) 2020-2029
TABLE 60 INDIA REACTIVE DILUENTS MARKET BY END-USER (KILOTONS) 2020-2029
TABLE 61 INDIA REACTIVE DILUENTS MARKET BY APPLICATION (USD MILLIONS) 2020-2029
TABLE 62 INDIA REACTIVE DILUENTS MARKET BY APPLICATION (KILOTONS) 2020-2029
TABLE 63 CHINA REACTIVE DILUENTS MARKET BY TYPE (USD MILLIONS) 2020-2029
TABLE 64 CHINA REACTIVE DILUENTS MARKET BY TYPE (KILOTONS) 2020-2029
TABLE 65 CHINA REACTIVE DILUENTS MARKET BY END-USER (USD MILLIONS) 2020-2029
TABLE 66 CHINA REACTIVE DILUENTS MARKET BY END-USER (KILOTONS) 2020-2029
TABLE 67 CHINA REACTIVE DILUENTS MARKET BY APPLICATION (USD MILLIONS) 2020-2029
TABLE 68 CHINA REACTIVE DILUENTS MARKET BY APPLICATION (KILOTONS) 2020-2029
TABLE 69 JAPAN REACTIVE DILUENTS MARKET BY TYPE (USD MILLIONS) 2020-2029
TABLE 70 JAPAN REACTIVE DILUENTS MARKET BY TYPE (KILOTONS) 2020-2029
TABLE 71 JAPAN REACTIVE DILUENTS MARKET BY END-USER (USD MILLIONS) 2020-2029
TABLE 72 JAPAN REACTIVE DILUENTS MARKET BY END-USER (KILOTONS) 2020-2029
TABLE 73 JAPAN REACTIVE DILUENTS MARKET BY APPLICATION (USD MILLIONS) 2020-2029
TABLE 74 JAPAN REACTIVE DILUENTS MARKET BY APPLICATION (KILOTONS) 2020-2029
TABLE 75 SOUTH KOREA REACTIVE DILUENTS MARKET BY TYPE (USD MILLIONS) 2020-2029
TABLE 76 SOUTH KOREA REACTIVE DILUENTS MARKET BY TYPE (KILOTONS) 2020-2029
TABLE 77 SOUTH KOREA REACTIVE DILUENTS MARKET BY END-USER (USD MILLIONS) 2020-2029
TABLE 78 SOUTH KOREA REACTIVE DILUENTS MARKET BY END-USER (KILOTONS) 2020-2029
TABLE 79 SOUTH KOREA REACTIVE DILUENTS MARKET BY APPLICATION (USD MILLIONS) 2020-2029
TABLE 80 SOUTH KOREA REACTIVE DILUENTS MARKET BY APPLICATION (KILOTONS) 2020-2029
TABLE 81 AUSTRALIA REACTIVE DILUENTS MARKET BY TYPE (USD MILLIONS) 2020-2029
TABLE 82 AUSTRALIA REACTIVE DILUENTS MARKET BY TYPE (KILOTONS) 2020-2029
TABLE 83 AUSTRALIA REACTIVE DILUENTS MARKET BY END-USER (USD MILLIONS) 2020-2029
TABLE 84 AUSTRALIA REACTIVE DILUENTS MARKET BY END-USER (KILOTONS) 2020-2029
TABLE 85 AUSTRALIA REACTIVE DILUENTS MARKET BY APPLICATION (USD MILLIONS) 2020-2029
TABLE 86 AUSTRALIA REACTIVE DILUENTS MARKET BY APPLICATION (KILOTONS) 2020-2029
TABLE 87 SOUTH-EAST ASIA REACTIVE DILUENTS MARKET BY TYPE (USD MILLIONS) 2020-2029
TABLE 88 SOUTH-EAST ASIA REACTIVE DILUENTS MARKET BY TYPE (KILOTONS) 2020-2029
TABLE 89 SOUTH-EAST ASIA REACTIVE DILUENTS MARKET BY END-USER (USD MILLIONS) 2020-2029
TABLE 90 SOUTH-EAST ASIA REACTIVE DILUENTS MARKET BY END-USER (KILOTONS) 2020-2029
TABLE 91 SOUTH-EAST ASIA REACTIVE DILUENTS MARKET BY APPLICATION (USD MILLIONS) 2020-2029
TABLE 92 SOUTH-EAST ASIA REACTIVE DILUENTS MARKET BY APPLICATION (KILOTONS) 2020-2029
TABLE 93 REST OF ASIA PACIFIC REACTIVE DILUENTS MARKET BY TYPE (USD MILLIONS) 2020-2029
TABLE 94 REST OF ASIA PACIFIC REACTIVE DILUENTS MARKET BY TYPE (KILOTONS) 2020-2029
TABLE 95 REST OF ASIA PACIFIC REACTIVE DILUENTS MARKET BY END-USER (USD MILLIONS) 2020-2029
TABLE 96 REST OF ASIA PACIFIC REACTIVE DILUENTS MARKET BY END-USER (KILOTONS) 2020-2029
TABLE 97 REST OF ASIA PACIFIC REACTIVE DILUENTS MARKET BY APPLICATION (USD MILLIONS) 2020-2029
TABLE 98 REST OF ASIA PACIFIC REACTIVE DILUENTS MARKET BY APPLICATION (KILOTONS) 2020-2029
TABLE 99 EUROPE REACTIVE DILUENTS MARKET BY COUNTRY (USD MILLIONS) 2020-2029
TABLE 100 EUROPE REACTIVE DILUENTS MARKET BY COUNTRY (KILOTONS) 2020-2029
TABLE 101 GERMANY REACTIVE DILUENTS MARKET BY TYPE (USD MILLIONS) 2020-2029
TABLE 102 GERMANY REACTIVE DILUENTS MARKET BY TYPE (KILOTONS) 2020-2029
TABLE 103 GERMANY REACTIVE DILUENTS MARKET BY END-USER (USD MILLIONS) 2020-2029
TABLE 104 GERMANY REACTIVE DILUENTS MARKET BY END-USER (KILOTONS) 2020-2029
TABLE 105 GERMANY REACTIVE DILUENTS MARKET BY APPLICATION (USD MILLIONS) 2020-2029
TABLE 106 GERMANY REACTIVE DILUENTS MARKET BY APPLICATION (KILOTONS) 2020-2029
TABLE 107 UK REACTIVE DILUENTS MARKET BY TYPE (USD MILLIONS) 2020-2029
TABLE 108 UK REACTIVE DILUENTS MARKET BY TYPE (KILOTONS) 2020-2029
TABLE 109 UK REACTIVE DILUENTS MARKET BY END-USER (USD MILLIONS) 2020-2029
TABLE 110 UK REACTIVE DILUENTS MARKET BY END-USER (KILOTONS) 2020-2029
TABLE 111 UK REACTIVE DILUENTS MARKET BY APPLICATION (USD MILLIONS) 2020-2029
TABLE 112 UK REACTIVE DILUENTS MARKET BY APPLICATION (KILOTONS) 2020-2029
TABLE 113 FRANCE REACTIVE DILUENTS MARKET BY TYPE (USD MILLIONS) 2020-2029
TABLE 114 FRANCE REACTIVE DILUENTS MARKET BY TYPE (KILOTONS) 2020-2029
TABLE 115 FRANCE REACTIVE DILUENTS MARKET BY END-USER (USD MILLIONS) 2020-2029
TABLE 116 FRANCE REACTIVE DILUENTS MARKET BY END-USER (KILOTONS) 2020-2029
TABLE 117 FRANCE REACTIVE DILUENTS MARKET BY APPLICATION (USD MILLIONS) 2020-2029
TABLE 118 FRANCE REACTIVE DILUENTS MARKET BY APPLICATION (KILOTONS) 2020-2029
TABLE 119 ITALY REACTIVE DILUENTS MARKET BY TYPE (USD MILLIONS) 2020-2029
TABLE 120 ITALY REACTIVE DILUENTS MARKET BY TYPE (KILOTONS) 2020-2029
TABLE 121 ITALY REACTIVE DILUENTS MARKET BY END-USER (USD MILLIONS) 2020-2029
TABLE 122 ITALY REACTIVE DILUENTS MARKET BY END-USER (KILOTONS) 2020-2029
TABLE 123 ITALY REACTIVE DILUENTS MARKET BY APPLICATION (USD MILLIONS) 2020-2029
TABLE 124 ITALY REACTIVE DILUENTS MARKET BY APPLICATION (KILOTONS) 2020-2029
TABLE 125 SPAIN REACTIVE DILUENTS MARKET BY TYPE (USD MILLIONS) 2020-2029
TABLE 126 SPAIN REACTIVE DILUENTS MARKET BY TYPE (KILOTONS) 2020-2029
TABLE 127 SPAIN REACTIVE DILUENTS MARKET BY END-USER (USD MILLIONS) 2020-2029
TABLE 128 SPAIN REACTIVE DILUENTS MARKET BY END-USER (KILOTONS) 2020-2029
TABLE 129 SPAIN REACTIVE DILUENTS MARKET BY APPLICATION (USD MILLIONS) 2020-2029
TABLE 130 SPAIN REACTIVE DILUENTS MARKET BY APPLICATION (KILOTONS) 2020-2029
TABLE 131 RUSSIA REACTIVE DILUENTS MARKET BY TYPE (USD MILLIONS) 2020-2029
TABLE 132 RUSSIA REACTIVE DILUENTS MARKET BY TYPE (KILOTONS) 2020-2029
TABLE 133 RUSSIA REACTIVE DILUENTS MARKET BY END-USER (USD MILLIONS) 2020-2029
TABLE 134 RUSSIA REACTIVE DILUENTS MARKET BY END-USER (KILOTONS) 2020-2029
TABLE 135 RUSSIA REACTIVE DILUENTS MARKET BY APPLICATION (USD MILLIONS) 2020-2029
TABLE 136 RUSSIA REACTIVE DILUENTS MARKET BY APPLICATION (KILOTONS) 2020-2029
TABLE 137 REST OF EUROPE REACTIVE DILUENTS MARKET BY TYPE (USD MILLIONS) 2020-2029
TABLE 138 REST OF EUROPE REACTIVE DILUENTS MARKET BY TYPE (KILOTONS) 2020-2029
TABLE 139 REST OF EUROPE REACTIVE DILUENTS MARKET BY END-USER (USD MILLIONS) 2020-2029
TABLE 140 REST OF EUROPE REACTIVE DILUENTS MARKET BY END-USER (KILOTONS) 2020-2029
TABLE 141 REST OF EUROPE REACTIVE DILUENTS MARKET BY APPLICATION (USD MILLIONS) 2020-2029
TABLE 142 REST OF EUROPE REACTIVE DILUENTS MARKET BY APPLICATION (KILOTONS) 2020-2029
TABLE 143 MIDDLE EAST AND AFRICA REACTIVE DILUENTS MARKET BY COUNTRY (USD MILLIONS) 2020-2029
TABLE 144 MIDDLE EAST AND AFRICA REACTIVE DILUENTS MARKET BY COUNTRY (KILOTONS) 2020-2029
TABLE 145 UAE REACTIVE DILUENTS MARKET BY TYPE (USD MILLIONS) 2020-2029
TABLE 146 UAE REACTIVE DILUENTS MARKET BY TYPE (KILOTONS) 2020-2029
TABLE 147 UAE REACTIVE DILUENTS MARKET BY END-USER (USD MILLIONS) 2020-2029
TABLE 148 UAE REACTIVE DILUENTS MARKET BY END-USER (KILOTONS) 2020-2029
TABLE 149 UAE REACTIVE DILUENTS MARKET BY APPLICATION (USD MILLIONS) 2020-2029
TABLE 150 UAE REACTIVE DILUENTS MARKET BY APPLICATION (KILOTONS) 2020-2029
TABLE 151 SAUDI ARABIA REACTIVE DILUENTS MARKET BY TYPE (USD MILLIONS) 2020-2029
TABLE 152 SAUDI ARABIA REACTIVE DILUENTS MARKET BY TYPE (KILOTONS) 2020-2029
TABLE 153 SAUDI ARABIA REACTIVE DILUENTS MARKET BY END-USER (USD MILLIONS) 2020-2029
TABLE 154 SAUDI ARABIA REACTIVE DILUENTS MARKET BY END-USER (KILOTONS) 2020-2029
TABLE 155 SAUDI ARABIA REACTIVE DILUENTS MARKET BY APPLICATION (USD MILLIONS) 2020-2029
TABLE 156 SAUDI ARABIA REACTIVE DILUENTS MARKET BY APPLICATION (KILOTONS) 2020-2029
TABLE 157 SOUTH AFRICA REACTIVE DILUENTS MARKET BY TYPE (USD MILLIONS) 2020-2029
TABLE 158 SOUTH AFRICA REACTIVE DILUENTS MARKET BY TYPE (KILOTONS) 2020-2029
TABLE 159 SOUTH AFRICA REACTIVE DILUENTS MARKET BY END-USER (USD MILLIONS) 2020-2029
TABLE 160 SOUTH AFRICA REACTIVE DILUENTS MARKET BY END-USER (KILOTONS) 2020-2029
TABLE 161 SOUTH AFRICA REACTIVE DILUENTS MARKET BY APPLICATION (USD MILLIONS) 2020-2029
TABLE 162 SOUTH AFRICA REACTIVE DILUENTS MARKET BY APPLICATION (KILOTONS) 2020-2029
TABLE 163 REST OF MIDDLE EAST AND AFRICA REACTIVE DILUENTS MARKET BY TYPE (USD MILLIONS) 2020-2029
TABLE 164 REST OF MIDDLE EAST AND AFRICA REACTIVE DILUENTS MARKET BY TYPE (KILOTONS) 2020-2029
TABLE 165 REST OF MIDDLE EAST AND AFRICA REACTIVE DILUENTS MARKET BY END-USER (USD MILLIONS) 2020-2029
TABLE 166 REST OF MIDDLE EAST AND AFRICA REACTIVE DILUENTS MARKET BY END-USER (KILOTONS) 2020-2029
TABLE 167 REST OF MIDDLE EAST AND AFRICA REACTIVE DILUENTS MARKET BY APPLICATION (USD MILLIONS) 2020-2029
TABLE 168 REST OF MIDDLE EAST AND AFRICA REACTIVE DILUENTS MARKET BY APPLICATION (KILOTONS) 2020-2029
LIST OF FIGURES
FIGURE 1 MARKET DYNAMICS
FIGURE 2 MARKET SEGMENTATION
FIGURE 3 REPORT TIMELINES: YEARS CONSIDERED
FIGURE 4 DATA TRIANGULATION
FIGURE 5 BOTTOM-UP APPROACH
FIGURE 6 TOP-DOWN APPROACH
FIGURE 7 RESEARCH FLOW
FIGURE 8 GLOBAL REACTIVE DILUENTS MARKET BY TYPE (USD MILLIONS) 2020-2029
FIGURE 9 GLOBAL REACTIVE DILUENTS MARKET BY END-USER (USD MILLIONS) 2020-2029
FIGURE 10 GLOBAL REACTIVE DILUENTS MARKET BY APPLICATION (USD MILLIONS) 2020-2029
FIGURE 11 GLOBAL REACTIVE DILUENTS MARKET BY REGION (USD MILLIONS) 2020-2029
FIGURE 12 PORTER’S FIVE FORCES MODEL
FIGURE 13 NORTH AMERICA REACTIVE DILUENTS MARKET SNAPSHOT
FIGURE 14 EUROPE REACTIVE DILUENTS MARKET SNAPSHOT
FIGURE 15 ASIA PACIFIC REACTIVE DILUENTS MARKET SNAPSHOT
FIGURE 16 SOUTH AMERICA REACTIVE DILUENTS MARKET SNAPSHOT
FIGURE 17 MIDDLE EAST & AFRICA REACTIVE DILUENTS MARKET SNAPSHOT
FIGURE 18 HEXION: COMPANY SNAPSHOT
FIGURE 19 HUNTSMAN CORPORATION: COMPANY SNAPSHOT
FIGURE 20 KUKDO CHEMICAL: COMPANY SNAPSHOT
FIGURE 21 ADITYA BIRLA CHEMICALS: COMPANY SNAPSHOT
FIGURE 22 EVONIK INDUSTRIES: COMPANY SNAPSHOT
FIGURE 23 R. COATS INKS AND RESIN PVT. LTD: COMPANY SNAPSHOT
FIGURE 24 ADEKA CORPORATIONS: COMPANY SNAPSHOT
FIGURE 25 MERCURY SYNTHETIC RESINS: COMPANY SNAPSHOT
FIGURE 26 GRASIM INDUSTRIES LTD.: COMPANY SNAPSHOT
FIGURE 27 CARGILL: COMPANY SNAPSHOT
FIGURE 28 OLIN CORPORATIONS: COMPANY SNAPSHOT
FIGURE 29 ASH CHEM: COMPANY SNAPSHOT
FIGURE 30 ADMARK POLYCOATS PVT LTD: COMPANY SNAPSHOT
FIGURE 31 CHAMPION ADVA MAT PRIVATE LIMITED: COMPANY SNAPSHOT
FIGURE 32 HINDUSTHAN SPECIALITY CHEMICALS LIMITED: COMPANY SNAPSHOT
FIGURE 33 DHINGRA PLASTIC AND PLASTISCISERS PRIVATE LIMITED: COMPANY SNAPSHOT
DOWNLOAD FREE SAMPLE REPORT
License Type
SPEAK WITH OUR ANALYST
Want to know more about the report or any specific requirement?
WANT TO CUSTOMIZE THE REPORT?
Our Clients Speak
We asked them to research ‘ Equipment market’ all over the world, and their whole arrangement was helpful to us. thehealthanalytics.com insightful analysis and reports contributed to our current analysis and in creating a future strategy. Besides, the te
Yosuke Mitsui
Senior Associate Construction Equipment Sales & Marketing
We asked them to research ‘Equipment market’ all over the world, and their whole arrangement was helpful to us. thehealthanalytics.com insightful analysis and reports contributed to our current analysis and in creating a future strategy. Besides, the te


