

Base Year Value ()
x.x %
x.x %
CAGR ()
x.x %
x.x %
Forecast Year Value ()
x.x %
x.x %
Historical Data Period
Largest Region
Forecast Period
Mercado de dispositivos médicos de impresión 3D por tipo (guías quirúrgicas, instrumentos quirúrgicos, prótesis e implantes, productos de ingeniería de tejidos), tecnología (fotopolimerización, deposición de gotas (DD) o tecnologías basadas en extrusión, fusión por haz láser, fusión por haz de electrones (EBM), impresión tridimensional (3DP) o unión por adhesión) y por región (América del Norte, Europa, Asia Pacífico, América del Sur, Oriente Medio y África) Tendencias globales y pronóstico de 2022 a 2029
Instant access to hundreds of data points and trends
- Market estimates from 2014-2029
- Competitive analysis, industry segmentation, financial benchmarks
- Incorporates SWOT, Porter's Five Forces and risk management frameworks
- PDF report or online database with Word, Excel and PowerPoint export options
- 100% money back guarantee
Descripción general del mercado de dispositivos médicos de impresión 3D
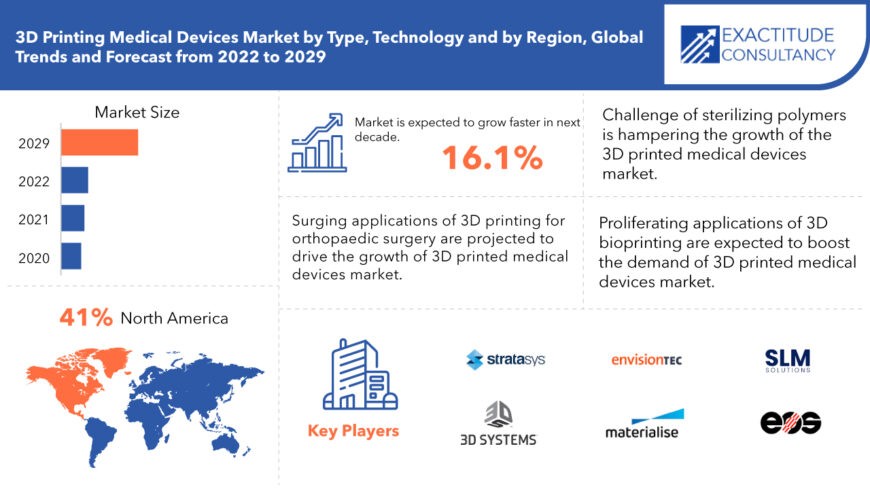
Se proyecta que el mercado global de dispositivos médicos de impresión 3D alcance los USD 7,92 mil millones para 2029 desde USD 2,07 mil millones en 2020, con una CAGR del 16,1% entre 2022 y 2029.
Las impresoras 3D se utilizan para fabricar una variedad de equipos médicos, incluidos aquellos con geometría compleja o cualidades que coinciden con la anatomía única de un paciente. Ciertos instrumentos se producen a partir de un diseño común para producir una gran cantidad de réplicas idénticas. Los implantes ortopédicos y craneales, el equipo quirúrgico, las restauraciones dentales como coronas y las prótesis externas se encuentran entre los instrumentos médicos creados con tecnología de impresión 3D. Los diseñadores pueden realizar cambios fácilmente, lo que elimina la necesidad de máquinas o dispositivos adicionales. La bioimpresión 3D es un proceso para imprimir objetos biomédicos utilizando células, productos químicos biológicos y biomateriales en tres dimensiones. Las bioimpresoras, también conocidas como bioimpresoras 3D, son herramientas automatizadas que permiten la fabricación aditiva de tejidos y órganos funcionales 3D utilizando modelos digitales creados a través de varios escaneos y biomateriales. Se espera que el mercado de dispositivos médicos impresos en 3D sea impulsado por un aumento en la financiación pública-privada para respaldar varios proyectos en la industria de la impresión 3D.
Se espera que el mayor uso de la tecnología de impresión 3D para brindar a los pacientes los beneficios de terapias personalizadas a bajo costo impulse el crecimiento de los dispositivos médicos impresos en 3D.
| ATRIBUTO | DETALLES |
| Periodo de estudio | 2020-2029 |
| Año base | 2021 |
| Año estimado | 2022 |
| Año pronosticado | 2022-2029 |
| Periodo histórico | 2018-2020 |
| Unidad | Valor (Miles de millones de USD) (Miles de unidades) |
| Segmentación | Por tipo, por tecnología, por región |
| Por tipo |
|
| Por tecnología |
|
| Por región |
|
La impresión tridimensional (3D) es una tecnología en rápido desarrollo que tiene el potencial de realizar mejoras significativas en las prácticas quirúrgicas que requieren equipo quirúrgico. Se trata de un tipo de proceso de fabricación en el que materiales como el plástico o el metal se superponen para crear un producto tridimensional a partir de un modelo digital. La ortopedia fue una de las primeras especialidades médicas en utilizar la impresión 3D. Los cirujanos ortopédicos la utilizan en su práctica clínica con fines ortopédicos específicos para el paciente. Se ha informado que la capacidad de la tecnología de impresión 3D para mejorar la comprensión de los pacientes sobre su patología y la planificación preoperatoria, así como la construcción de modelos anatómicos para la planificación quirúrgica, la educación y la capacitación quirúrgica, herramientas específicas para el paciente e implantes personalizados impresos en 3D, es beneficiosa en la ortopedia específica para el paciente.
La impresión 3D ha sido denominada la tercera revolución industrial debido a la gran variedad de posibilidades que ofrece en diversas áreas. Los modelos impresos en 3D son útiles para la planificación quirúrgica y la formación de cirujanos en formación, además de reducir la tasa de reintervenciones. Las ventajas de utilizar modelos impresos en 3D en cirugía ortopédica incluyen la posibilidad de describir los detalles de la cirugía a pacientes o estudiantes, así como la práctica de la cirugía en sí. En comparación con la imagen radiológica bidimensional tradicional, los cirujanos ahora pueden estudiar la anatomía del paciente de una manera más sólida con la tecnología de impresión 3D, lo que permite una planificación quirúrgica mejorada y más detallada. Las preoperaciones también se pueden realizar en modelos de plástico, que pueden servir como soporte básico para la colocación de tornillos o placas quirúrgicas, lo que permite al paciente visualizar el resultado final de la intervención. Como resultado, el creciente uso de la impresión 3D para la cirugía ortopédica está impulsando el mercado de dispositivos médicos impresos en 3D.
[título id="attachment_7943" align="aligncenter" width="870"]
Frequently Asked Questions
• What is the worth of global 3d printing medical devices market?
The 3d printing medical devices market size had crossed USD 2.07 Billion in 2020 and will observe a CAGR of more than 16.1% up to 2029 driven by the rising technological advancements in molecular biology, genomics, and microbial diversity.
• What are the upcoming trends of 3d printing medical devices market, globally?
The upcoming trends in 3d printing medical devices market is the presence of large industry players carrying out strategic initiatives will drive market share.
• What is the CAGR of 3d printing medical devices market?
The global 3d printing medical devices market registered a CAGR of 16.1% from 2022 to 2029. The type segment was the highest revenue contributor to the market.
• Which are the top companies to hold the market share in 3d printing medical devices market?
Key players profiled in the report Stratasys, Ltd., 3D Systems Corporation, EnvisionTEC GmbH, Materialise NV, SLM Solutions, EOS GmbH, Concept Laser GmbH, Renishaw plc, and Prodways Group.
• Which is the largest regional market for 3d printing medical devices market?
North America is the largest regional market with 41% of share owning to the existence of the United States, which is the world's largest producer and consumer of medical devices.
3D Printing Medical Devices Market Segment Analysis
The 3D printed medical devices market is divided into two categories based on type: surgical guides, surgical instruments, prosthetics and implants, tissue engineering products. The Prosthetics And Implants Segment had the most market share. This expansion is due to the increasing use of 3D printing technology for customising prosthetics and implants, which adds value to both patients and clinicians. The time it takes to do surgery, the time it takes for the patient to recuperate, and the implant's success all benefit from customised implants. The growing benefits of 3D printed implants, such as MRI compatibility and a lower risk of infection, are moving the Prosthetics and Implants segment forward.
The market is divided into photopolymerization, droplet deposition (DD) Or extrusion-based technologies, laser beam melting, electron beam melting (EBM), three dimensional printing (3DP) or adhesion bonding based on technology. The Photopolymerization Segment had the most market share. The widespread use of photopolymerization in the medical industry for prosthetics, implants, dental restorations, and porous scaffolds has fueled this expansion. Surgical tools, such as catheters and surgical masks, are made with photocurable adhesives. The advantages of photopolymerization, such as the fact that it is solvent-free and energy-efficient, as well as the fact that it can be used for heat-sensitive materials, are fueling the expansion of this market.
[caption id="attachment_7944" align="alignnone" width="680"]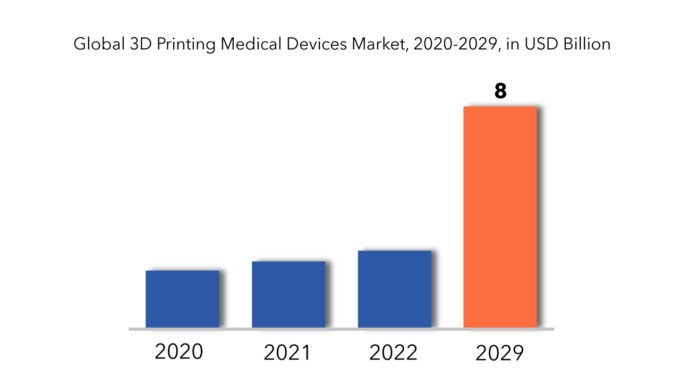
3D Printing Medical Devices Market Players
The major players operating in the global 3D printed medical devices industry include Stratasys, Ltd., 3D Systems Corporation, EnvisionTEC GmbH, Materialise NV, SLM Solutions, EOS GmbH, Concept Laser GmbH, Renishaw plc, Prodways Group. The presence of established industry players and is characterized by mergers and acquisitions, joint ventures, capacity expansions, substantial distribution, and branding decisions to improve market share and regional presence. Also, they are involved in continuous R&D activities to develop new products as well as are focused on expanding the product portfolio. This is expected to intensify competition and pose a potential threat to the new players entering the market.
Who Should Buy? Or Key Stakeholders
- Hospitals
- Manufacturers
- Research and development
- Healthcare sector
- End use industries
3D Printing Medical Devices Market Regional Analysis
Geographically, the 3D printed medical devices market is segmented into North America, South America, Europe, APAC and MEA.
- North America: includes the US, Canada, Mexico
- Europe: includes UK, Germany, France, Italy, Spain, Russia, and Rest of Europe
- Asia Pacific: includes China, Japan, South Korea, India, Australia, ASEAN and Rest of APAC
- South America: includes Brazil, Argentina and Rest of South America
- Middle East & Africa: includes Turkey, UAE, Saudi Arabia, South Africa, and Rest of MEA
North America (3D Printed Medical Devices Market) held the highest share, accounting for 41% of the total market. The existence of the United States, which is the world's largest producer and consumer of medical devices, particularly surgical tools, contributes to the region's growth. The growing acceptance of 3D printed medical devices as part of medical practice and research by prominent hospitals and laboratories is fueling the growth of the 3D printed medical devices market in this region. The rapid adoption of cutting-edge technologies like as artificial intelligence in 3D printed medical devices is propelling the 3D printed medical devices market in North America even faster.
[caption id="attachment_7945" align="alignnone" width="680"]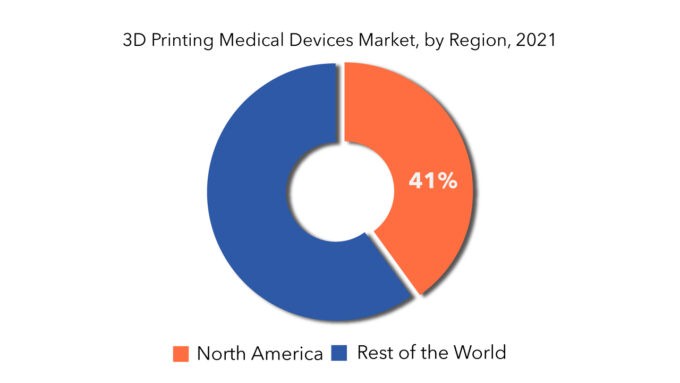
Key Market Segments: 3D Printed Medical Devices Market
3d Printed Medical Devices Market by Type, 2020-2029, (USD Million) (Thousand Units)- Surgical Guides
- Surgical Instruments
- Prosthetics and Implants
- Tissue Engineering Products
- Photopolymerization
- Droplet Deposition (Dd) Or Extrusion-Based Technologies
- Laser Beam Melting
- Electron Beam Melting (EBM)
- Three-Dimensional Printing (3dp) Or Adhesion Bonding
- North America
- Europe
- Asia Pacific
- South America
- Middle East and Africa
Key Question Answered
- What is the current scenario of the global 3D printed medical devices market?
- What are the emerging technologies for the development of 3D printed medical devices?
- What are the historical size and the present size of the market segments and their future potential?
- What are the major catalysts for the market and their impact during the short, medium, and long terms?
- What are the evolving opportunities for the players in the market?
- Which are the key regions from the investment perspective?
- What are the key strategies being adopted by the major players to up their market shares?
- Introducción
- Definición de mercado
- Segmentación del mercado
- Cronología de la investigación
- Supuestos y limitaciones
- Metodología de la investigación
- Minería de datos
- Investigación secundaria
- Investigación primaria
- Asesoramiento de expertos en la materia
- Controles de calidad
- Revisión final
- Triangulación de datos
- Enfoque de abajo hacia arriba
- Enfoque de arriba hacia abajo
- Flujo de investigación
- Fuentes de datos
- Minería de datos
- Resumen ejecutivo
- Descripción general del mercado
- Perspectivas del mercado mundial de dispositivos médicos de impresión 3D
- Factores impulsores del mercado
- Restricciones del mercado
- Oportunidades de mercado
- Impacto de Covid-19 en el mercado de dispositivos médicos de impresión 3D
- Modelo de las cinco fuerzas de Porter
- Amenaza de nuevos participantes
- Amenaza de sustitutos
- Poder de negociación de los proveedores
- Poder de negociación de los clientes
- Grado de competencia
- Análisis de la cadena de valor de la industria
- Perspectivas del mercado mundial de dispositivos médicos de impresión 3D
- Mercado mundial de dispositivos médicos de impresión 3D por tipo (millones de USD) (miles de unidades)
- Guías quirúrgicas
- Instrumentos quirúrgicos
- Prótesis e implantes
- Productos de ingeniería de tejidos
- Mercado mundial de dispositivos médicos de impresión 3D por tecnología (millones de USD) (miles de unidades)
- Fotopolimerización
- Droplet deposition (DD) or extrusion-based technologies
- Laser beam melting
- Electron beam melting (EBM)
- Three dimensional printing (3dp) or adhesion bonding
- Global 3D Printing Medical Devices Market by Region (USD Million) (Thousand Units)
- North America
- US
- Canada
- Mexico
- South America
- Brazil
- Argentina
- Colombia
- Rest Of South America
- Europe
- Germany
- UK
- France
- Italy
- Spain
- Russia
- Rest Of Europe
- Asia Pacific
- India
- China
- Japan
- South Korea
- Australia
- South-East Asia
- Rest Of Asia Pacific
- Middle East and Africa
- UAE
- Saudi Arabia
- South Africa
- Rest Of Middle East and Africa
- North America
- Company Profiles* (Business Overview, Company Snapshot, Products Offered, Recent Developments)
- Stratasys, Ltd.
- 3D Systems Corporation
- EnvisionTEC GmbH
- Materialise NV
- SLM Solutions
- EOS GmbH
- Concept Laser GmbH
- Renishaw plc
- Prodways Group *The Company List Is Indicative
LIST OF TABLES
TABLE 1 GLOBAL3D PRINTING MEDICAL DEVICES MARKET BY TYPE (USD MILLIONS) 2020-2029
TABLE 2 GLOBAL 3D PRINTING MEDICAL DEVICES MARKET BY TYPE (THOUSAND UNITS) 2020-2029
TABLE 3 GLOBAL 3D PRINTING MEDICAL DEVICES MARKET BY TECHNOLOGY (USD MILLIONS) 2020-2029
TABLE 4 GLOBAL 3D PRINTING MEDICAL DEVICES MARKET BY TECHNOLOGY (THOUSAND UNITS) 2020-2029
TABLE 5 GLOBAL 3D PRINTING MEDICAL DEVICES MARKET BY REGION (USD MILLIONS) 2020-2029
TABLE 6 GLOBAL 3D PRINTING MEDICAL DEVICES MARKET BY REGION (THOUSAND UNITS) 2020-2029
TABLE 7 US 3D PRINTING MEDICAL DEVICES MARKET BY TYPE (USD MILLIONS) 2020-2029
TABLE 8 US 3D PRINTING MEDICAL DEVICES MARKET BY TYPE (THOUSAND UNITS) 2020-2029
TABLE 9 US 3D PRINTING MEDICAL DEVICES MARKET BY TECHNOLOGY (USD MILLIONS) 2020-2029
TABLE 10 US 3D PRINTING MEDICAL DEVICES MARKET BY TECHNOLOGY (THOUSAND UNITS) 2020-2029
TABLE 11 CANADA 3D PRINTING MEDICAL DEVICES MARKET BY TYPE (USD MILLIONS) 2020-2029
TABLE 12 CANADA 3D PRINTING MEDICAL DEVICES MARKET BY TYPE (THOUSAND UNITS) 2020-2029
TABLE 13 CANADA 3D PRINTING MEDICAL DEVICES MARKET BY TECHNOLOGY (USD MILLIONS) 2020-2029
TABLE 14 CANADA 3D PRINTING MEDICAL DEVICES MARKET BY TECHNOLOGY (THOUSAND UNITS) 2020-2029
TABLE 15 MEXICO 3D PRINTING MEDICAL DEVICES MARKET BY TYPE (USD MILLIONS) 2020-2029
TABLE 16 MEXICO 3D PRINTING MEDICAL DEVICES MARKET BY TYPE (THOUSAND UNITS) 2020-2029
TABLE 17 MEXICO 3D PRINTING MEDICAL DEVICES MARKET BY TECHNOLOGY (USD MILLIONS) 2020-2029
TABLE 18 MEXICO 3D PRINTING MEDICAL DEVICES MARKET BY TECHNOLOGY (THOUSAND UNITS) 2020-2029
TABLE 19 BRAZIL 3D PRINTING MEDICAL DEVICES MARKET BY TYPE (USD MILLIONS) 2020-2029
TABLE 20 BRAZIL 3D PRINTING MEDICAL DEVICES MARKET BY TYPE (THOUSAND UNITS) 2020-2029
TABLE 21 BRAZIL 3D PRINTING MEDICAL DEVICES MARKET BY TECHNOLOGY (USD MILLIONS) 2020-2029
TABLE 22 BRAZIL 3D PRINTING MEDICAL DEVICES MARKET BY TECHNOLOGY (THOUSAND UNITS) 2020-2029
TABLE 23 ARGENTINA 3D PRINTING MEDICAL DEVICES MARKET BY TYPE (USD MILLIONS) 2020-2029
TABLE 24 ARGENTINA 3D PRINTING MEDICAL DEVICES MARKET BY TYPE (THOUSAND UNITS) 2020-2029
TABLE 25 ARGENTINA 3D PRINTING MEDICAL DEVICES MARKET BY TECHNOLOGY (USD MILLIONS) 2020-2029
TABLE 26 ARGENTINA 3D PRINTING MEDICAL DEVICES MARKET BY TECHNOLOGY (THOUSAND UNITS) 2020-2029
TABLE 27 COLOMBIA 3D PRINTING MEDICAL DEVICES MARKET BY TYPE (USD MILLIONS) 2020-2029
TABLE 28 COLOMBIA 3D PRINTING MEDICAL DEVICES MARKET BY TYPE (THOUSAND UNITS) 2020-2029
TABLE 29 COLOMBIA 3D PRINTING MEDICAL DEVICES MARKET BY TECHNOLOGY (USD MILLIONS) 2020-2029
TABLE 30 COLOMBIA 3D PRINTING MEDICAL DEVICES MARKET BY TECHNOLOGY (THOUSAND UNITS) 2020-2029
TABLE 31 REST OF SOUTH AMERICA 3D PRINTING MEDICAL DEVICES MARKET BY TYPE (USD MILLIONS) 2020-2029
TABLE 32 REST OF SOUTH AMERICA 3D PRINTING MEDICAL DEVICES MARKET BY TYPE (THOUSAND UNITS) 2020-2029
TABLE 33 REST OF SOUTH AMERICA 3D PRINTING MEDICAL DEVICES MARKET BY TECHNOLOGY (USD MILLIONS) 2020-2029
TABLE 34 REST OF SOUTH AMERICA 3D PRINTING MEDICAL DEVICES MARKET BY TECHNOLOGY (THOUSAND UNITS) 2020-2029
TABLE 35 INDIA 3D PRINTING MEDICAL DEVICES MARKET BY TYPE (USD MILLIONS) 2020-2029
TABLE 36 INDIA 3D PRINTING MEDICAL DEVICES MARKET BY TYPE (THOUSAND UNITS) 2020-2029
TABLE 37 INDIA 3D PRINTING MEDICAL DEVICES MARKET BY TECHNOLOGY (USD MILLIONS) 2020-2029
TABLE 38 INDIA 3D PRINTING MEDICAL DEVICES MARKET BY TECHNOLOGY (THOUSAND UNITS) 2020-2029
TABLE 39 CHINA 3D PRINTING MEDICAL DEVICES MARKET BY TYPE (USD MILLIONS) 2020-2029
TABLE 40 CHINA 3D PRINTING MEDICAL DEVICES MARKET BY TYPE (THOUSAND UNITS) 2020-2029
TABLE 41 CHINA 3D PRINTING MEDICAL DEVICES MARKET BY TECHNOLOGY (USD MILLIONS) 2020-2029
TABLE 42 CHINA 3D PRINTING MEDICAL DEVICES MARKET BY TECHNOLOGY (THOUSAND UNITS) 2020-2029
TABLE 43 JAPAN 3D PRINTING MEDICAL DEVICES MARKET BY TYPE (USD MILLIONS) 2020-2029
TABLE 44 JAPAN 3D PRINTING MEDICAL DEVICES MARKET BY TYPE (THOUSAND UNITS) 2020-2029
TABLE 45 JAPAN 3D PRINTING MEDICAL DEVICES MARKET BY TECHNOLOGY (USD MILLIONS) 2020-2029
TABLE 46 JAPAN 3D PRINTING MEDICAL DEVICES MARKET BY TECHNOLOGY (THOUSAND UNITS) 2020-2029
TABLE 47 SOUTH KOREA 3D PRINTING MEDICAL DEVICES MARKET BY TYPE (USD MILLIONS) 2020-2029
TABLE 48 SOUTH KOREA 3D PRINTING MEDICAL DEVICES MARKET BY TYPE (THOUSAND UNITS) 2020-2029
TABLE 49 SOUTH KOREA 3D PRINTING MEDICAL DEVICES MARKET BY TECHNOLOGY (USD MILLIONS) 2020-2029
TABLE 50 SOUTH KOREA 3D PRINTING MEDICAL DEVICES MARKET BY TECHNOLOGY (THOUSAND UNITS) 2020-2029
TABLE 51 AUSTRALIA 3D PRINTING MEDICAL DEVICES MARKET BY TYPE (USD MILLIONS) 2020-2029
TABLE 52 AUSTRALIA 3D PRINTING MEDICAL DEVICES MARKET BY TYPE (THOUSAND UNITS) 2020-2029
TABLE 53 AUSTRALIA 3D PRINTING MEDICAL DEVICES MARKET BY TECHNOLOGY (USD MILLIONS) 2020-2029
TABLE 54 AUSTRALIA 3D PRINTING MEDICAL DEVICES MARKET BY TECHNOLOGY (THOUSAND UNITS) 2020-2029
TABLE 55 SOUTH-EAST ASIA 3D PRINTING MEDICAL DEVICES MARKET BY TYPE (USD MILLIONS) 2020-2029
TABLE 56 SOUTH-EAST ASIA 3D PRINTING MEDICAL DEVICES MARKET BY TYPE (THOUSAND UNITS) 2020-2029
TABLE 57 SOUTH-EAST ASIA 3D PRINTING MEDICAL DEVICES MARKET BY TECHNOLOGY (USD MILLIONS) 2020-2029
TABLE 58 SOUTH-EAST ASIA 3D PRINTING MEDICAL DEVICES MARKET BY TECHNOLOGY (THOUSAND UNITS) 2020-2029
TABLE 59 REST OF ASIA PACIFIC 3D PRINTING MEDICAL DEVICES MARKET BY TYPE (USD MILLIONS) 2020-2029
TABLE 60 REST OF ASIA PACIFIC 3D PRINTING MEDICAL DEVICES MARKET BY TYPE (THOUSAND UNITS) 2020-2029
TABLE 61 REST OF ASIA PACIFIC 3D PRINTING MEDICAL DEVICES MARKET BY TECHNOLOGY (USD MILLIONS) 2020-2029
TABLE 62 REST OF ASIA PACIFIC 3D PRINTING MEDICAL DEVICES MARKET BY TECHNOLOGY (THOUSAND UNITS) 2020-2029
TABLE 63 GERMANY 3D PRINTING MEDICAL DEVICES MARKET BY TYPE (USD MILLIONS) 2020-2029
TABLE 64 GERMANY 3D PRINTING MEDICAL DEVICES MARKET BY TYPE (THOUSAND UNITS) 2020-2029
TABLE 65 GERMANY 3D PRINTING MEDICAL DEVICES MARKET BY TECHNOLOGY (USD MILLIONS) 2020-2029
TABLE 66 GERMANY 3D PRINTING MEDICAL DEVICES MARKET BY TECHNOLOGY (THOUSAND UNITS) 2020-2029
TABLE 67 UK 3D PRINTING MEDICAL DEVICES MARKET BY TYPE (USD MILLIONS) 2020-2029
TABLE 68 UK 3D PRINTING MEDICAL DEVICES MARKET BY TYPE (THOUSAND UNITS) 2020-2029
TABLE 69 UK 3D PRINTING MEDICAL DEVICES MARKET BY TECHNOLOGY (USD MILLIONS) 2020-2029
TABLE 70 UK 3D PRINTING MEDICAL DEVICES MARKET BY TECHNOLOGY (THOUSAND UNITS) 2020-2029
TABLE 71 FRANCE 3D PRINTING MEDICAL DEVICES MARKET BY TYPE (USD MILLIONS) 2020-2029
TABLE 72 FRANCE 3D PRINTING MEDICAL DEVICES MARKET BY TYPE (THOUSAND UNITS) 2020-2029
TABLE 73 FRANCE 3D PRINTING MEDICAL DEVICES MARKET BY TECHNOLOGY (USD MILLIONS) 2020-2029
TABLE 74 FRANCE 3D PRINTING MEDICAL DEVICES MARKET BY TECHNOLOGY (THOUSAND UNITS) 2020-2029
TABLE 75 ITALY 3D PRINTING MEDICAL DEVICES MARKET BY TYPE (USD MILLIONS) 2020-2029
TABLE 76 ITALY 3D PRINTING MEDICAL DEVICES MARKET BY TYPE (THOUSAND UNITS) 2020-2029
TABLE 77 ITALY 3D PRINTING MEDICAL DEVICES MARKET BY TECHNOLOGY (USD MILLIONS) 2020-2029
TABLE 78 ITALY 3D PRINTING MEDICAL DEVICES MARKET BY TECHNOLOGY (THOUSAND UNITS) 2020-2029
TABLE 79 SPAIN 3D PRINTING MEDICAL DEVICES MARKET BY TYPE (USD MILLIONS) 2020-2029
TABLE 80 SPAIN 3D PRINTING MEDICAL DEVICES MARKET BY TYPE (THOUSAND UNITS) 2020-2029
TABLE 81 SPAIN 3D PRINTING MEDICAL DEVICES MARKET BY TECHNOLOGY (USD MILLIONS) 2020-2029
TABLE 82 SPAIN 3D PRINTING MEDICAL DEVICES MARKET BY TECHNOLOGY (THOUSAND UNITS) 2020-2029
TABLE 83 RUSSIA 3D PRINTING MEDICAL DEVICES MARKET BY TYPE (USD MILLIONS) 2020-2029
TABLE 84 RUSSIA 3D PRINTING MEDICAL DEVICES MARKET BY TYPE (THOUSAND UNITS) 2020-2029
TABLE 85 RUSSIA 3D PRINTING MEDICAL DEVICES MARKET BY TECHNOLOGY (USD MILLIONS) 2020-2029
TABLE 86 RUSSIA 3D PRINTING MEDICAL DEVICES MARKET BY TECHNOLOGY (THOUSAND UNITS) 2020-2029
TABLE 87 REST OF EUROPE 3D PRINTING MEDICAL DEVICES MARKET BY TYPE (USD MILLIONS) 2020-2029
TABLE 88 REST OF EUROPE 3D PRINTING MEDICAL DEVICES MARKET BY TYPE (THOUSAND UNITS) 2020-2029
TABLE 89 REST OF EUROPE 3D PRINTING MEDICAL DEVICES MARKET BY TECHNOLOGY (USD MILLIONS) 2020-2029
TABLE 90 REST OF EUROPE 3D PRINTING MEDICAL DEVICES MARKET BY TECHNOLOGY (THOUSAND UNITS) 2020-2029
TABLE 91 UAE 3D PRINTING MEDICAL DEVICES MARKET BY TYPE (USD MILLIONS) 2020-2029
TABLE 92 UAE 3D PRINTING MEDICAL DEVICES MARKET BY TYPE (THOUSAND UNITS) 2020-2029
TABLE 93 UAE 3D PRINTING MEDICAL DEVICES MARKET BY TECHNOLOGY (USD MILLIONS) 2020-2029
TABLE 94 UAE 3D PRINTING MEDICAL DEVICES MARKET BY TECHNOLOGY (THOUSAND UNITS) 2020-2029
TABLE 95 SAUDI ARABIA 3D PRINTING MEDICAL DEVICES MARKET BY TYPE (USD MILLIONS) 2020-2029
TABLE 96 SAUDI ARABIA 3D PRINTING MEDICAL DEVICES MARKET BY TYPE (THOUSAND UNITS) 2020-2029
TABLE 97 SAUDI ARABIA 3D PRINTING MEDICAL DEVICES MARKET BY TECHNOLOGY (USD MILLIONS) 2020-2029
TABLE 98 SAUDI ARABIA 3D PRINTING MEDICAL DEVICES MARKET BY TECHNOLOGY (THOUSAND UNITS) 2020-2029
TABLE 99 SOUTH AFRICA 3D PRINTING MEDICAL DEVICES MARKET BY TYPE (USD MILLIONS) 2020-2029
TABLE 100 SOUTH AFRICA 3D PRINTING MEDICAL DEVICES MARKET BY TYPE (THOUSAND UNITS) 2020-2029
TABLE 101 SOUTH AFRICA 3D PRINTING MEDICAL DEVICES MARKET BY TECHNOLOGY (USD MILLIONS) 2020-2029
TABLE 102 SOUTH AFRICA 3D PRINTING MEDICAL DEVICES MARKET BY TECHNOLOGY (THOUSAND UNITS) 2020-2029
TABLE 103 REST OF MIDDLE EAST AND AFRICA 3D PRINTING MEDICAL DEVICES MARKET BY TYPE (USD MILLIONS) 2020-2029
TABLE 104 REST OF MIDDLE EAST AND AFRICA 3D PRINTING MEDICAL DEVICES MARKET BY TYPE (THOUSAND UNITS) 2020-2029
TABLE 105 REST OF MIDDLE EAST AND AFRICA 3D PRINTING MEDICAL DEVICES MARKET BY TECHNOLOGY (USD MILLIONS) 2020-2029
TABLE 106 REST OF MIDDLE EAST AND AFRICA 3D PRINTING MEDICAL DEVICES MARKET BY TECHNOLOGY (THOUSAND UNITS) 2020-2029
LIST OF FIGURES
FIGURE 1 MARKET DYNAMICS
FIGURE 2 MARKET SEGMENTATION
FIGURE 3 REPORT TIMELINES: YEARS CONSIDERED
FIGURE 4 DATA TRIANGULATION
FIGURE 5 BOTTOM-UP APPROACH
FIGURE 6 TOP-DOWN APPROACH
FIGURE 7 RESEARCH FLOW
FIGURE 8 GLOBAL 3D PRINTING MEDICAL DEVICES MARKET BY TYPE, USD MILLION, 2020-2029
FIGURE 9 GLOBAL 3D PRINTING MEDICAL DEVICES MARKET BY TECHNOLOGY, USD MILLION, 2020-2029
FIGURE 10 GLOBAL 3D PRINTING MEDICAL DEVICES MARKET BY TECHNOLOGY, USD MILLION, 2020-2029
FIGURE 11 GLOBAL 3D PRINTING MEDICAL DEVICES MARKET BY REGION, USD MILLION, 2020-2029
FIGURE 12 PORTER’S FIVE FORCES MODEL
FIGURE 13 NORTH AMERICA 3D PRINTING MEDICAL DEVICES MARKET SNAPSHOT
FIGURE 14 EUROPE 3D PRINTING MEDICAL DEVICES MARKET SNAPSHOT
FIGURE 15 ASIA PACIFIC 3D PRINTING MEDICAL DEVICES MARKET SNAPSHOT
FIGURE 16 SOUTH AMERICA 3D PRINTING MEDICAL DEVICES MARKET SNAPSHOT
FIGURE 17 MIDDLE EAST & AFRICA 3D PRINTING MEDICAL DEVICES MARKET SNAPSHOT
FIGURE 18 MARKET SHARE ANALYSIS
FIGURE 19 STRATASYS, LTD.: COMPANY SNAPSHOT
FIGURE 20 3D SYSTEMS CORPORATION: COMPANY SNAPSHOT
FIGURE 21 ENVISIONTEC GMBH: COMPANY SNAPSHOT
FIGURE 22 MATERIALISE NV: COMPANY SNAPSHOT
FIGURE 23 SLM SOLUTIONS: COMPANY SNAPSHOT
FIGURE 24 EOS GMBH: COMPANY SNAPSHOT
FIGURE 25 CONCEPT LASER GMBH: COMPANY SNAPSHOT
FIGURE 26 RENISHAW PLC: COMPANY SNAPSHOT
FIGURE 27 PRODWAYS GROUP: COMPANY SNAPSHOT
DOWNLOAD FREE SAMPLE REPORT
License Type
SPEAK WITH OUR ANALYST
Want to know more about the report or any specific requirement?
WANT TO CUSTOMIZE THE REPORT?
Our Clients Speak
We asked them to research ‘ Equipment market’ all over the world, and their whole arrangement was helpful to us. thehealthanalytics.com insightful analysis and reports contributed to our current analysis and in creating a future strategy. Besides, the te
Yosuke Mitsui
Senior Associate Construction Equipment Sales & Marketing
We asked them to research ‘Equipment market’ all over the world, and their whole arrangement was helpful to us. thehealthanalytics.com insightful analysis and reports contributed to our current analysis and in creating a future strategy. Besides, the te


