

Base Year Value ()
x.x %
x.x %
CAGR ()
x.x %
x.x %
Forecast Year Value ()
x.x %
x.x %
Historical Data Period
Largest Region
Forecast Period
Marché des écrans sans écran par type (image visuelle, affichage rétinien, interface synaptique), application (projection holographique, affichage monté sur la tête, affichage tête haute, autres), secteur vertical (aérospatiale et défense, automobile, commercial, électronique grand public, santé) et région, tendances mondiales et prévisions de 2022 à 2029.
Instant access to hundreds of data points and trends
- Market estimates from 2014-2029
- Competitive analysis, industry segmentation, financial benchmarks
- Incorporates SWOT, Porter's Five Forces and risk management frameworks
- PDF report or online database with Word, Excel and PowerPoint export options
- 100% money back guarantee
Aperçu du marché des écrans sans écran
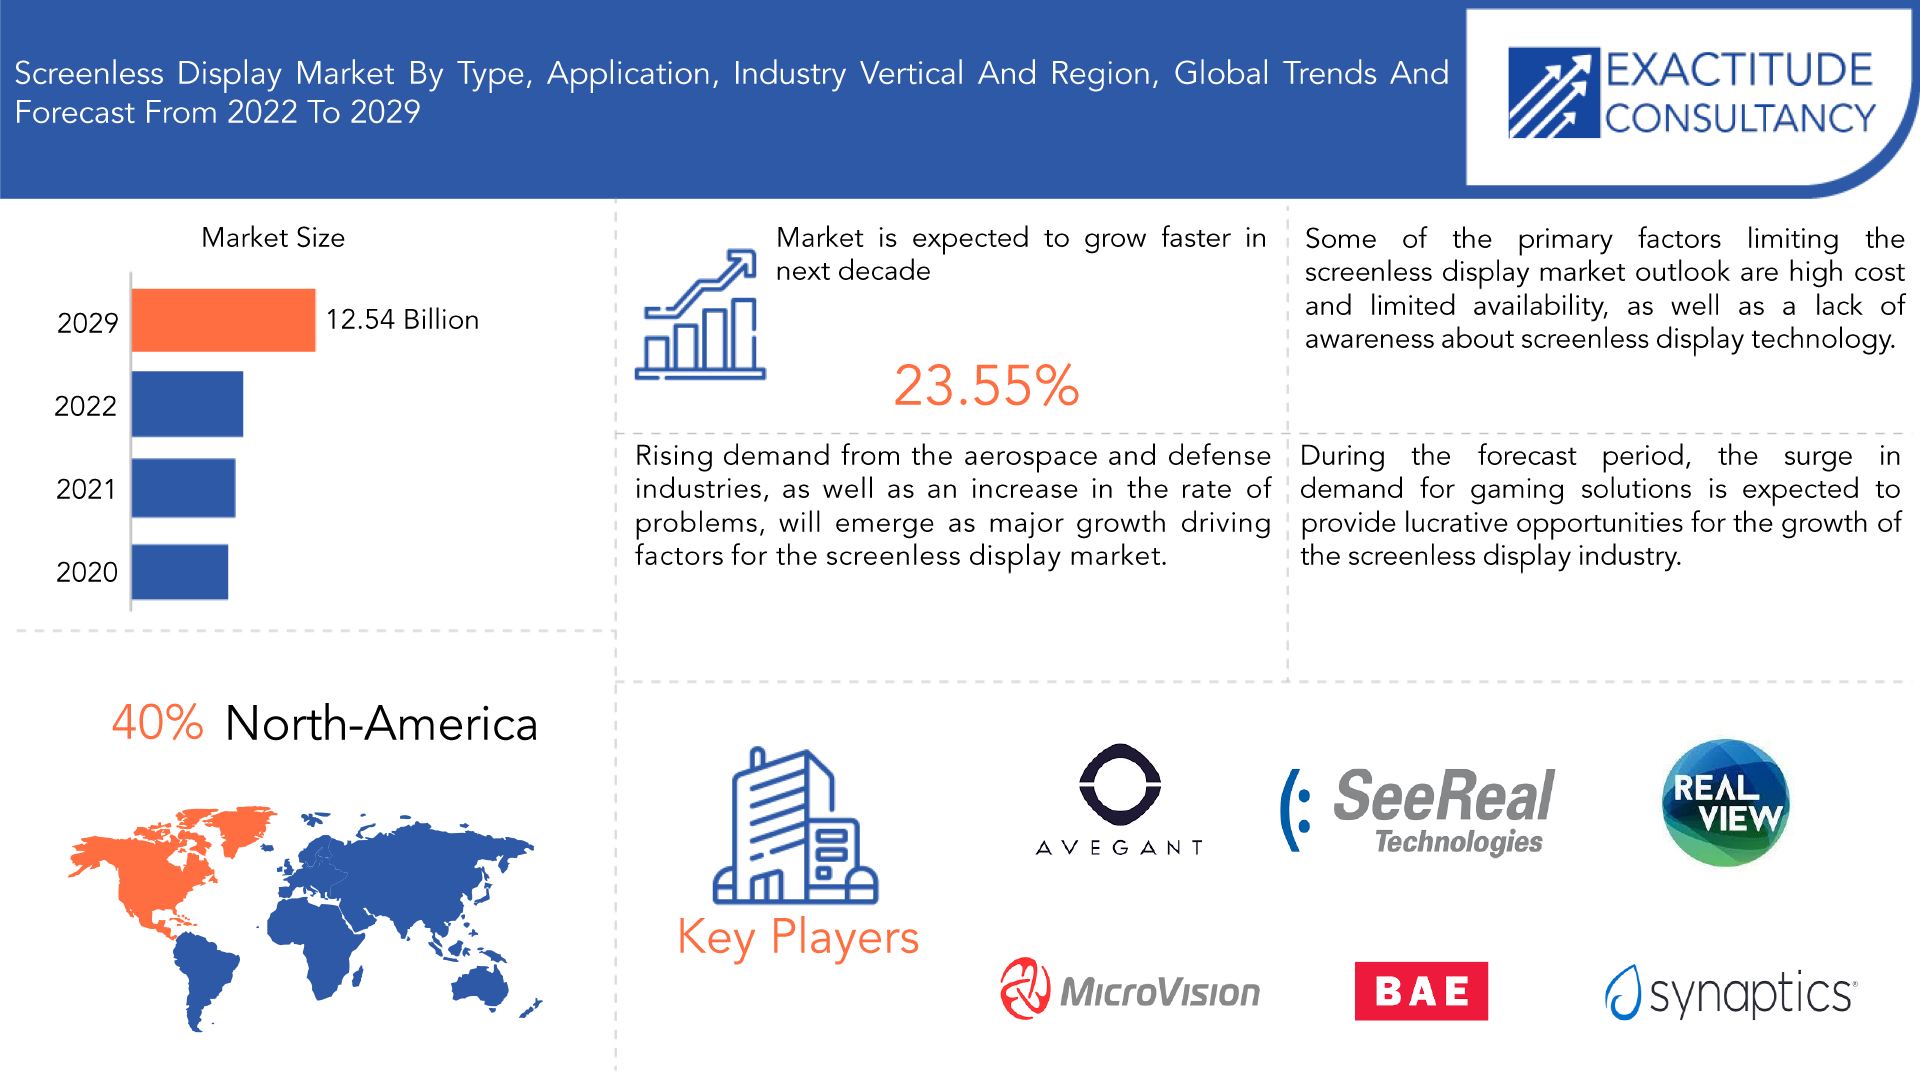
Le marché des écrans sans écran devrait croître à un TCAC de 23,55 % de 2022 à 2029. Il devrait atteindre plus de 12,54 milliards USD d'ici 2029, contre 1,87 milliard USD en 2020.
L'affichage sans écran est une technologie de projection interactive qui a été développée pour résoudre les problèmes liés à la miniaturisation des appareils de technologies de communication modernes. Le manque d'espace sur les écrans ouvre la possibilité de développer des écrans sans écran. Comme son nom l'indique, un écran sans écran n'a pas d'écran et est défini comme un écran utilisé pour transmettre des données telles que des images ou des vidéos sans utiliser d'écran. La technologie d'affichage la plus récente pour résoudre divers problèmes, les écrans sans écran remplacent la technologie des écrans tactiles. Un écran sans écran reflète les informations visuelles à l'aide de matériaux réfléchissants tels que des miroirs, des feuilles de plastique et du brouillard. Le développement de cette technologie résout le problème de l'espace d'affichage en raison de sa portabilité vers pratiquement n'importe quel endroit dans un rayon suffisant. L'utilisation d'écrans sans écran, qui devraient remédier aux failles de confidentialité et de sécurité et réduire le risque d'erreur, devrait stimuler la croissance du secteur. Ces moniteurs sans écran peuvent projeter des images 3D. Cette technologie permet de convertir très simplement un téléphone mobile en téléviseur. Les écrans et les graphiques bidimensionnels présentent certaines limitations qui peuvent être évitées. Cette technologie d'affichage sans écran utilise la projection interactive, la projection 3D et la présentation visuelle. Les écrans sans écran sont classés en trois types : les écrans rétiniens, les interfaces synaptiques et les écrans d'images visuelles. Plusieurs facteurs influencent le marché des écrans sans écran. Tout d'abord, l'expansion du marché est alimentée par la demande des consommateurs pour des technologies d'affichage immersives de pointe. Les écrans sans écran deviennent de plus en plus populaires dans les secteurs du jeu, du divertissement et de la publicité, car ils offrent des expériences utilisateur distinctives telles que les projections holographiques et la réalité virtuelle. Deuxièmement, la croissance du marché est accélérée par la demande croissante de solutions d'affichage portables et de petite taille. En réponse à la demande croissante de technologies portables et d'applications mobiles, les écrans sans écran offrent des alternatives portables et compactes aux écrans conventionnels. De plus, comme les écrans sans écran sont essentiels pour offrir des expériences AR/VR fluides et interactives, les avancées dans les technologies de réalité augmentée (AR) et de réalité virtuelle (VR) contribuent à la croissance du marché.
| ATTRIBUT | DÉTAILS |
| Période d'étude | 2020-2029 |
| Année de base | 2021 |
| Année estimée | 2022 |
| Année prévue | 2022-2029 |
| Période historique | 2018-2020 |
| Unité | Valeur (en milliards USD), (en milliers d'unités) |
| Segmentation | Par type, par application, par secteur d'activité, par région |
| Par type |
|
| Par application |
|
| Par secteur d'activité |
|
| Par région |
|
Certains obstacles à la croissance du marché des écrans sans écran existent. Tout d'abord, les obstacles à une adoption généralisée comprennent les coûts de développement élevés et les contraintes technologiques. Il faut des investissements importants dans la recherche, le développement et la fabrication pour produire des solutions d'affichage sans écran fiables et de haute qualité. Deuxièmement, les problèmes de compatibilité des plates-formes et des appareils présentent des difficultés. Des inquiétudes concernant la compatibilité peuvent survenir si les systèmes existants doivent être modifiés ou mis à niveau pour accueillir des écrans sans écran. Troisièmement, le manque de connaissances des consommateurs et le manque de familiarité avec les technologies d'affichage sans écran limitent l'expansion du marché. Les avantages et les capacités des écrans sans écran ne sont pas bien connus de nombreux clients potentiels, ce qui ralentit la pénétration du marché. Enfin et surtout, l'acceptation et l'adoption par les consommateurs des applications de réalité augmentée et de réalité virtuelle peuvent être limitées par des inquiétudes concernant la confidentialité et la sécurité. Le marché des écrans sans écran offre des opportunités pour des technologies innovantes qui peuvent fournir des expériences immersives et interactives sans l'utilisation d'un écran traditionnel. La réalité augmentée et virtuelle, les affichages tête haute pour les automobiles et les lunettes intelligentes pour les entreprises et les consommateurs font partie des applications. Le marché devrait se développer à mesure que la demande d'interfaces mains libres et intuitives augmente. La pandémie de COVID-19 a eu des répercussions positives et négatives sur le marché des écrans sans écran. D'une part, l'augmentation de l'utilisation des technologies d'affichage sans écran a été attribuée à la demande accrue de communication à distance et de collaboration virtuelle pendant les confinements. Le recours aux réunions virtuelles et à l'apprentissage à distance par les entreprises et les établissements d'enseignement a augmenté la demande de produits tels que les écrans holographiques et la réalité virtuelle. D'autre part, la pandémie a entravé les chaînes d'approvisionnement mondiales, entraînant des retards de production et des pénuries de composants, ce qui a eu un effet sur la disponibilité et la production d'appareils d'affichage sans écran. De plus, comme les particuliers et les entreprises ont donné la priorité aux achats essentiels par rapport aux dépenses discrétionnaires telles que les écrans sans écran, le ralentissement économique et la baisse des dépenses de consommation ont eu un impact sur la croissance globale du marché. [caption id="attachment_22906" align="aligncenter" width="1920"]
Frequently Asked Questions
What is the expected CAGR in terms of revenue for the global Screenless Display Market over the forecast period (2020–2029)?
The global Screenless Display Market revenue is projected to expand at a CAGR of 23.55% during the forecast period.
What was the global Screenless Display Market valued at in 2020?
The global Screenless Display Market was valued at USD 1.87 Billion in 2020.
Who are the key players in the Screenless Display Market?
Some key players operating in the Screenless Display Market include Avegant Corporation, BAE Systems, Microsoft Corporation, RealView Imaging Ltd., MicroVision Inc., Synaptic Incorporated, Seereal Technologies S.A., Google Inc., Holoxica Ltd., Zebra Imaging Inc.
Which are the factors that drive Screenless Display Market growth?
Low power & space requirements and enhanced privacy & security offered by the screenless display are driving the market during the forecast period.
Which region will lead the global Screenless Display Market?
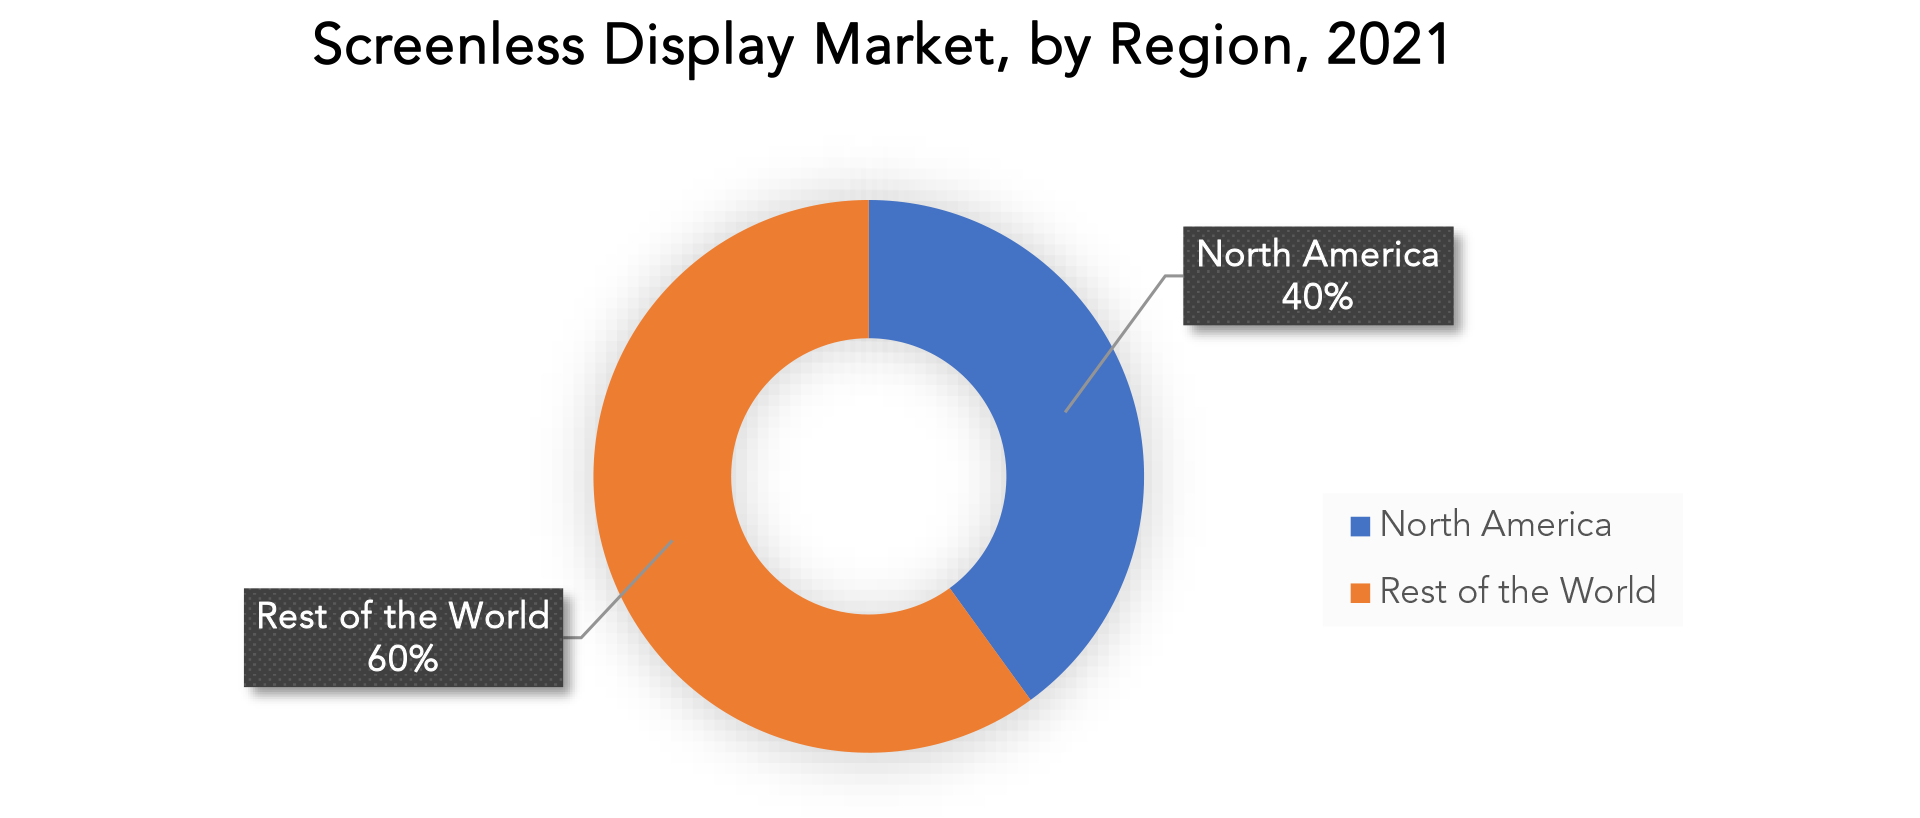
North America region will lead the global Screenless Display Market during the forecast period 2022 to 2029.
Screenless Display Market Segment Analysis
The Screenless Display Market is segmented based on type, application, industry vertical and region. By type the market is bifurcated into visual image, retinal display, synaptic interface; by application the market is bifurcated into holographic projection, head-mounted display, head-up display, others; by industry vertical the market is bifurcated into aerospace & defense, automotive, commercial, consumer electronics, healthcare. In 2021, the visual image segment dominated the market, accounting for 42% of total market revenue of USD 0.96 billion. The ability to recognize any image or thing with the naked human eye has contributed to the growth of the visual image segment. Visual representation Holographic projection technology is used by screenless displays to project 3D images or virtual objects, with uses in both entertainment and advertising. laser display Through the use of screenless technology, immersive experiences in VR and AR are made possible. Synaptic connection Screenless displays use neural signal processing to let users interact with digital content with their thoughts. This technology has potential uses in human-computer interaction and neurofeedback. In order to meet the growing demand for cutting-edge and immersive display options, these segments represent the wide range of screenless display technologies and their respective applications in various industries. The holographic projection segment accounted for 43% of the market in 2021, with a market revenue of 0.98 billion. Holographic projections provide high-quality display units, which drives the growth of the segment. In 2021, the healthcare segment accounted for 33% of the market and generated 0.7 billion in revenue. The increasing use of screenless displays in the healthcare industry by physicians during surgeries to view infected areas of patients drives the segment's growth. Screenless displays are used in the healthcare sector for patient monitoring, surgical navigation systems, and medical imaging, enabling precise visualisation and better medical procedures. Screenless display technologies are used by the aerospace and defence industry in applications like flight simulators, heads-up displays (HUDs), and training simulations to give pilots real-time information and improve situational awareness. [caption id="attachment_22910" align="aligncenter" width="1920"]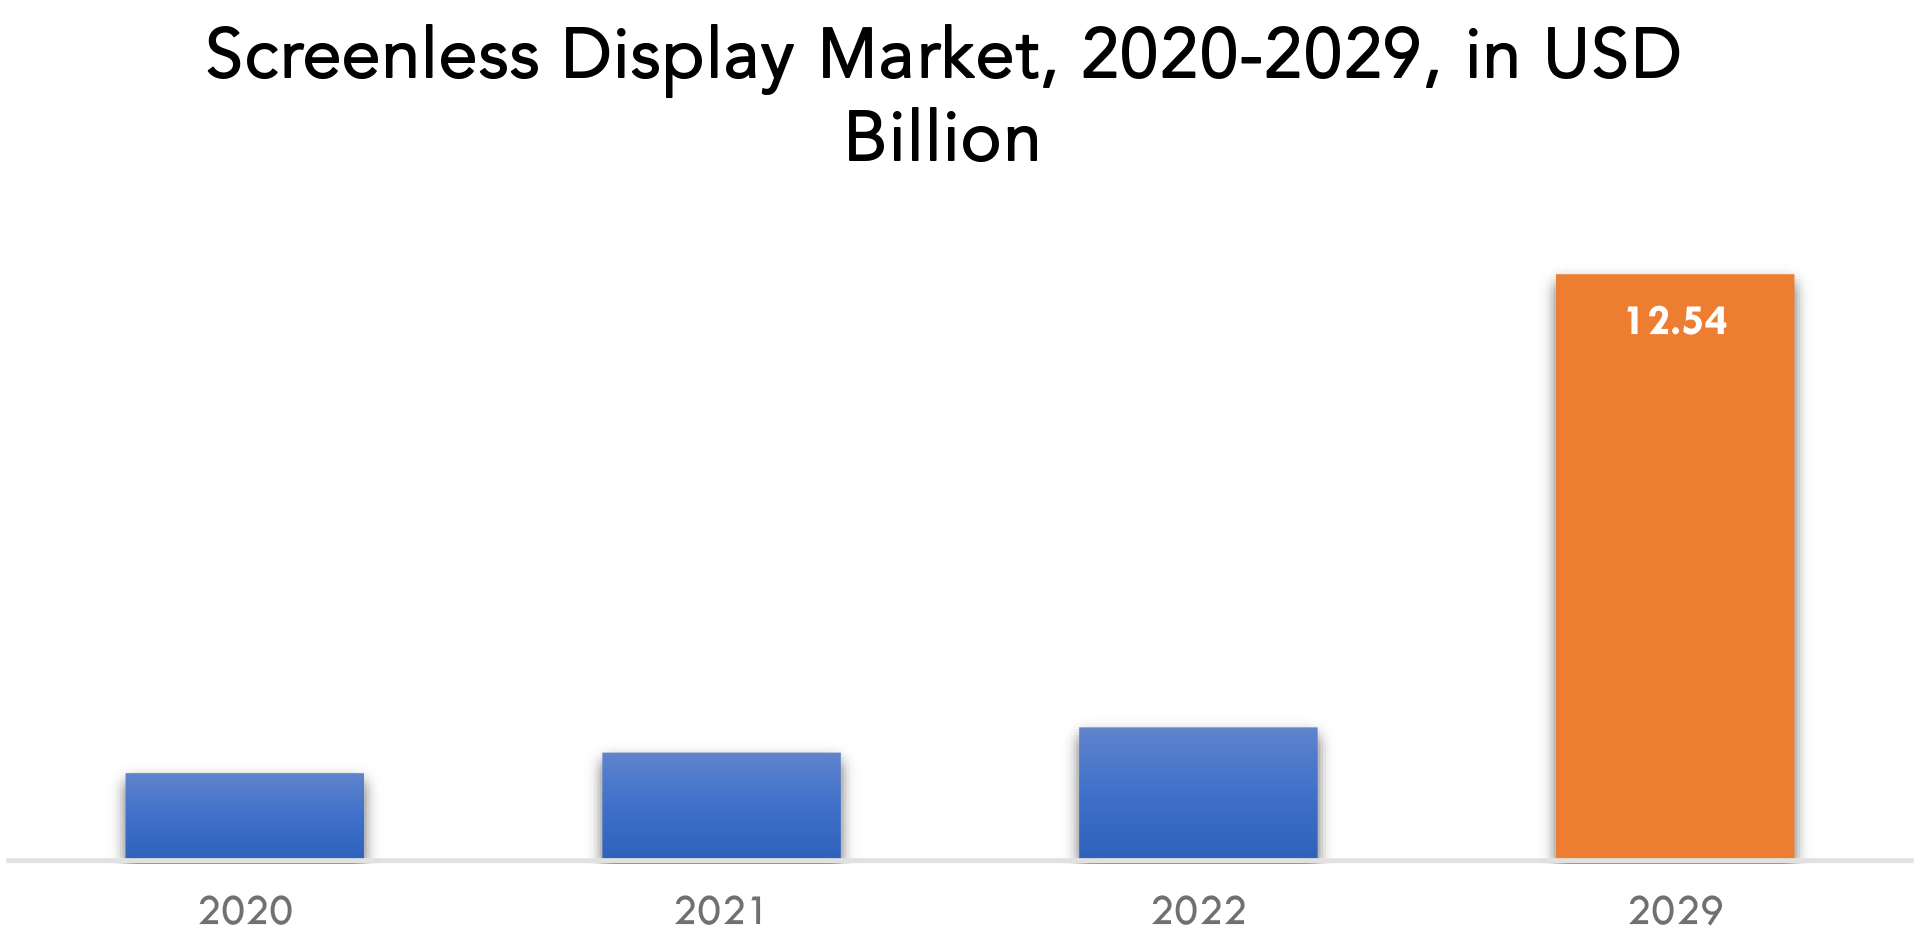
Screenless Display Market Key Players
The Screenless Display Market key players include Avegant Corporation, BAE Systems, Microsoft Corporation, RealView Imaging Ltd., MicroVision Inc., Synaptic Incorporated, Seereal Technologies S.A., Google Inc., Holoxica Ltd., Zebra Imaging Inc., and others. Recent Development: 14 April 2023: BAE Systems and Microsoft have signed a strategic agreement aiming to support faster and easier development, deployment and management of digital defence capabilities in an increasingly data centric world. 30 March 2023: BAE Systems, a leading aerospace and defense company, and Heart Aerospace, a Swedish electric airplane maker, announced a collaboration to define the battery system for Heart’s ES-30 regional electric airplane.Who Should Buy? Or Key Stakeholders
- Investors
- IT & Telecommunication Industry
- Automotive Industry
- Healthcare Industry
- End-users Companies
- Government Organization
- Regulatory Authorities
- Others
Screenless Display Market Regional Analysis
The Screenless Display Market by region includes North America, Asia-Pacific (APAC), Europe, South America, and Middle East & Africa (MEA).- North America: includes the US, Canada, Mexico, and Rest of North America
- Asia Pacific: includes China, Japan, South Korea, India, Australia, and Rest of APAC
- Europe: includes UK, Germany, France, Italy, Spain, Russia, and Rest of Europe
- South America: includes Brazil, Argentina, and Rest of South America
- Middle East & Africa: includes UAE, South Africa, Saudi Arabia and Rest of MEA
Key Market Segments: Screenless Display Market
Screenless Display Market By Type, 2020-2029, (USD Billion), (Thousand Units)- Visual Image
- Retinal Display
- Synaptic Interface
- Holographic Projection
- Head-Mounted Display
- Head-Up Display
- Others
- Aerospace & Defense
- Automotive
- Commercial
- Consumer Electronics
- Healthcare
- North America
- Asia Pacific
- Europe
- South America
- Middle East And Africa
Key Question Answered
- What is the expected growth rate of the Screenless Display Market over the next 7 years?
- Who are the major players in the Screenless Display Market and what is their market share?
- What are the end-user industries driving demand for market and what is their outlook?
- What are the opportunities for growth in emerging markets such as Asia-pacific, Middle East, and Africa?
- How is the economic environment affecting the Screenless Display Market, including factors such as interest rates, inflation, and exchange rates?
- What is the expected impact of government policies and regulations on the Screenless Display Market?
- What is the current and forecasted size and growth rate of the global Screenless Display Market?
- What are the key drivers of growth in the Screenless Display Market?
- Who are the major players in the market and what is their market share?
- What are the distribution channels and supply chain dynamics in the Screenless Display Market?
- What are the technological advancements and innovations in the Screenless Display Market and their impact on product development and growth?
- What are the regulatory considerations and their impact on the market?
- What are the challenges faced by players in the Screenless Display Market and how are they addressing these challenges?
- What are the opportunities for growth and expansion in the Screenless Display Market?
- INTRODUCTION
- DÉFINITION DU MARCHÉ
- SEGMENTATION DU MARCHÉ
- ÉCHÉANCES DE RECHERCHE
- Hypothèses et limites
- MÉTHODOLOGIE DE RECHERCHE
- EXPLORATION DE DONNÉES
- RECHERCHE SECONDAIRE
- RECHERCHE PRIMAIRE
- CONSEILS D'EXPERTS EN LA MATIÈRE
- CONTRÔLES DE QUALITÉ
- REVUE FINALE
- TRIANGULATION DES DONNÉES
- APPROCHE ASCENDANTE
- APPROCHE DESCENDANTE
- FLUX DE RECHERCHE
- SOURCES DE DONNÉES
- EXPLORATION DE DONNÉES
- RÉSUMÉ EXÉCUTIF
- APERÇU DU MARCHÉ
- PERSPECTIVES MONDIALES
- MOTEURS DU MARCHÉ
- RESTRICTIONS DU MARCHÉ
- OPPORTUNITÉS DE MARCHÉ
- IMPACT DU COVID-19 SUR LE MARCHÉ DES ÉCRANS SANS ÉCRAN
- MODÈLE DES CINQ FORCES DE PORTER
- THREAT FROM NEW ENTRANTS
- THREAT FROM SUBSTITUTES
- BARGAINING POWER OF SUPPLIERS
- BARGAINING POWER OF CUSTOMERS
- DEGREE OF COMPETITION
- INDUSTRY VALUE CHAIN ANALYSIS
- PERSPECTIVES MONDIALES
- GLOBAL SCREENLESS DISPLAY MARKET BY TYPE (USD BILLION), (THOUSAND UNITS) 2020-2029
- VISUAL IMAGE
- RETINAL DISPLAY
- SYNAPTIC INTERFACE
- GLOBAL SCREENLESS DISPLAY MARKET BY APPLICATION (USD BILLION), (THOUSAND UNITS) 2020-2029
- HOLOGRAPHIC PROJECTION
- HEAD-MOUNTED DISPLAY
- HEAD-UP DISPLAY
- OTHERS
- GLOBAL SCREENLESS DISPLAY MARKET BY INDUSTRY VERTICAL (USD BILLION), (THOUSAND UNITS) 2020-2029
- AEROSPACE & DEFENSE
- AUTOMOTIVE
- COMMERCIAL
- CONSUMER ELECTRONICS
- HEALTHCARE
- GLOBAL SCREENLESS DISPLAY MARKET BY REGION (USD BILLION), (THOUSAND UNITS) 2020-2029
- NORTH AMERICA
- US
- CANADA
- MEXICO
- REST OF NORTH AMERICA
- SOUTH AMERICA
- BRAZIL
- ARGENTINA
- COLOMBIA
- REST OF SOUTH AMERICA
- EUROPE
- GERMANY
- UK
- FRANCE
- ITALY
- SPAIN
- RUSSIA
- REST OF EUROPE
- ASIA PACIFIC
- INDIA
- CHINA
- JAPAN
- SOUTH KOREA
- AUSTRALIA
- REST OF ASIA PACIFIC
- MIDDLE EAST AND AFRICA
- UAE
- SAUDI ARABIA
- SOUTH AFRICA
- REST OF MIDDLE EAST AND AFRICA
- NORTH AMERICA
- COMPANY PROFILES*(BUSINESS OVERVIEW, COMPANY SNAPSHOT, PRODUCTS OFFERED, RECENT DEVELOPMENTS)
- AVEGANT CORPORATION
- BAE SYSTEMS
- MICROSOFT CORPORATION
- REALVIEW IMAGING LTD.
- MICROVISION INC.
- SYNAPTIC INCORPORATED
- SEEREAL TECHNOLOGIES S.A.
- GOOGLE INC.
- HOLOXICA LTD.
- ZEBRA IMAGING INC.*THE COMPANY LIST IS INDICATIVE
LIST OF TABLES
TABLE 1 GLOBAL SCREENLESS DISPLAY MARKET BY TYPE (USD BILLION), 2020-2029
TABLE 2 GLOBAL SCREENLESS DISPLAY MARKET BY TYPE (THOUSAND UNITS), 2020-2029
TABLE 3 GLOBAL SCREENLESS DISPLAY MARKET BY APPLICATION (USD BILLION), 2020-2029
TABLE 4 GLOBAL SCREENLESS DISPLAY MARKET BY APPLICATION (THOUSAND UNITS), 2020-2029
TABLE 5 GLOBAL SCREENLESS DISPLAY MARKET BY INDUSTRY VERTICAL (USD BILLION), 2020-2029
TABLE 6 GLOBAL SCREENLESS DISPLAY MARKET BY INDUSTRY VERTICAL (THOUSAND UNITS), 2020-2029
TABLE 7 GLOBAL SCREENLESS DISPLAY MARKET BY REGION (USD BILLION), 2020-2029
TABLE 8 GLOBAL SCREENLESS DISPLAY MARKET BY REGION (THOUSAND UNITS), 2020-2029
TABLE 9 NORTH AMERICA SCREENLESS DISPLAY MARKET BY TYPE (USD BILLION), 2020-2029
TABLE 10 NORTH AMERICA SCREENLESS DISPLAY MARKET BY TYPE (THOUSAND UNITS), 2020-2029
TABLE 11 NORTH AMERICA SCREENLESS DISPLAY MARKET BY APPLICATION (USD BILLION), 2020-2029
TABLE 12 NORTH AMERICA SCREENLESS DISPLAY MARKET BY APPLICATION (THOUSAND UNITS), 2020-2029
TABLE 13 NORTH AMERICA SCREENLESS DISPLAY MARKET BY INDUSTRY VERTICAL (USD BILLION), 2020-2029
TABLE 14 NORTH AMERICA SCREENLESS DISPLAY MARKET BY INDUSTRY VERTICAL (THOUSAND UNITS), 2020-2029
TABLE 15 NORTH AMERICA SCREENLESS DISPLAY MARKET BY COUNTRY (USD BILLION), 2020-2029
TABLE 16 NORTH AMERICA SCREENLESS DISPLAY MARKET BY COUNTRY (USD BILLION), 2020-2029
TABLE 17 US SCREENLESS DISPLAY MARKET BY TYPE (USD BILLION), 2020-2029
TABLE 18 US SCREENLESS DISPLAY MARKET BY TYPE (THOUSAND UNITS), 2020-2029
TABLE 19 US SCREENLESS DISPLAY MARKET BY APPLICATION (USD BILLION), 2020-2029
TABLE 20 US SCREENLESS DISPLAY MARKET BY APPLICATION (THOUSAND UNITS), 2020-2029
TABLE 21 US SCREENLESS DISPLAY MARKET BY INDUSTRY VERTICAL (USD BILLION), 2020-2029
TABLE 22 US SCREENLESS DISPLAY MARKET BY INDUSTRY VERTICAL (THOUSAND UNITS), 2020-2029
TABLE 23 CANADA SCREENLESS DISPLAY MARKET BY TYPE (BILLION), 2020-2029
TABLE 24 CANADA SCREENLESS DISPLAY MARKET BY TYPE (THOUSAND UNITS), 2020-2029
TABLE 25 CANADA SCREENLESS DISPLAY MARKET BY APPLICATION (USD BILLION), 2020-2029
TABLE 26 CANADA SCREENLESS DISPLAY MARKET BY APPLICATION (THOUSAND UNITS), 2020-2029
TABLE 27 CANADA SCREENLESS DISPLAY MARKET BY INDUSTRY VERTICAL (USD BILLION), 2020-2029
TABLE 28 CANADA SCREENLESS DISPLAY MARKET BY INDUSTRY VERTICAL (THOUSAND UNITS), 2020-2029
TABLE 29 MEXICO SCREENLESS DISPLAY MARKET BY TYPE (USD BILLION), 2020-2029
TABLE 30 MEXICO SCREENLESS DISPLAY MARKET BY TYPE (THOUSAND UNITS), 2020-2029
TABLE 31 MEXICO SCREENLESS DISPLAY MARKET BY APPLICATION (USD BILLION), 2020-2029
TABLE 32 MEXICO SCREENLESS DISPLAY MARKET BY APPLICATION (THOUSAND UNITS), 2020-2029
TABLE 33 MEXICO SCREENLESS DISPLAY MARKET BY INDUSTRY VERTICAL (USD BILLION), 2020-2029
TABLE 34 MEXICO SCREENLESS DISPLAY MARKET BY INDUSTRY VERTICAL (THOUSAND UNITS), 2020-2029
TABLE 35 REST OF NORTH AMERICA SCREENLESS DISPLAY MARKET BY TYPE (USD BILLION), 2020-2029
TABLE 36 REST OF NORTH AMERICA SCREENLESS DISPLAY MARKET BY TYPE (THOUSAND UNITS), 2020-2029
TABLE 37 REST OF NORTH AMERICA SCREENLESS DISPLAY MARKET BY APPLICATION (USD BILLION), 2020-2029
TABLE 38 REST OF NORTH AMERICA SCREENLESS DISPLAY MARKET BY APPLICATION (THOUSAND UNITS), 2020-2029
TABLE 39 REST OF NORTH AMERICA SCREENLESS DISPLAY MARKET BY INDUSTRY VERTICAL (USD BILLION), 2020-2029
TABLE 40 REST OF NORTH AMERICA SCREENLESS DISPLAY MARKET BY INDUSTRY VERTICAL (THOUSAND UNITS), 2020-2029
TABLE 41 SOUTH AMERICA SCREENLESS DISPLAY MARKET BY TYPE (USD BILLION), 2020-2029
TABLE 42 SOUTH AMERICA SCREENLESS DISPLAY MARKET BY TYPE (THOUSAND UNITS), 2020-2029
TABLE 43 SOUTH AMERICA SCREENLESS DISPLAY MARKET BY APPLICATION (USD BILLION), 2020-2029
TABLE 44 SOUTH AMERICA SCREENLESS DISPLAY MARKET BY APPLICATION (THOUSAND UNITS), 2020-2029
TABLE 45 SOUTH AMERICA SCREENLESS DISPLAY MARKET BY INDUSTRY VERTICAL (USD BILLION), 2020-2029
TABLE 46 SOUTH AMERICA SCREENLESS DISPLAY MARKET BY INDUSTRY VERTICAL (THOUSAND UNITS), 2020-2029
TABLE 47 SOUTH AMERICA SCREENLESS DISPLAY MARKET BY COUNTRY (USD BILLION), 2020-2029
TABLE 48 SOUTH AMERICA SCREENLESS DISPLAY MARKET BY COUNTRY (USD BILLION), 2020-2029
TABLE 49 BRAZIL SCREENLESS DISPLAY MARKET BY TYPE (USD BILLION), 2020-2029
TABLE 50 BRAZIL SCREENLESS DISPLAY MARKET BY TYPE (THOUSAND UNITS), 2020-2029
TABLE 51 BRAZIL SCREENLESS DISPLAY MARKET BY APPLICATION (USD BILLION), 2020-2029
TABLE 52 BRAZIL SCREENLESS DISPLAY MARKET BY APPLICATION (THOUSAND UNITS), 2020-2029
TABLE 53 BRAZIL SCREENLESS DISPLAY MARKET BY INDUSTRY VERTICAL (USD BILLION), 2020-2029
TABLE 54 BRAZIL SCREENLESS DISPLAY MARKET BY INDUSTRY VERTICAL (THOUSAND UNITS), 2020-2029
TABLE 55 ARGENTINA SCREENLESS DISPLAY MARKET BY TYPE (USD BILLION), 2020-2029
TABLE 56 ARGENTINA SCREENLESS DISPLAY MARKET BY TYPE (THOUSAND UNITS), 2020-2029
TABLE 57 ARGENTINA SCREENLESS DISPLAY MARKET BY APPLICATION (USD BILLION), 2020-2029
TABLE 58 ARGENTINA SCREENLESS DISPLAY MARKET BY APPLICATION (THOUSAND UNITS), 2020-2029
TABLE 59 ARGENTINA SCREENLESS DISPLAY MARKET BY INDUSTRY VERTICAL (USD BILLION), 2020-2029
TABLE 60 ARGENTINA SCREENLESS DISPLAY MARKET BY INDUSTRY VERTICAL (THOUSAND UNITS), 2020-2029
TABLE 61 COLOMBIA SCREENLESS DISPLAY MARKET BY TYPE (USD BILLION), 2020-2029
TABLE 62 COLOMBIA SCREENLESS DISPLAY MARKET BY TYPE (THOUSAND UNITS), 2020-2029
TABLE 63 COLOMBIA SCREENLESS DISPLAY MARKET BY APPLICATION (USD BILLION), 2020-2029
TABLE 64 COLOMBIA SCREENLESS DISPLAY MARKET BY APPLICATION (THOUSAND UNITS), 2020-2029
TABLE 65 COLOMBIA SCREENLESS DISPLAY MARKET BY INDUSTRY VERTICAL (USD BILLION), 2020-2029
TABLE 66 COLOMBIA SCREENLESS DISPLAY MARKET BY INDUSTRY VERTICAL (THOUSAND UNITS), 2020-2029
TABLE 67 REST OF SOUTH AMERICA SCREENLESS DISPLAY MARKET BY TYPE (USD BILLION), 2020-2029
TABLE 68 REST OF SOUTH AMERICA SCREENLESS DISPLAY MARKET BY TYPE (THOUSAND UNITS), 2020-2029
TABLE 69 REST OF SOUTH AMERICA SCREENLESS DISPLAY MARKET BY APPLICATION (USD BILLION), 2020-2029
TABLE 70 REST OF SOUTH AMERICA SCREENLESS DISPLAY MARKET BY APPLICATION (THOUSAND UNITS), 2020-2029
TABLE 71 REST OF SOUTH AMERICA SCREENLESS DISPLAY MARKET BY INDUSTRY VERTICAL (USD BILLION), 2020-2029
TABLE 72 REST OF SOUTH AMERICA SCREENLESS DISPLAY MARKET BY INDUSTRY VERTICAL (THOUSAND UNITS), 2020-2029
TABLE 73 ASIA -PACIFIC SCREENLESS DISPLAY MARKET BY TYPE (USD BILLION), 2020-2029
TABLE 74 ASIA -PACIFIC SCREENLESS DISPLAY MARKET BY TYPE (THOUSAND UNITS), 2020-2029
TABLE 75 ASIA -PACIFIC SCREENLESS DISPLAY MARKET BY APPLICATION (USD BILLION), 2020-2029
TABLE 76 ASIA -PACIFIC SCREENLESS DISPLAY MARKET BY APPLICATION (THOUSAND UNITS), 2020-2029
TABLE 77 ASIA -PACIFIC SCREENLESS DISPLAY MARKET BY INDUSTRY VERTICAL (USD BILLION), 2020-2029
TABLE 78 ASIA -PACIFIC SCREENLESS DISPLAY MARKET BY INDUSTRY VERTICAL (THOUSAND UNITS), 2020-2029
TABLE 79 ASIA -PACIFIC SCREENLESS DISPLAY MARKET BY COUNTRY (USD BILLION), 2020-2029
TABLE 80 ASIA -PACIFIC SCREENLESS DISPLAY MARKET BY COUNTRY (THOUSAND UNITS), 2020-2029
TABLE 81 INDIA SCREENLESS DISPLAY MARKET BY TYPE (USD BILLION), 2020-2029
TABLE 82 INDIA SCREENLESS DISPLAY MARKET BY TYPE (THOUSAND UNITS), 2020-2029
TABLE 83 INDIA SCREENLESS DISPLAY MARKET BY APPLICATION (USD BILLION), 2020-2029
TABLE 84 INDIA SCREENLESS DISPLAY MARKET BY APPLICATION (THOUSAND UNITS), 2020-2029
TABLE 85 INDIA SCREENLESS DISPLAY MARKET BY INDUSTRY VERTICAL (USD BILLION), 2020-2029
TABLE 86 INDIA SCREENLESS DISPLAY MARKET BY INDUSTRY VERTICAL (THOUSAND UNITS), 2020-2029
TABLE 87 CHINA SCREENLESS DISPLAY MARKET BY TYPE (USD BILLION), 2020-2029
TABLE 88 CHINA SCREENLESS DISPLAY MARKET BY TYPE (THOUSAND UNITS), 2020-2029
TABLE 89 CHINA SCREENLESS DISPLAY MARKET BY APPLICATION (USD BILLION), 2020-2029
TABLE 90 CHINA SCREENLESS DISPLAY MARKET BY APPLICATION (THOUSAND UNITS), 2020-2029
TABLE 91 CHINA SCREENLESS DISPLAY MARKET BY INDUSTRY VERTICAL (USD BILLION), 2020-2029
TABLE 92 CHINA SCREENLESS DISPLAY MARKET BY INDUSTRY VERTICAL (THOUSAND UNITS), 2020-2029
TABLE 93 JAPAN SCREENLESS DISPLAY MARKET BY TYPE (USD BILLION), 2020-2029
TABLE 94 JAPAN SCREENLESS DISPLAY MARKET BY TYPE (THOUSAND UNITS), 2020-2029
TABLE 95 JAPAN SCREENLESS DISPLAY MARKET BY APPLICATION (USD BILLION), 2020-2029
TABLE 96 JAPAN SCREENLESS DISPLAY MARKET BY APPLICATION (THOUSAND UNITS), 2020-2029
TABLE 97 JAPAN SCREENLESS DISPLAY MARKET BY INDUSTRY VERTICAL (USD BILLION), 2020-2029
TABLE 98 JAPAN SCREENLESS DISPLAY MARKET BY INDUSTRY VERTICAL (THOUSAND UNITS), 2020-2029
TABLE 99 SOUTH KOREA SCREENLESS DISPLAY MARKET BY TYPE (USD BILLION), 2020-2029
TABLE 100 SOUTH KOREA SCREENLESS DISPLAY MARKET BY TYPE (THOUSAND UNITS), 2020-2029
TABLE 101 SOUTH KOREA SCREENLESS DISPLAY MARKET BY APPLICATION (USD BILLION), 2020-2029
TABLE 102 SOUTH KOREA SCREENLESS DISPLAY MARKET BY APPLICATION (THOUSAND UNITS), 2020-2029
TABLE 103 SOUTH KOREA SCREENLESS DISPLAY MARKET BY INDUSTRY VERTICAL (USD BILLION), 2020-2029
TABLE 104 SOUTH KOREA SCREENLESS DISPLAY MARKET BY INDUSTRY VERTICAL (THOUSAND UNITS), 2020-2029
TABLE 105 AUSTRALIA SCREENLESS DISPLAY MARKET BY TYPE (USD BILLION), 2020-2029
TABLE 106 AUSTRALIA SCREENLESS DISPLAY MARKET BY APPLICATIONBY TYPE (THOUSAND UNITS), 2020-2029
TABLE 107 AUSTRALIA SCREENLESS DISPLAY MARKET BY APPLICATION (USD BILLION), 2020-2029
TABLE 108 AUSTRALIA SCREENLESS DISPLAY MARKET BY APPLICATION (THOUSAND UNITS), 2020-2029
TABLE 109 AUSTRALIA SCREENLESS DISPLAY MARKET BY INDUSTRY VERTICAL (USD BILLION), 2020-2029
TABLE 110 AUSTRALIA SCREENLESS DISPLAY MARKET BY INDUSTRY VERTICAL (THOUSAND UNITS), 2020-2029
TABLE 111 REST OF ASIA PACIFIC SCREENLESS DISPLAY MARKET BY TYPE (USD BILLION), 2020-2029
TABLE 112 REST OF ASIA PACIFIC SCREENLESS DISPLAY MARKET BY APPLICATIONBY TYPE (THOUSAND UNITS), 2020-2029
TABLE 113 REST OF ASIA PACIFIC SCREENLESS DISPLAY MARKET BY APPLICATION (USD BILLION), 2020-2029
TABLE 114 REST OF ASIA PACIFIC SCREENLESS DISPLAY MARKET BY APPLICATION (THOUSAND UNITS), 2020-2029
TABLE 115 REST OF ASIA PACIFIC SCREENLESS DISPLAY MARKET BY INDUSTRY VERTICAL (USD BILLION), 2020-2029
TABLE 116 REST OF ASIA PACIFIC SCREENLESS DISPLAY MARKET BY INDUSTRY VERTICAL (THOUSAND UNITS), 2020-2029
TABLE 117 EUROPE SCREENLESS DISPLAY MARKET BY TYPE (USD BILLION), 2020-2029
TABLE 118 EUROPE SCREENLESS DISPLAY MARKET BY TYPE (THOUSAND UNITS), 2020-2029
TABLE 119 EUROPE SCREENLESS DISPLAY MARKET BY APPLICATION (USD BILLION), 2020-2029
TABLE 120 EUROPE SCREENLESS DISPLAY MARKET BY APPLICATION (THOUSAND UNITS), 2020-2029
TABLE 121 EUROPE SCREENLESS DISPLAY MARKET BY INDUSTRY VERTICAL (USD BILLION), 2020-2029
TABLE 122 EUROPE SCREENLESS DISPLAY MARKET BY INDUSTRY VERTICAL (THOUSAND UNITS), 2020-2029
TABLE 123 EUROPE SCREENLESS DISPLAY MARKET BY COUNTRY (USD BILLION), 2020-2029
TABLE 124 EUROPE SCREENLESS DISPLAY MARKET BY COUNTRY (THOUSAND UNITS), 2020-2029
TABLE 125 GERMANY SCREENLESS DISPLAY MARKET BY TYPE (USD BILLION), 2020-2029
TABLE 126 GERMANY SCREENLESS DISPLAY MARKET BY TYPE (THOUSAND UNITS), 2020-2029
TABLE 127 GERMANY SCREENLESS DISPLAY MARKET BY APPLICATION (USD BILLION), 2020-2029
TABLE 128 GERMANY SCREENLESS DISPLAY MARKET BY APPLICATION (THOUSAND UNITS), 2020-2029
TABLE 129 GERMANY SCREENLESS DISPLAY MARKET BY INDUSTRY VERTICAL (USD BILLION), 2020-2029
TABLE 130 GERMANY SCREENLESS DISPLAY MARKET BY INDUSTRY VERTICAL (THOUSAND UNITS), 2020-2029
TABLE 131 UK SCREENLESS DISPLAY MARKET BY TYPE (USD BILLION), 2020-2029
TABLE 132 UK SCREENLESS DISPLAY MARKET BY TYPE (THOUSAND UNITS), 2020-2029
TABLE 133 UK SCREENLESS DISPLAY MARKET BY APPLICATION (USD BILLION), 2020-2029
TABLE 134 UK SCREENLESS DISPLAY MARKET BY APPLICATION (THOUSAND UNITS), 2020-2029
TABLE 135 UK SCREENLESS DISPLAY MARKET BY INDUSTRY VERTICAL (USD BILLION), 2020-2029
TABLE 136 UK SCREENLESS DISPLAY MARKET BY INDUSTRY VERTICAL (USD BILLION), 2020-2029
TABLE 137 FRANCE SCREENLESS DISPLAY MARKET BY TYPE (USD BILLION), 2020-2029
TABLE 138 FRANCE SCREENLESS DISPLAY MARKET BY TYPE (THOUSAND UNITS), 2020-2029
TABLE 139 FRANCE SCREENLESS DISPLAY MARKET BY APPLICATION (USD BILLION), 2020-2029
TABLE 140 FRANCE SCREENLESS DISPLAY MARKET BY APPLICATION (THOUSAND UNITS), 2020-2029
TABLE 141 FRANCE SCREENLESS DISPLAY MARKET BY INDUSTRY VERTICAL (USD BILLION), 2020-2029
TABLE 142 FRANCE SCREENLESS DISPLAY MARKET BY INDUSTRY VERTICAL (THOUSAND UNITS), 2020-2029
TABLE 143 ITALY SCREENLESS DISPLAY MARKET BY TYPE (USD BILLION), 2020-2029
TABLE 144 ITALY SCREENLESS DISPLAY MARKET BY TYPE (THOUSAND UNITS), 2020-2029
TABLE 145 ITALY SCREENLESS DISPLAY MARKET BY APPLICATION (USD BILLION), 2020-2029
TABLE 146 ITALY SCREENLESS DISPLAY MARKET BY APPLICATION (THOUSAND UNITS), 2020-2029
TABLE 147 ITALY SCREENLESS DISPLAY MARKET BY INDUSTRY VERTICAL (USD BILLION), 2020-2029
TABLE 148 ITALY SCREENLESS DISPLAY MARKET BY INDUSTRY VERTICAL (THOUSAND UNITS), 2020-2029
TABLE 149 SPAIN SCREENLESS DISPLAY MARKET BY TYPE (USD BILLION), 2020-2029
TABLE 150 SPAIN SCREENLESS DISPLAY MARKET BY TYPE (THOUSAND UNITS), 2020-2029
TABLE 151 SPAIN SCREENLESS DISPLAY MARKET BY APPLICATION (USD BILLION), 2020-2029
TABLE 152 SPAIN SCREENLESS DISPLAY MARKET BY APPLICATION (THOUSAND UNITS), 2020-2029
TABLE 153 SPAIN SCREENLESS DISPLAY MARKET BY INDUSTRY VERTICAL (USD BILLION), 2020-2029
TABLE 154 SPAIN SCREENLESS DISPLAY MARKET BY INDUSTRY VERTICAL (THOUSAND UNITS), 2020-2029
TABLE 155 RUSSIA SCREENLESS DISPLAY MARKET BY TYPE (USD BILLION), 2020-2029
TABLE 156 RUSSIA SCREENLESS DISPLAY MARKET BY TYPE (THOUSAND UNITS), 2020-2029
TABLE 157 RUSSIA SCREENLESS DISPLAY MARKET BY APPLICATION (USD BILLION), 2020-2029
TABLE 158 RUSSIA SCREENLESS DISPLAY MARKET BY APPLICATION (THOUSAND UNITS), 2020-2029
TABLE 159 RUSSIA SCREENLESS DISPLAY MARKET BY INDUSTRY VERTICAL (USD BILLION), 2020-2029
TABLE 160 RUSSIA SCREENLESS DISPLAY MARKET BY INDUSTRY VERTICAL (THOUSAND UNITS), 2020-2029
TABLE 161 REST OF EUROPE SCREENLESS DISPLAY MARKET BY TYPE (USD BILLION), 2020-2029
TABLE 162 REST OF EUROPE SCREENLESS DISPLAY MARKET BY TYPE (THOUSAND UNITS), 2020-2029
TABLE 163 REST OF EUROPE SCREENLESS DISPLAY MARKET BY APPLICATION (USD BILLION), 2020-2029
TABLE 164 REST OF EUROPE SCREENLESS DISPLAY MARKET BY APPLICATION (THOUSAND UNITS), 2020-2029
TABLE 165 REST OF EUROPE SCREENLESS DISPLAY MARKET BY INDUSTRY VERTICAL (USD BILLION), 2020-2029
TABLE 166 REST OF EUROPE SCREENLESS DISPLAY MARKET BY INDUSTRY VERTICAL (THOUSAND UNITS), 2020-2029
TABLE 167 MIDDLE EAST AND AFRICA SCREENLESS DISPLAY MARKET BY TYPE (USD BILLION), 2020-2029
TABLE 168 MIDDLE EAST AND AFRICA SCREENLESS DISPLAY MARKET BY TYPE (THOUSAND UNITS), 2020-2029
TABLE 169 MIDDLE EAST AND AFRICA SCREENLESS DISPLAY MARKET BY APPLICATION (USD BILLION), 2020-2029
TABLE 170 MIDDLE EAST AND AFRICA SCREENLESS DISPLAY MARKET BY APPLICATION (THOUSAND UNITS), 2020-2029
TABLE 171 MIDDLE EAST AND AFRICA SCREENLESS DISPLAY MARKET BY INDUSTRY VERTICAL (USD BILLION), 2020-2029
TABLE 172 MIDDLE EAST AND AFRICA SCREENLESS DISPLAY MARKET BY INDUSTRY VERTICAL (THOUSAND UNITS), 2020-2029
TABLE 173 MIDDLE EAST ABD AFRICA SCREENLESS DISPLAY MARKET BY COUNTRY (USD BILLION), 2020-2029
TABLE 174 MIDDLE EAST ABD AFRICA SCREENLESS DISPLAY MARKET BY COUNTRY (THOUSAND UNITS), 2020-2029
TABLE 175 UAE SCREENLESS DISPLAY MARKET BY TYPE (USD BILLION), 2020-2029
TABLE 176 UAE SCREENLESS DISPLAY MARKET BY TYPE (THOUSAND UNITS), 2020-2029
TABLE 177 UAE SCREENLESS DISPLAY MARKET BY APPLICATION (USD BILLION), 2020-2029
TABLE 178 UAE SCREENLESS DISPLAY MARKET BY APPLICATION (THOUSAND UNITS), 2020-2029
TABLE 179 UAE SCREENLESS DISPLAY MARKET BY INDUSTRY VERTICAL (USD BILLION), 2020-2029
TABLE 180 UAE SCREENLESS DISPLAY MARKET BY INDUSTRY VERTICAL (THOUSAND UNITS), 2020-2029
TABLE 181 SAUDI ARABIA SCREENLESS DISPLAY MARKET BY TYPE (USD BILLION), 2020-2029
TABLE 182 SAUDI ARABIA SCREENLESS DISPLAY MARKET BY TYPE (THOUSAND UNITS), 2020-2029
TABLE 183 SAUDI ARABIA SCREENLESS DISPLAY MARKET BY APPLICATION (USD BILLION), 2020-2029
TABLE 184 SAUDI ARABIA SCREENLESS DISPLAY MARKET BY APPLICATION (THOUSAND UNITS), 2020-2029
TABLE 185 SAUDI ARABIA SCREENLESS DISPLAY MARKET BY INDUSTRY VERTICAL (USD BILLION), 2020-2029
TABLE 186 SAUDI ARABIA SCREENLESS DISPLAY MARKET BY INDUSTRY VERTICAL (THOUSAND UNITS), 2020-2029
TABLE 187 SOUTH AFRICA SCREENLESS DISPLAY MARKET BY TYPE (USD BILLION), 2020-2029
TABLE 188 SOUTH AFRICA SCREENLESS DISPLAY MARKET BY TYPE (THOUSAND UNITS), 2020-2029
TABLE 189 SOUTH AFRICA SCREENLESS DISPLAY MARKET BY APPLICATION (USD BILLION), 2020-2029
TABLE 190 SOUTH AFRICA SCREENLESS DISPLAY MARKET BY APPLICATION (THOUSAND UNITS), 2020-2029
TABLE 191 SOUTH AFRICA SCREENLESS DISPLAY MARKET BY INDUSTRY VERTICAL (USD BILLION), 2020-2029
TABLE 192 SOUTH AFRICA SCREENLESS DISPLAY MARKET BY INDUSTRY VERTICAL (THOUSAND UNITS), 2020-2029
TABLE 193 REST OF MIDDLE EAST AND AFRICA SCREENLESS DISPLAY MARKET BY TYPE (USD BILLION), 2020-2029
TABLE 194 REST OF MIDDLE EAST AND AFRICA SCREENLESS DISPLAY MARKET BY TYPE (THOUSAND UNITS), 2020-2029
TABLE 195 REST OF MIDDLE EAST AND AFRICA SCREENLESS DISPLAY MARKET BY APPLICATION (USD BILLION), 2020-2029
TABLE 196 REST OF MIDDLE EAST AND AFRICA SCREENLESS DISPLAY MARKET BY APPLICATION (THOUSAND UNITS), 2020-2029
TABLE 197 REST OF MIDDLE EAST AND AFRICA SCREENLESS DISPLAY MARKET BY INDUSTRY VERTICAL (USD BILLION), 2020-2029
TABLE 198 REST OF MIDDLE EAST AND AFRICA SCREENLESS DISPLAY MARKET BY INDUSTRY VERTICAL (THOUSAND UNITS), 2020-2029
LIST OF FIGURES
FIGURE 1 MARKET DYNAMICS
FIGURE 2 MARKET SEGMENTATION
FIGURE 3 REPORT TIMELINES: YEARS CONSIDERED
FIGURE 4 DATA TRIANGULATION
FIGURE 5 BOTTOM-UP APPROACH
FIGURE 6 TOP-DOWN APPROACH
FIGURE 7 RESEARCH FLOW
FIGURE 8 GLOBAL SCREENLESS DISPLAY MARKET BY TYPE, USD BILLION, 2020-2029
FIGURE 9 GLOBAL SCREENLESS DISPLAY MARKET BY APPLICATION, USD BILLION, 2020-2029
FIGURE 10 GLOBAL SCREENLESS DISPLAY MARKET BY INDUSTRY VERTICAL, USD BILLION, 2020-2029
FIGURE 11 GLOBAL SCREENLESS DISPLAY MARKET BY REGION, USD BILLION, 2020-2029
FIGURE 12 PORTER’S FIVE FORCES MODEL
FIGURE 13 GLOBAL SCREENLESS DISPLAY MARKET BY REGION, USD BILLION, 2021
FIGURE 14 GLOBAL SCREENLESS DISPLAY MARKET BY TYPE, USD BILLION, 2021
FIGURE 15 GLOBAL SCREENLESS DISPLAY MARKET BY APPLICATION, USD BILLION, 2021
FIGURE 16 GLOBAL SCREENLESS DISPLAY MARKET BY INDUSTRY VERTICAL, USD BILLION, 2021
FIGURE 17 MARKET SHARE ANALYSIS
FIGURE 18 AVEGANT CORPORATION: COMPANY SNAPSHOT
FIGURE 19 BAE SYSTEMS: COMPANY SNAPSHOT
FIGURE 20 MICROSOFT CORPORATION: COMPANY SNAPSHOT
FIGURE 21 REALVIEW IMAGING LTD.: COMPANY SNAPSHOT
FIGURE 22 MICROVISION INC.: COMPANY SNAPSHOT
FIGURE 23 SYNAPTIC INCORPORATED: COMPANY SNAPSHOT
FIGURE 24 SEEREAL TECHNOLOGIES S.A.: COMPANY SNAPSHOT
FIGURE 25 GOOGLE INC.: COMPANY SNAPSHOT
FIGURE 26 HOLOXICA LTD.: COMPANY SNAPSHOT
FIGURE 27 ZEBRA IMAGING INC.: COMPANY SNAPSHOT
DOWNLOAD FREE SAMPLE REPORT
License Type
SPEAK WITH OUR ANALYST
Want to know more about the report or any specific requirement?
WANT TO CUSTOMIZE THE REPORT?
Our Clients Speak
We asked them to research ‘ Equipment market’ all over the world, and their whole arrangement was helpful to us. thehealthanalytics.com insightful analysis and reports contributed to our current analysis and in creating a future strategy. Besides, the te
Yosuke Mitsui
Senior Associate Construction Equipment Sales & Marketing
We asked them to research ‘Equipment market’ all over the world, and their whole arrangement was helpful to us. thehealthanalytics.com insightful analysis and reports contributed to our current analysis and in creating a future strategy. Besides, the te


