

Base Year Value ()
x.x %
x.x %
CAGR ()
x.x %
x.x %
Forecast Year Value ()
x.x %
x.x %
Historical Data Period
Largest Region
Forecast Period
Marché de la mousse PET par matière première (PET vierge, PET recyclé), par qualité (faible densité, haute densité), par application (énergie éolienne, transport, marine) et par région, tendances mondiales et prévisions de 2023 à 2029
Instant access to hundreds of data points and trends
- Market estimates from 2014-2029
- Competitive analysis, industry segmentation, financial benchmarks
- Incorporates SWOT, Porter's Five Forces and risk management frameworks
- PDF report or online database with Word, Excel and PowerPoint export options
- 100% money back guarantee
Aperçu du marché de la mousse PET
Le marché de la mousse PET devrait croître à un TCAC de 7,6 % entre 2022 et 2029. Il devrait atteindre plus de 646,8 millions USD d'ici 2029, contre 360 millions USD en 2021.
La mousse PET est un type particulier de mousse fabriquée à partir du polymère poly(téréphtalate d'éthylène). C'est un matériau polyvalent qui peut être utilisé pour l'isolation, l'emballage et le rembourrage. Il est léger, solide et flexible. La résine PET est chauffée à une température et une pression élevées, ce qui lui permet de se dilater et de former de la mousse, pour créer de la mousse PET. En raison de sa structure à cellules fermées et de son poids léger, la mousse obtenue est un isolant supérieur. C'est une option solide pour les applications d'emballage et de rembourrage en raison de sa résistance et de sa durabilité. Étant donné qu'elle est fabriquée à partir de bouteilles en PET recyclées et qu'elle peut être recyclée une fois sa durée de vie utile terminée, la mousse PET est considérée comme un matériau respectueux de l'environnement. Elle est également non toxique et ne contient aucune substance nocive pour l'ozone, ce qui en fait un choix sain et respectueux de l'environnement.
| ATTRIBUT | DÉTAILS |
| Période d'étude | 2020-2029 |
| Année de base | 2021 |
| Année estimée | 2022 |
| Année prévue | 2022-2029 |
| Période historique | 2018-2020 |
| Unité | Valeur (en millions USD), valeur (en tonnes) |
| Segmentation | Par matière première, par catégorie, par application, par région |
| Par matière première |
|
| Par niveau |
|
| Par application |
|
| Par région |
|
La mousse PET est un matériau flexible qui peut être utilisé de diverses manières. L'une de ses applications les plus populaires est dans le secteur de la construction, où elle est utilisée comme matériau de base dans les panneaux sandwich et pour l'isolation. En outre, elle est utilisée dans le secteur des transports à des fins d'allègement dans la création d'intérieurs automobiles, de composants aérospatiaux et d'applications marines. Afin de protéger les articles fragiles pendant le transport, la mousse PET est également utilisée dans les matériaux d'emballage et de rembourrage. En outre, elle est utilisée dans l'énergie éolienne, les équipements sportifs et les dispositifs médicaux. C'est une option appréciée dans toutes les industries en raison de ses excellentes qualités d'isolation, de sa robustesse et de sa durabilité.
Parmi les principaux facteurs susceptibles d'influencer de manière significative la demande de mousses PET de l'industrie automobile au cours de la période de prévision figurent la demande croissante de véhicules légers et l'amélioration du rendement énergétique. Pour réduire le poids total du véhicule, des matériaux avancés et des thermoplastiques remplacent les métaux actuellement utilisés dans ces véhicules. En raison de leur facilité de production et de moulage en série, les mousses PET sont utilisées comme une solution idéale pour réduire le poids des véhicules et remplacer les pièces métalliques dans l'industrie automobile.
Malgré ses nombreux avantages, le marché de la mousse PET est confronté à certains défis, notamment son coût relativement élevé par rapport aux autres matériaux en mousse. De plus, la fabrication de mousse PET nécessite des équipements spécialisés, ce qui peut augmenter le coût de production. De plus, la matière première principale de la mousse PET, les bouteilles en PET recyclées, n'est pas toujours facilement disponible. D'autres produits en mousse aux propriétés comparables constituent également une menace pour le marché, notamment la mousse de polyuréthane (PU) et la mousse de polystyrène expansé (EPS).
[caption id="attachment_23806" align="aligncenter" width="1920"]
L’industrie des mousses grand public continue d’adopter des pratiques commerciales durables en raison des préoccupations croissantes concernant l’utilisation des combustibles fossiles et les effets des plastiques sur l’environnement. En termes de durabilité, les matériaux bio-dérivés, tels que les polyols à base de soja, offrent des avantages considérables par rapport aux polyols traditionnels. Ils dépendent également moins de matières premières à base de pétrole. Ces éléments offrent aux producteurs de polyuréthane une opportunité de réduire leur dépendance aux matières premières à base de pétrole pour la création de mousses grand public et de réduire le prix de production de ces mousses.
La majorité des industries dans lesquelles la mousse PET est utilisée comme composant dans la fabrication ont été pratiquement paralysées en raison de l'épidémie mondiale de COVID-19. L'expansion du marché des formes PET a été impactée. Plusieurs usines de fabrication de formes PET ont dû fermer en raison de la situation de confinement, ce qui a eu un impact négatif sur les ventes et la chaîne d'approvisionnement. La pandémie a eu un impact négatif sur les industries de l'énergie éolienne et de la marine, ce qui a entraîné une baisse de la consommation de mousse PET dans ces secteurs. Cela a eu à son tour un impact négatif sur le marché des formes PET.
Frequently Asked Questions
• What is the projected market size & growth rate of the PET foam market?
PET foam market was valued at USD 387.4 million in 2022 and is projected to reach USD 646.8 million by 2029, growing at a CAGR of 7.6% from 2022 to 2029.
• What are the key drivers of the PET foam market?
Rise in demand for PET foam in building & construction industry and growth in wind energy market are the key drivers for PET foam market.
• What are the top players operating in the PET foam market?
The major players are Armacell International S.A., 3A Composites, Gurit Holding AG, DIAB Group, BASF SE, Sekisui Plastics Co. Ltd., Huntsman International LLC, CoreLite Inc., Changzhou Tiansheng New Materials Co. Ltd., Carbon-Core Corporation.
• What segments are covered in the PET foam market report?
The global PET foam market is segmented on the basis of raw material, grade, application, and geography.
• Which region held the largest share of PET foam market in 2021?
Asia-Pacific held the largest share of PET foam market in 2021.
PET Foam Market Segment Analysis
The pet foam market is segmented based on raw material, source, application and region. by raw material market is segmented into virgin PET and recycled PET; by grade market is segmented into low-density and high-density; by application market is segmented into wind energy, transportation, marine, building & construction, packaging, and others; and region.
The term "Virgin PET" refers to PET foam made from raw materials rather than recycled ones. PET that has been recycled comes from recycled materials. The market for recycled PET foam is the one that is expanding the quickest. Governments have passed laws and regulations to encourage recycling in response to growing public demand for recycling and waste reduction. The market's demand for recycled PET foam is anticipated to rise as a result of PET's recyclable nature. Vendors of PET foam are also making significant investments in developing recyclable PET foams and waste-minimizing manufacturing techniques.
[caption id="attachment_23812" align="aligncenter" width="1920"]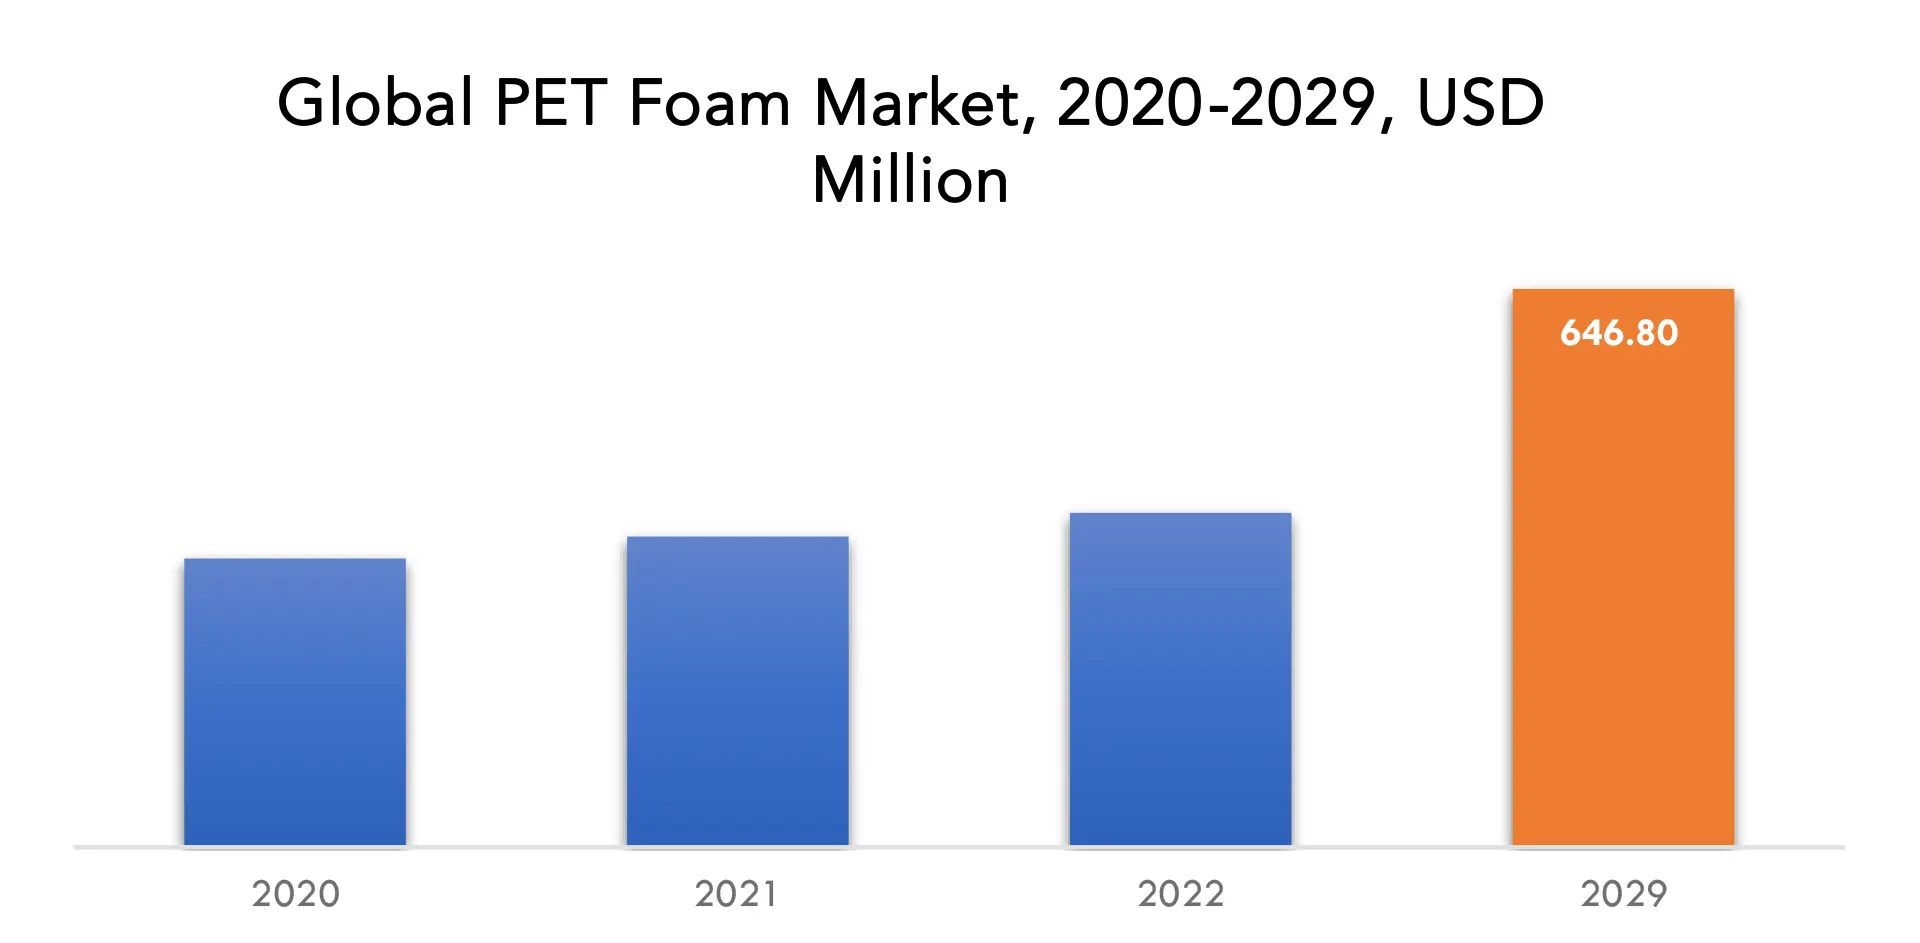
The segment with the largest market share is low-density PET foam, which is projected to expand at a CAGR of 7.8% during the forecast period. Low-density PET foam is preferred, particularly for commercial container applications due to it performs better at low temperatures and has the necessary stiffness for deeply formed containers. Low-density PET foams are being driven by the rapid expansion of the construction, building, and packaging industries, as well as the widespread use of this material in these sectors and its distinct advantages over other primary materials.
During the forecast period, the market for wind energy is anticipated to grow at a faster rate than any other. A rise in the demand for wind energy has contributed to the rising demand for clean fuels. The blades of the turbines that transform wind energy into electrical energy are made largely of PET foam in the wind energy sector. PET foam is used in the wind energy sector to create spinners, nacelles, casings, and rotor blades in addition to turbine blades. PET foam is used due to it has a high strength to weight ratio, is lightweight, compressive, and shear-resistant.
Competitive Landscape
The competitive landscape of the PET Foam market was dynamic, with several prominent companies competing to provide innovative and advanced PET Foam solutions.
- Armacell international s.a.
- 3a composites
- Gurit holding ag
- Diab group
- Basf se
- Sekisui plastics co. Ltd.
- Huntsman international llc
- Corelite inc.
- Changzhou tiansheng new materials co. Ltd.
- Carbon-core corporation
April 17, 2024 - Automotive experts from Huntsman have added a series of new lightweight, durable polyurethane foam technologies to the company’s battery solutions portfolio that have been developed for the potting and fixation of cells mounted in electric vehicle (EV) batteries. The new range also includes products that can be used as a moldable encapsulant in battery modules or packs.
April 24, 2024 – BASF has signed a Letter of Intent (LoI) with Youyi Group (Youyi) on April 22, 2024. This agreement marks a significant step to further strengthen the strategic partnership between the two companies, focusing on the supply of butyl acrylate (BA) and 2-ethylhexyl acrylate (2-EHA) from BASF’s Zhanjiang Verbund site to meet the growing demand in China’s adhesive materials industry.
Who Should Buy? Or Key stakeholders
- Manufacturers
- Traders and distributors
- Government organizations
- Research organizations
- Investment research firms
- Others
PET Foam Market Regional Analysis
The PET foam market by region includes North America, Asia-Pacific (APAC), Europe, South America, and Middle East & Africa (MEA).
- North America: includes the US, Canada, Mexico, Rest of North America
- Asia Pacific: includes China, Japan, South Korea, India, Australia, and Rest of APAC
- Europe: includes UK, Germany, France, Italy, Russia, Spain, and Rest of Europe
- South America: includes Brazil, Argentina, Colombia and Rest of South America
- Middle East & Africa: includes UAE, Saudi Arabia, South Africa, and Rest of MEA
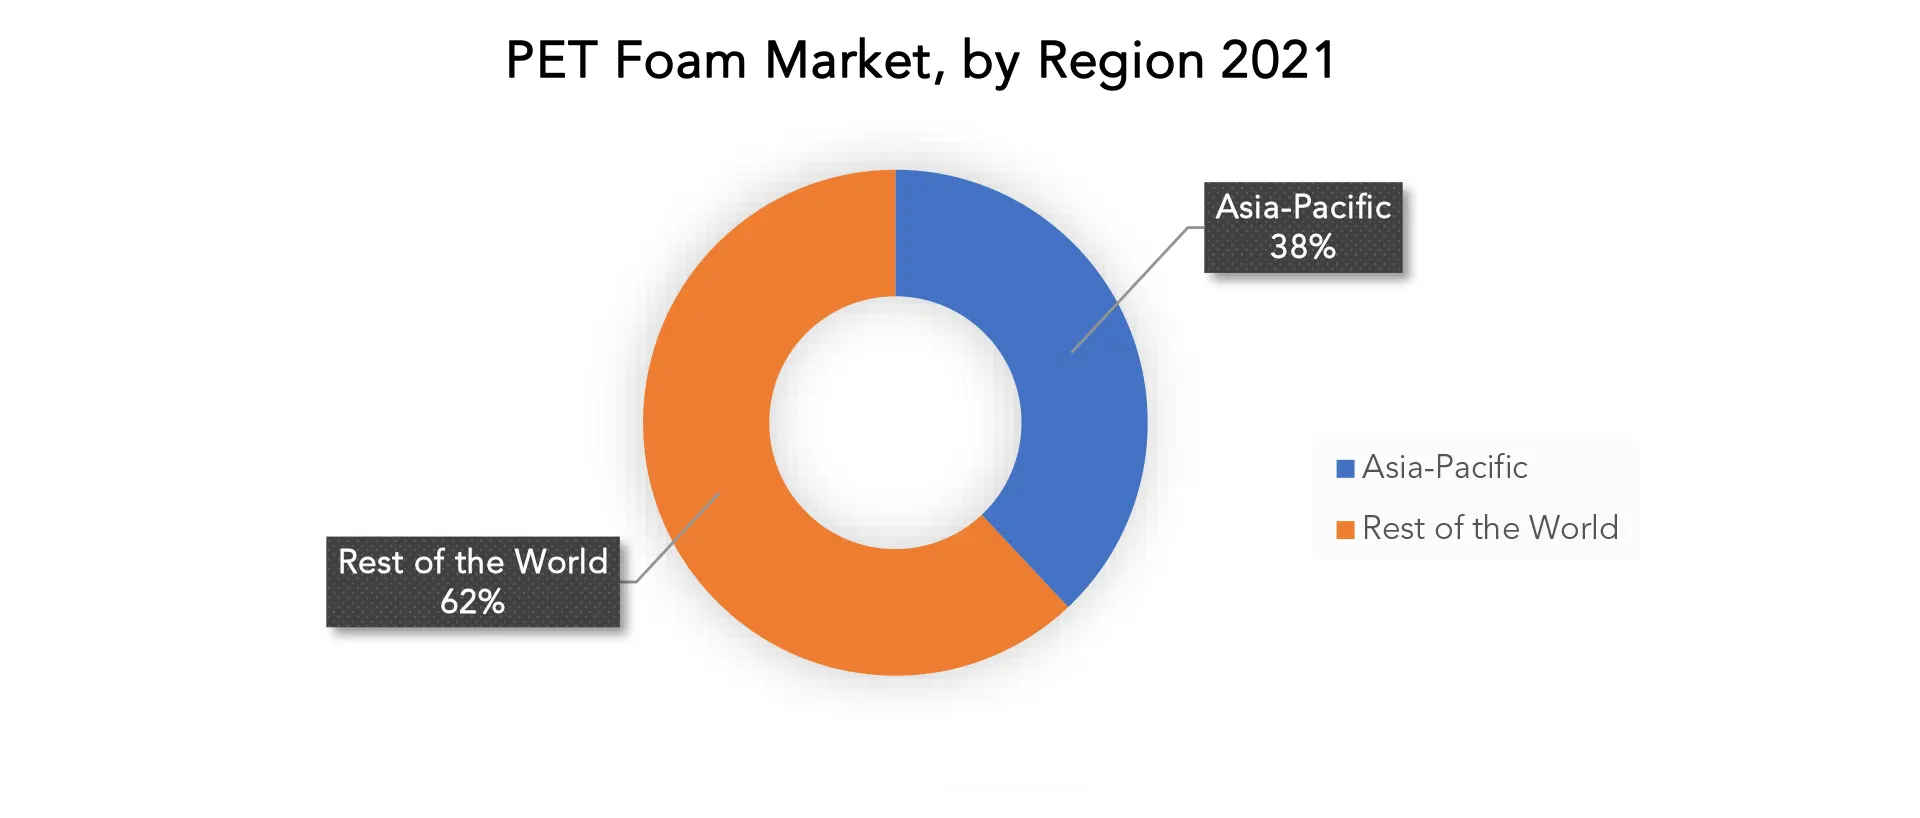
The largest market share belongs to Asia Pacific. Some factors contributing to this region's growth include rising urbanization, a booming automotive industry, technological advancements, and the expansion of foreign players in this region. The market for PET foam is expanding as a result of rising energy conservation awareness in the construction industry and initiatives to encourage the use of electric vehicles in developing nations. PET foam is in higher demand as a result of expanding economies in places like China, India, and Japan, as well as the established electronics sector. During the forecast period, expanding applications in wind energy and packaging are anticipated to present growth opportunities.
Key Market Segments: Pet Foam Market
Pet Foam Market By Raw Material, 2020-2029, (USD Million, Tons)- Virgin Pet
- Recycled Pet
- Low-Density
- High-Density
- Wind Energy
- Transportation
- Marine
- Building & Construction
- Packaging
- Others
- North America
- Asia Pacific
- Europe
- South America
- Middle East And Africa
Exactitude Consultancy Services Key Objectives:
- Increasing sales and market share
- Developing new technology
- Improving profitability
- Entering new markets
- Enhancing brand reputation
Key Question Answered
- What is the expected growth rate of the PET foam market over the next 7 years?
- What are the end-user industries driving demand for market and what is their outlook?
- What are the opportunities for growth in emerging markets such as Asia-pacific, Middle East, and Africa?
- How is the economic environment affecting the PET foam market, including factors such as interest rates, inflation, and exchange rates?
- What is the expected impact of government policies and regulations on the PET foam market?
- What is the current and forecasted size and growth rate of the global PET foam market?
- What are the key drivers of growth in the PET foam market?
- Who are the major players in the market and what is their market share?
- What are the distribution channels and supply chain dynamics in the PET foam market?
- What are the technological advancements and innovations in the PET foam market and their impact on product development and growth?
- What are the regulatory considerations and their impact on the market?
- What are the challenges faced by players in the PET foam market and how are they addressing these challenges?
- What are the opportunities for growth and expansion in the PET foam market?
- What are the service offerings and specifications of leading players in the market?
- What is the pricing trend of PET foam in the market and what is the impact of raw material prices on the price trend?
TABLE DES MATIÈRES
COMPANY PROFILES* (BUSINESS OVERVIEW, COMPANY SNAPSHOT, PRODUCTS OFFERED, RECENT DEVELOPMENTS)
*THE COMPANY LIST IS INDICATIVE
TABLE 1 GLOBAL PET FOAM MARKET BY RAW MATERIAL (USD MILLION), 2020-2029
TABLE 2 GLOBAL PET FOAM MARKET BY RAW MATERIAL (TONS), 2020-2029
TABLE 3 GLOBAL PET FOAM MARKET BY GRADE (USD MILLION), 2020-2029
TABLE 4 GLOBAL PET FOAM MARKET BY GRADE (TONS), 2020-2029
TABLE 5 GLOBAL PET FOAM MARKET BY APPLICATION (USD MILLION), 2020-2029
TABLE 6 GLOBAL PET FOAM MARKET BY APPLICATION (TONS), 2020-2029
TABLE 7 GLOBAL PET FOAM MARKET BY REGION (USD MILLION), 2020-2029
TABLE 8 GLOBAL PET FOAM MARKET BY REGION (TONS), 2020-2029
TABLE 9 NORTH AMERICA PET FOAM MARKET BY RAW MATERIAL (USD MILLION), 2020-2029
TABLE 10 NORTH AMERICA PET FOAM MARKET BY RAW MATERIAL (TONS), 2020-2029
TABLE 11 NORTH AMERICA PET FOAM MARKET BY GRADE (USD MILLION), 2020-2029
TABLE 12 NORTH AMERICA PET FOAM MARKET BY GRADE (TONS), 2020-2029
TABLE 13 NORTH AMERICA PET FOAM MARKET BY APPLICATION (USD MILLION), 2020-2029
TABLE 14 NORTH AMERICA PET FOAM MARKET BY APPLICATION (TONS), 2020-2029
TABLE 15 NORTH AMERICA PET FOAM MARKET BY COUNTRY (USD MILLION), 2020-2029
TABLE 16 NORTH AMERICA PET FOAM MARKET BY COUNTRY (USD MILLION), 2020-2029
TABLE 17 US PET FOAM MARKET BY RAW MATERIAL (USD MILLION), 2020-2029
TABLE 18 US PET FOAM MARKET BY RAW MATERIAL (TONS), 2020-2029
TABLE 19 US PET FOAM MARKET BY GRADE (USD MILLION), 2020-2029
TABLE 20 US PET FOAM MARKET BY GRADE (TONS), 2020-2029
TABLE 21 US PET FOAM MARKET BY APPLICATION (USD MILLION), 2020-2029
TABLE 22 US PET FOAM MARKET BY APPLICATION (TONS), 2020-2029
TABLE 23 CANADA PET FOAM MARKET BY RAW MATERIAL (MILLION), 2020-2029
TABLE 24 CANADA PET FOAM MARKET BY RAW MATERIAL (TONS), 2020-2029
TABLE 25 CANADA PET FOAM MARKET BY GRADE (USD MILLION), 2020-2029
TABLE 26 CANADA PET FOAM MARKET BY GRADE (TONS), 2020-2029
TABLE 27 CANADA PET FOAM MARKET BY APPLICATION (USD MILLION), 2020-2029
TABLE 28 CANADA PET FOAM MARKET BY APPLICATION (TONS), 2020-2029
TABLE 29 MEXICO PET FOAM MARKET BY RAW MATERIAL (USD MILLION), 2020-2029
TABLE 30 MEXICO PET FOAM MARKET BY RAW MATERIAL (TONS), 2020-2029
TABLE 31 MEXICO PET FOAM MARKET BY GRADE (USD MILLION), 2020-2029
TABLE 32 MEXICO PET FOAM MARKET BY GRADE (TONS), 2020-2029
TABLE 33 MEXICO PET FOAM MARKET BY APPLICATION (USD MILLION), 2020-2029
TABLE 34 MEXICO PET FOAM MARKET BY APPLICATION (TONS), 2020-2029
TABLE 35 REST OF NORTH AMERICA PET FOAM MARKET BY RAW MATERIAL (USD MILLION), 2020-2029
TABLE 36 REST OF NORTH AMERICA PET FOAM MARKET BY RAW MATERIAL (TONS), 2020-2029
TABLE 37 REST OF NORTH AMERICA PET FOAM MARKET BY GRADE (USD MILLION), 2020-2029
TABLE 38 REST OF NORTH AMERICA PET FOAM MARKET BY GRADE (TONS), 2020-2029
TABLE 39 REST OF NORTH AMERICA PET FOAM MARKET BY APPLICATIONN (USD MILLION), 2020-2029
TABLE 40 REST OF NORTH AMERICA PET FOAM MARKET BY APPLICATIONN (TONS), 2020-2029
TABLE 41 SOUTH AMERICA PET FOAM MARKET BY RAW MATERIAL (USD MILLION), 2020-2029
TABLE 42 SOUTH AMERICA PET FOAM MARKET BY RAW MATERIAL (TONS), 2020-2029
TABLE 43 SOUTH AMERICA PET FOAM MARKET BY GRADE (USD MILLION), 2020-2029
TABLE 44 SOUTH AMERICA PET FOAM MARKET BY GRADE (TONS), 2020-2029
TABLE 45 SOUTH AMERICA PET FOAM MARKET BY APPLICATION (USD MILLION), 2020-2029
TABLE 46 SOUTH AMERICA PET FOAM MARKET BY APPLICATION (TONS), 2020-2029
TABLE 47 SOUTH AMERICA PET FOAM MARKET BY COUNTRY (USD MILLION), 2020-2029
TABLE 48 SOUTH AMERICA PET FOAM MARKET BY COUNTRY (USD MILLION), 2020-2029
TABLE 49 BRAZIL PET FOAM MARKET BY RAW MATERIAL (USD MILLION), 2020-2029
TABLE 50 BRAZIL PET FOAM MARKET BY RAW MATERIAL (TONS), 2020-2029
TABLE 51 BRAZIL PET FOAM MARKET BY GRADE (USD MILLION), 2020-2029
TABLE 52 BRAZIL PET FOAM MARKET BY GRADE (TONS), 2020-2029
TABLE 53 BRAZIL PET FOAM MARKET BY APPLICATION (USD MILLION), 2020-2029
TABLE 54 BRAZIL PET FOAM MARKET BY APPLICATION (TONS), 2020-2029
TABLE 55 ARGENTINA PET FOAM MARKET BY RAW MATERIAL (USD MILLION), 2020-2029
TABLE 56 ARGENTINA PET FOAM MARKET BY RAW MATERIAL (TONS), 2020-2029
TABLE 57 ARGENTINA PET FOAM MARKET BY GRADE (USD MILLION), 2020-2029
TABLE 58 ARGENTINA PET FOAM MARKET BY GRADE (TONS), 2020-2029
TABLE 59 ARGENTINA PET FOAM MARKET BY APPLICATION (USD MILLION), 2020-2029
TABLE 60 ARGENTINA PET FOAM MARKET BY APPLICATION (TONS), 2020-2029
TABLE 61 COLOMBIA PET FOAM MARKET BY RAW MATERIAL (USD MILLION), 2020-2029
TABLE 62 COLOMBIA PET FOAM MARKET BY RAW MATERIAL (TONS), 2020-2029
TABLE 63 COLOMBIA PET FOAM MARKET BY GRADE (USD MILLION), 2020-2029
TABLE 64 COLOMBIA PET FOAM MARKET BY GRADE (TONS), 2020-2029
TABLE 65 COLOMBIA PET FOAM MARKET BY APPLICATION (USD MILLION), 2020-2029
TABLE 66 COLOMBIA PET FOAM MARKET BY APPLICATION (TONS), 2020-2029
TABLE 67 REST OF SOUTH AMERICA PET FOAM MARKET BY RAW MATERIAL (USD MILLION), 2020-2029
TABLE 68 REST OF SOUTH AMERICA PET FOAM MARKET BY RAW MATERIAL (TONS), 2020-2029
TABLE 69 REST OF SOUTH AMERICA PET FOAM MARKET BY GRADE (USD MILLION), 2020-2029
TABLE 70 REST OF SOUTH AMERICA PET FOAM MARKET BY GRADE (TONS), 2020-2029
TABLE 71 REST OF SOUTH AMERICA PET FOAM MARKET BY APPLICATIONN (USD MILLION), 2020-2029
TABLE 72 REST OF SOUTH AMERICA PET FOAM MARKET BY APPLICATIONN (TONS), 2020-2029
TABLE 73 ASIA -PACIFIC PET FOAM MARKET BY RAW MATERIAL (USD MILLION), 2020-2029
TABLE 74 ASIA -PACIFIC PET FOAM MARKET BY RAW MATERIAL (TONS), 2020-2029
TABLE 75 ASIA -PACIFIC PET FOAM MARKET BY GRADE (USD MILLION), 2020-2029
TABLE 76 ASIA -PACIFIC PET FOAM MARKET BY GRADE (TONS), 2020-2029
TABLE 77 ASIA -PACIFIC PET FOAM MARKET BY APPLICATION (USD MILLION), 2020-2029
TABLE 78 ASIA -PACIFIC PET FOAM MARKET BY APPLICATION (TONS), 2020-2029
TABLE 79 ASIA -PACIFIC PET FOAM MARKET BY COUNTRY (USD MILLION), 2020-2029
TABLE 80 ASIA -PACIFIC PET FOAM MARKET BY COUNTRY (TONS), 2020-2029
TABLE 81 INDIA PET FOAM MARKET BY RAW MATERIAL (USD MILLION), 2020-2029
TABLE 82 INDIA PET FOAM MARKET BY RAW MATERIAL (TONS), 2020-2029
TABLE 83 INDIA PET FOAM MARKET BY GRADE (USD MILLION), 2020-2029
TABLE 84 INDIA PET FOAM MARKET BY GRADE (TONS), 2020-2029
TABLE 85 INDIA PET FOAM MARKET BY APPLICATION (USD MILLION), 2020-2029
TABLE 86 INDIA PET FOAM MARKET BY APPLICATION (TONS), 2020-2029
TABLE 87 CHINA PET FOAM MARKET BY RAW MATERIAL (USD MILLION), 2020-2029
TABLE 88 CHINA PET FOAM MARKET BY RAW MATERIAL (TONS), 2020-2029
TABLE 89 CHINA PET FOAM MARKET BY GRADE (USD MILLION), 2020-2029
TABLE 90 CHINA PET FOAM MARKET BY GRADE (TONS), 2020-2029
TABLE 91 CHINA PET FOAM MARKET BY APPLICATION (USD MILLION), 2020-2029
TABLE 92 CHINA PET FOAM MARKET BY APPLICATION (TONS), 2020-2029
TABLE 93 JAPAN PET FOAM MARKET BY RAW MATERIAL (USD MILLION), 2020-2029
TABLE 94 JAPAN PET FOAM MARKET BY RAW MATERIAL (TONS), 2020-2029
TABLE 95 JAPAN PET FOAM MARKET BY GRADE (USD MILLION), 2020-2029
TABLE 96 JAPAN PET FOAM MARKET BY GRADE (TONS), 2020-2029
TABLE 97 JAPAN PET FOAM MARKET BY APPLICATION (USD MILLION), 2020-2029
TABLE 98 JAPAN PET FOAM MARKET BY APPLICATION (TONS), 2020-2029
TABLE 99 SOUTH KOREA PET FOAM MARKET BY RAW MATERIAL (USD MILLION), 2020-2029
TABLE 100 SOUTH KOREA PET FOAM MARKET BY RAW MATERIAL (TONS), 2020-2029
TABLE 101 SOUTH KOREA PET FOAM MARKET BY GRADE (USD MILLION), 2020-2029
TABLE 102 SOUTH KOREA PET FOAM MARKET BY GRADE (TONS), 2020-2029
TABLE 103 SOUTH KOREA PET FOAM MARKET BY APPLICATION (USD MILLION), 2020-2029
TABLE 104 SOUTH KOREA PET FOAM MARKET BY APPLICATION (TONS), 2020-2029
TABLE 105 AUSTRALIA PET FOAM MARKET BY RAW MATERIAL (USD MILLION), 2020-2029
TABLE 106 AUSTRALIA PET FOAM MARKET BY GRADEBY RAW MATERIAL (TONS), 2020-2029
TABLE 107 AUSTRALIA PET FOAM MARKET BY GRADE (USD MILLION), 2020-2029
TABLE 108 AUSTRALIA PET FOAM MARKET BY GRADE (TONS), 2020-2029
TABLE 109 AUSTRALIA PET FOAM MARKET BY APPLICATION (USD MILLION), 2020-2029
TABLE 110 AUSTRALIA PET FOAM MARKET BY APPLICATION (TONS), 2020-2029
TABLE 111 REST OF ASIA PACIFIC PET FOAM MARKET BY RAW MATERIAL (USD MILLION), 2020-2029
TABLE 112 REST OF ASIA PACIFIC PET FOAM MARKET BY GRADEBY RAW MATERIAL (TONS), 2020-2029
TABLE 113 REST OF ASIA PACIFIC PET FOAM MARKET BY GRADE (USD MILLION), 2020-2029
TABLE 114 REST OF ASIA PACIFIC PET FOAM MARKET BY GRADE (TONS), 2020-2029
TABLE 115 REST OF ASIA PACIFIC PET FOAM MARKET BY APPLICATION (USD MILLION), 2020-2029
TABLE 116 REST OF ASIA PACIFIC PET FOAM MARKET BY APPLICATION (TONS), 2020-2029
TABLE 117 EUROPE PET FOAM MARKET BY RAW MATERIAL (USD MILLION), 2020-2029
TABLE 118 EUROPE PET FOAM MARKET BY RAW MATERIAL (TONS), 2020-2029
TABLE 119 EUROPE PET FOAM MARKET BY GRADE (USD MILLION), 2020-2029
TABLE 120 EUROPE PET FOAM MARKET BY GRADE (TONS), 2020-2029
TABLE 121 EUROPE PET FOAM MARKET BY APPLICATION (USD MILLION), 2020-2029
TABLE 122 EUROPE PET FOAM MARKET BY APPLICATION (TONS), 2020-2029
TABLE 123 EUROPE PET FOAM MARKET BY COUNTRY (USD MILLION), 2020-2029
TABLE 124 EUROPE PET FOAM MARKET BY COUNTRY (TONS), 2020-2029
TABLE 125 GERMANY PET FOAM MARKET BY RAW MATERIAL (USD MILLION), 2020-2029
TABLE 126 GERMANY PET FOAM MARKET BY RAW MATERIAL (TONS), 2020-2029
TABLE 127 GERMANY PET FOAM MARKET BY GRADE (USD MILLION), 2020-2029
TABLE 128 GERMANY PET FOAM MARKET BY GRADE (TONS), 2020-2029
TABLE 129 GERMANY PET FOAM MARKET BY APPLICATION (USD MILLION), 2020-2029
TABLE 130 GERMANY PET FOAM MARKET BY APPLICATION (TONS), 2020-2029
TABLE 131 UK PET FOAM MARKET BY RAW MATERIAL (USD MILLION), 2020-2029
TABLE 132 UK PET FOAM MARKET BY RAW MATERIAL (TONS), 2020-2029
TABLE 133 UK PET FOAM MARKET BY GRADE (USD MILLION), 2020-2029
TABLE 134 UK PET FOAM MARKET BY GRADE (TONS), 2020-2029
TABLE 135 UK PET FOAM MARKET BY APPLICATION (USD MILLION), 2020-2029
TABLE 136 UK PET FOAM MARKET BY APPLICATION (USD MILLION), 2020-2029
TABLE 137 FRANCE PET FOAM MARKET BY RAW MATERIAL (USD MILLION), 2020-2029
TABLE 138 FRANCE PET FOAM MARKET BY RAW MATERIAL (TONS), 2020-2029
TABLE 139 FRANCE PET FOAM MARKET BY GRADE (USD MILLION), 2020-2029
TABLE 140 FRANCE PET FOAM MARKET BY GRADE (TONS), 2020-2029
TABLE 141 FRANCE PET FOAM MARKET BY APPLICATION (USD MILLION), 2020-2029
TABLE 142 FRANCE PET FOAM MARKET BY APPLICATION (TONS), 2020-2029
TABLE 143 ITALY PET FOAM MARKET BY RAW MATERIAL (USD MILLION), 2020-2029
TABLE 144 ITALY PET FOAM MARKET BY RAW MATERIAL (TONS), 2020-2029
TABLE 145 ITALY PET FOAM MARKET BY GRADE (USD MILLION), 2020-2029
TABLE 146 ITALY PET FOAM MARKET BY GRADE (TONS), 2020-2029
TABLE 147 ITALY PET FOAM MARKET BY APPLICATION (USD MILLION), 2020-2029
TABLE 148 ITALY PET FOAM MARKET BY APPLICATION (TONS), 2020-2029
TABLE 149 SPAIN PET FOAM MARKET BY RAW MATERIAL (USD MILLION), 2020-2029
TABLE 150 SPAIN PET FOAM MARKET BY RAW MATERIAL (TONS), 2020-2029
TABLE 151 SPAIN PET FOAM MARKET BY GRADE (USD MILLION), 2020-2029
TABLE 152 SPAIN PET FOAM MARKET BY GRADE (TONS), 2020-2029
TABLE 153 SPAIN PET FOAM MARKET BY APPLICATION (USD MILLION), 2020-2029
TABLE 154 SPAIN PET FOAM MARKET BY APPLICATION (TONS), 2020-2029
TABLE 155 RUSSIA PET FOAM MARKET BY RAW MATERIAL (USD MILLION), 2020-2029
TABLE 156 RUSSIA PET FOAM MARKET BY RAW MATERIAL (TONS), 2020-2029
TABLE 157 RUSSIA PET FOAM MARKET BY GRADE (USD MILLION), 2020-2029
TABLE 158 RUSSIA PET FOAM MARKET BY GRADE (TONS), 2020-2029
TABLE 159 RUSSIA PET FOAM MARKET BY APPLICATION (USD MILLION), 2020-2029
TABLE 160 RUSSIA PET FOAM MARKET BY APPLICATION (TONS), 2020-2029
TABLE 161 REST OF EUROPE PET FOAM MARKET BY RAW MATERIAL (USD MILLION), 2020-2029
TABLE 162 REST OF EUROPE PET FOAM MARKET BY RAW MATERIAL (TONS), 2020-2029
TABLE 163 REST OF EUROPE PET FOAM MARKET BY GRADE (USD MILLION), 2020-2029
TABLE 164 REST OF EUROPE PET FOAM MARKET BY GRADE (TONS), 2020-2029
TABLE 165 REST OF EUROPE PET FOAM MARKET BY APPLICATIONN (USD MILLION), 2020-2029
TABLE 166 REST OF EUROPE PET FOAM MARKET BY APPLICATIONN (TONS), 2020-2029
TABLE 167 MIDDLE EAST AND AFRICA PET FOAM MARKET BY RAW MATERIAL (USD MILLION), 2020-2029
TABLE 168 MIDDLE EAST AND AFRICA PET FOAM MARKET BY RAW MATERIAL (TONS), 2020-2029
TABLE 169 MIDDLE EAST AND AFRICA PET FOAM MARKET BY GRADE (USD MILLION), 2020-2029
TABLE 170 MIDDLE EAST AND AFRICA PET FOAM MARKET BY GRADE (TONS), 2020-2029
TABLE 171 MIDDLE EAST AND AFRICA PET FOAM MARKET BY APPLICATION (USD MILLION), 2020-2029
TABLE 172 MIDDLE EAST AND AFRICA PET FOAM MARKET BY APPLICATION (TONS), 2020-2029
TABLE 173 MIDDLE EAST AND AFRICA PET FOAM MARKET BY COUNTRY (USD MILLION), 2020-2029
TABLE 174 MIDDLE EAST AND AFRICA PET FOAM MARKET BY COUNTRY (TONS), 2020-2029
TABLE 175 UAE PET FOAM MARKET BY RAW MATERIAL (USD MILLION), 2020-2029
TABLE 176 UAE PET FOAM MARKET BY RAW MATERIAL (TONS), 2020-2029
TABLE 177 UAE PET FOAM MARKET BY GRADE (USD MILLION), 2020-2029
TABLE 178 UAE PET FOAM MARKET BY GRADE (TONS), 2020-2029
TABLE 179 UAE PET FOAM MARKET BY APPLICATION (USD MILLION), 2020-2029
TABLE 180 UAE PET FOAM MARKET BY APPLICATION (TONS), 2020-2029
TABLE 181 SAUDI ARABIA PET FOAM MARKET BY RAW MATERIAL (USD MILLION), 2020-2029
TABLE 182 SAUDI ARABIA PET FOAM MARKET BY RAW MATERIAL (TONS), 2020-2029
TABLE 183 SAUDI ARABIA PET FOAM MARKET BY GRADE (USD MILLION), 2020-2029
TABLE 184 SAUDI ARABIA PET FOAM MARKET BY GRADE (TONS), 2020-2029
TABLE 185 SAUDI ARABIA PET FOAM MARKET BY APPLICATION (USD MILLION), 2020-2029
TABLE 186 SAUDI ARABIA PET FOAM MARKET BY APPLICATION (TONS), 2020-2029
TABLE 187 SOUTH AFRICA PET FOAM MARKET BY RAW MATERIAL (USD MILLION), 2020-2029
TABLE 188 SOUTH AFRICA PET FOAM MARKET BY RAW MATERIAL (TONS), 2020-2029
TABLE 189 SOUTH AFRICA PET FOAM MARKET BY GRADE (USD MILLION), 2020-2029
TABLE 190 SOUTH AFRICA PET FOAM MARKET BY GRADE (TONS), 2020-2029
TABLE 191 SOUTH AFRICA PET FOAM MARKET BY APPLICATION (USD MILLION), 2020-2029
TABLE 192 SOUTH AFRICA PET FOAM MARKET BY APPLICATION (TONS), 2020-2029
TABLE 193 REST OF MIDDLE EAST AND AFRICA PET FOAM MARKET BY RAW MATERIAL (USD MILLION), 2020-2029
TABLE 194 REST OF MIDDLE EAST AND AFRICA PET FOAM MARKET BY RAW MATERIAL (TONS), 2020-2029
TABLE 195 REST OF MIDDLE EAST AND AFRICA PET FOAM MARKET BY GRADE (USD MILLION), 2020-2029
TABLE 196 REST OF MIDDLE EAST AND AFRICA PET FOAM MARKET BY GRADE (TONS), 2020-2029
TABLE 197 REST OF MIDDLE EAST AND AFRICA PET FOAM MARKET BY APPLICATION (USD MILLION), 2020-2029
TABLE 198 REST OF MIDDLE EAST AND AFRICA PET FOAM MARKET BY APPLICATION (TONS), 2020-2029
LIST OF FIGURES
FIGURE 1 MARKET DYNAMICS
FIGURE 2 MARKET SEGMENTATION
FIGURE 3 REPORT TIMELINES: YEARS CONSIDERED
FIGURE 4 DATA TRIANGULATION
FIGURE 5 BOTTOM-UP APPROACH
FIGURE 6 TOP-DOWN APPROACH
FIGURE 7 RESEARCH FLOW
FIGURE 8 GLOBAL PET FOAM MARKET BY RAW MATERIAL, USD MILLION, 2020-2029
FIGURE 9 GLOBAL PET FOAM MARKET BY GRADE, USD MILLION, 2020-2029
FIGURE 10 GLOBAL PET FOAM MARKET BY APPLICATION, USD MILLION, 2021
FIGURE 11 GLOBAL PET FOAM MARKET BY REGION, USD MILLION, 2020-2029
FIGURE 12 PORTER’S FIVE FORCES MODEL
FIGURE 13 GLOBAL PET FOAM MARKET BY RAW MATERIAL, USD MILLION, 2021
FIGURE 14 GLOBAL PET FOAM MARKET BY GRADE, USD MILLION, 2021
FIGURE 15 GLOBAL PET FOAM MARKET BY APPLICATION, USD MILLION, 2021
FIGURE 16 GLOBAL PET FOAM MARKET BY REGION, USD MILLION, 2021
FIGURE 17 MARKET SHARE ANALYSIS
FIGURE 18 ARMACELL INTERNATIONAL S.A.: COMPANY SNAPSHOT
FIGURE 19 3A COMPOSITES: COMPANY SNAPSHOT
FIGURE 20 GURIT HOLDING AG: COMPANY SNAPSHOT
FIGURE 21 DIAB GROUP: COMPANY SNAPSHOT
FIGURE 22 BASF SE: COMPANY SNAPSHOT
FIGURE 23 SEKISUI PLASTICS CO. LTD.: COMPANY SNAPSHOT
FIGURE 24 HUNTSMAN INTERNATIONAL LLC: COMPANY SNAPSHOT
FIGURE 25 CORELITE INC.: COMPANY SNAPSHOT
FIGURE 26 CHANGZHOU TIANSHENG NEW MATERIALS CO. LTD.: COMPANY SNAPSHOT
FIGURE 27 CARBON-CORE CORPORATION: COMPANY SNAPSHOT
- INTRODUCTION
- DÉFINITION DU MARCHÉ
- SEGMENTATION DU MARCHÉ
- ÉCHÉANCES DE RECHERCHE
- Hypothèses et limites
- MÉTHODOLOGIE DE RECHERCHE
- EXPLORATION DE DONNÉES
- RECHERCHE SECONDAIRE
- RECHERCHE PRIMAIRE
- CONSEILS D'EXPERTS EN LA MATIÈRE
- CONTRÔLES DE QUALITÉ
- REVUE FINALE
- TRIANGULATION DES DONNÉES
- APPROCHE ASCENDANTE
- APPROCHE DESCENDANTE
- FLUX DE RECHERCHE
- SOURCES DE DONNÉES
- EXPLORATION DE DONNÉES
- RÉSUMÉ EXÉCUTIF
- APERÇU DU MARCHÉ
- PERSPECTIVES DU MARCHÉ MONDIAL DE LA MOUSSE PET
- MOTEURS DU MARCHÉ
- RESTRICTIONS DU MARCHÉ
- OPPORTUNITÉS DE MARCHÉ
- IMPACT DU COVID-19 SUR LE MARCHÉ DE LA MOUSSE PET
- MODÈLE DES CINQ FORCES DE PORTER
- MENACE DES NOUVEAUX ENTRANTS
- MENACE DES SUBSTITUTS
- POUVOIR DE NÉGOCIATION DES FOURNISSEURS
- POUVOIR DE NÉGOCIATION DES CLIENTS
- DEGREE OF COMPETITION
- INDUSTRY VALUE CHAIN ANALYSIS
- PERSPECTIVES DU MARCHÉ MONDIAL DE LA MOUSSE PET
- GLOBAL PET FOAM MARKET BY RAW MATERIAL (USD MILLION, TONS), 2020-2029
- VIRGIN PET
- RECYCLED PET
- GLOBAL PET FOAM MARKET BY GRADE (USD MILLION, TONS),2020-2029
- LOW-DENSITY
- HIGH-DENSITY
- GLOBAL PET FOAM MARKET BY APPLICATION(USD MILLION, TONS),2020-2029
- WIND ENERGY
- TRANSPORTATION
- MARINE
- BUILDING & CONSTRUCTION
- PACKAGING
- OTHERS
- GLOBAL PET FOAM MARKET BY REGION (USD MILLION, TONS),2020-2029
- NORTH AMERICA
- US
- CANADA
- MEXICO
- REST OF NORTH AMERICA
- SOUTH AMERICA
- BRAZIL
- ARGENTINA
- COLOMBIA
- REST OF SOUTH AMERICA
- EUROPE
- GERMANY
- UK
- FRANCE
- ITALY
- SPAIN
- RUSSIA
- REST OF EUROPE
- ASIA PACIFIC
- INDIA
- CHINA
- JAPAN
- SOUTH KOREA
- AUSTRALIA
- REST OF ASIA PACIFIC
- MIDDLE EAST AND AFRICA
- UAE
- SAUDI ARABIA
- SOUTH AFRICA
- REST OF MIDDLE EAST AND AFRICA
- NORTH AMERICA
COMPANY PROFILES* (BUSINESS OVERVIEW, COMPANY SNAPSHOT, PRODUCTS OFFERED, RECENT DEVELOPMENTS)
- ARMACELL INTERNATIONAL S.A.
- 3A COMPOSITES
- GURIT HOLDING AG
- DIAB GROUP
- BASF SE
- SEKISUI PLASTICS CO. LTD.
- HUNTSMAN INTERNATIONAL LLC
- CORELITE INC.
- CHANGZHOU TIANSHENG NEW MATERIALS CO. LTD.
- CARBON-CORE CORPORATION
*THE COMPANY LIST IS INDICATIVE
LIST OF TABLES
TABLE 1 GLOBAL PET FOAM MARKET BY RAW MATERIAL (USD MILLION), 2020-2029
TABLE 2 GLOBAL PET FOAM MARKET BY RAW MATERIAL (TONS), 2020-2029
TABLE 3 GLOBAL PET FOAM MARKET BY GRADE (USD MILLION), 2020-2029
TABLE 4 GLOBAL PET FOAM MARKET BY GRADE (TONS), 2020-2029
TABLE 5 GLOBAL PET FOAM MARKET BY APPLICATION (USD MILLION), 2020-2029
TABLE 6 GLOBAL PET FOAM MARKET BY APPLICATION (TONS), 2020-2029
TABLE 7 GLOBAL PET FOAM MARKET BY REGION (USD MILLION), 2020-2029
TABLE 8 GLOBAL PET FOAM MARKET BY REGION (TONS), 2020-2029
TABLE 9 NORTH AMERICA PET FOAM MARKET BY RAW MATERIAL (USD MILLION), 2020-2029
TABLE 10 NORTH AMERICA PET FOAM MARKET BY RAW MATERIAL (TONS), 2020-2029
TABLE 11 NORTH AMERICA PET FOAM MARKET BY GRADE (USD MILLION), 2020-2029
TABLE 12 NORTH AMERICA PET FOAM MARKET BY GRADE (TONS), 2020-2029
TABLE 13 NORTH AMERICA PET FOAM MARKET BY APPLICATION (USD MILLION), 2020-2029
TABLE 14 NORTH AMERICA PET FOAM MARKET BY APPLICATION (TONS), 2020-2029
TABLE 15 NORTH AMERICA PET FOAM MARKET BY COUNTRY (USD MILLION), 2020-2029
TABLE 16 NORTH AMERICA PET FOAM MARKET BY COUNTRY (USD MILLION), 2020-2029
TABLE 17 US PET FOAM MARKET BY RAW MATERIAL (USD MILLION), 2020-2029
TABLE 18 US PET FOAM MARKET BY RAW MATERIAL (TONS), 2020-2029
TABLE 19 US PET FOAM MARKET BY GRADE (USD MILLION), 2020-2029
TABLE 20 US PET FOAM MARKET BY GRADE (TONS), 2020-2029
TABLE 21 US PET FOAM MARKET BY APPLICATION (USD MILLION), 2020-2029
TABLE 22 US PET FOAM MARKET BY APPLICATION (TONS), 2020-2029
TABLE 23 CANADA PET FOAM MARKET BY RAW MATERIAL (MILLION), 2020-2029
TABLE 24 CANADA PET FOAM MARKET BY RAW MATERIAL (TONS), 2020-2029
TABLE 25 CANADA PET FOAM MARKET BY GRADE (USD MILLION), 2020-2029
TABLE 26 CANADA PET FOAM MARKET BY GRADE (TONS), 2020-2029
TABLE 27 CANADA PET FOAM MARKET BY APPLICATION (USD MILLION), 2020-2029
TABLE 28 CANADA PET FOAM MARKET BY APPLICATION (TONS), 2020-2029
TABLE 29 MEXICO PET FOAM MARKET BY RAW MATERIAL (USD MILLION), 2020-2029
TABLE 30 MEXICO PET FOAM MARKET BY RAW MATERIAL (TONS), 2020-2029
TABLE 31 MEXICO PET FOAM MARKET BY GRADE (USD MILLION), 2020-2029
TABLE 32 MEXICO PET FOAM MARKET BY GRADE (TONS), 2020-2029
TABLE 33 MEXICO PET FOAM MARKET BY APPLICATION (USD MILLION), 2020-2029
TABLE 34 MEXICO PET FOAM MARKET BY APPLICATION (TONS), 2020-2029
TABLE 35 REST OF NORTH AMERICA PET FOAM MARKET BY RAW MATERIAL (USD MILLION), 2020-2029
TABLE 36 REST OF NORTH AMERICA PET FOAM MARKET BY RAW MATERIAL (TONS), 2020-2029
TABLE 37 REST OF NORTH AMERICA PET FOAM MARKET BY GRADE (USD MILLION), 2020-2029
TABLE 38 REST OF NORTH AMERICA PET FOAM MARKET BY GRADE (TONS), 2020-2029
TABLE 39 REST OF NORTH AMERICA PET FOAM MARKET BY APPLICATIONN (USD MILLION), 2020-2029
TABLE 40 REST OF NORTH AMERICA PET FOAM MARKET BY APPLICATIONN (TONS), 2020-2029
TABLE 41 SOUTH AMERICA PET FOAM MARKET BY RAW MATERIAL (USD MILLION), 2020-2029
TABLE 42 SOUTH AMERICA PET FOAM MARKET BY RAW MATERIAL (TONS), 2020-2029
TABLE 43 SOUTH AMERICA PET FOAM MARKET BY GRADE (USD MILLION), 2020-2029
TABLE 44 SOUTH AMERICA PET FOAM MARKET BY GRADE (TONS), 2020-2029
TABLE 45 SOUTH AMERICA PET FOAM MARKET BY APPLICATION (USD MILLION), 2020-2029
TABLE 46 SOUTH AMERICA PET FOAM MARKET BY APPLICATION (TONS), 2020-2029
TABLE 47 SOUTH AMERICA PET FOAM MARKET BY COUNTRY (USD MILLION), 2020-2029
TABLE 48 SOUTH AMERICA PET FOAM MARKET BY COUNTRY (USD MILLION), 2020-2029
TABLE 49 BRAZIL PET FOAM MARKET BY RAW MATERIAL (USD MILLION), 2020-2029
TABLE 50 BRAZIL PET FOAM MARKET BY RAW MATERIAL (TONS), 2020-2029
TABLE 51 BRAZIL PET FOAM MARKET BY GRADE (USD MILLION), 2020-2029
TABLE 52 BRAZIL PET FOAM MARKET BY GRADE (TONS), 2020-2029
TABLE 53 BRAZIL PET FOAM MARKET BY APPLICATION (USD MILLION), 2020-2029
TABLE 54 BRAZIL PET FOAM MARKET BY APPLICATION (TONS), 2020-2029
TABLE 55 ARGENTINA PET FOAM MARKET BY RAW MATERIAL (USD MILLION), 2020-2029
TABLE 56 ARGENTINA PET FOAM MARKET BY RAW MATERIAL (TONS), 2020-2029
TABLE 57 ARGENTINA PET FOAM MARKET BY GRADE (USD MILLION), 2020-2029
TABLE 58 ARGENTINA PET FOAM MARKET BY GRADE (TONS), 2020-2029
TABLE 59 ARGENTINA PET FOAM MARKET BY APPLICATION (USD MILLION), 2020-2029
TABLE 60 ARGENTINA PET FOAM MARKET BY APPLICATION (TONS), 2020-2029
TABLE 61 COLOMBIA PET FOAM MARKET BY RAW MATERIAL (USD MILLION), 2020-2029
TABLE 62 COLOMBIA PET FOAM MARKET BY RAW MATERIAL (TONS), 2020-2029
TABLE 63 COLOMBIA PET FOAM MARKET BY GRADE (USD MILLION), 2020-2029
TABLE 64 COLOMBIA PET FOAM MARKET BY GRADE (TONS), 2020-2029
TABLE 65 COLOMBIA PET FOAM MARKET BY APPLICATION (USD MILLION), 2020-2029
TABLE 66 COLOMBIA PET FOAM MARKET BY APPLICATION (TONS), 2020-2029
TABLE 67 REST OF SOUTH AMERICA PET FOAM MARKET BY RAW MATERIAL (USD MILLION), 2020-2029
TABLE 68 REST OF SOUTH AMERICA PET FOAM MARKET BY RAW MATERIAL (TONS), 2020-2029
TABLE 69 REST OF SOUTH AMERICA PET FOAM MARKET BY GRADE (USD MILLION), 2020-2029
TABLE 70 REST OF SOUTH AMERICA PET FOAM MARKET BY GRADE (TONS), 2020-2029
TABLE 71 REST OF SOUTH AMERICA PET FOAM MARKET BY APPLICATIONN (USD MILLION), 2020-2029
TABLE 72 REST OF SOUTH AMERICA PET FOAM MARKET BY APPLICATIONN (TONS), 2020-2029
TABLE 73 ASIA -PACIFIC PET FOAM MARKET BY RAW MATERIAL (USD MILLION), 2020-2029
TABLE 74 ASIA -PACIFIC PET FOAM MARKET BY RAW MATERIAL (TONS), 2020-2029
TABLE 75 ASIA -PACIFIC PET FOAM MARKET BY GRADE (USD MILLION), 2020-2029
TABLE 76 ASIA -PACIFIC PET FOAM MARKET BY GRADE (TONS), 2020-2029
TABLE 77 ASIA -PACIFIC PET FOAM MARKET BY APPLICATION (USD MILLION), 2020-2029
TABLE 78 ASIA -PACIFIC PET FOAM MARKET BY APPLICATION (TONS), 2020-2029
TABLE 79 ASIA -PACIFIC PET FOAM MARKET BY COUNTRY (USD MILLION), 2020-2029
TABLE 80 ASIA -PACIFIC PET FOAM MARKET BY COUNTRY (TONS), 2020-2029
TABLE 81 INDIA PET FOAM MARKET BY RAW MATERIAL (USD MILLION), 2020-2029
TABLE 82 INDIA PET FOAM MARKET BY RAW MATERIAL (TONS), 2020-2029
TABLE 83 INDIA PET FOAM MARKET BY GRADE (USD MILLION), 2020-2029
TABLE 84 INDIA PET FOAM MARKET BY GRADE (TONS), 2020-2029
TABLE 85 INDIA PET FOAM MARKET BY APPLICATION (USD MILLION), 2020-2029
TABLE 86 INDIA PET FOAM MARKET BY APPLICATION (TONS), 2020-2029
TABLE 87 CHINA PET FOAM MARKET BY RAW MATERIAL (USD MILLION), 2020-2029
TABLE 88 CHINA PET FOAM MARKET BY RAW MATERIAL (TONS), 2020-2029
TABLE 89 CHINA PET FOAM MARKET BY GRADE (USD MILLION), 2020-2029
TABLE 90 CHINA PET FOAM MARKET BY GRADE (TONS), 2020-2029
TABLE 91 CHINA PET FOAM MARKET BY APPLICATION (USD MILLION), 2020-2029
TABLE 92 CHINA PET FOAM MARKET BY APPLICATION (TONS), 2020-2029
TABLE 93 JAPAN PET FOAM MARKET BY RAW MATERIAL (USD MILLION), 2020-2029
TABLE 94 JAPAN PET FOAM MARKET BY RAW MATERIAL (TONS), 2020-2029
TABLE 95 JAPAN PET FOAM MARKET BY GRADE (USD MILLION), 2020-2029
TABLE 96 JAPAN PET FOAM MARKET BY GRADE (TONS), 2020-2029
TABLE 97 JAPAN PET FOAM MARKET BY APPLICATION (USD MILLION), 2020-2029
TABLE 98 JAPAN PET FOAM MARKET BY APPLICATION (TONS), 2020-2029
TABLE 99 SOUTH KOREA PET FOAM MARKET BY RAW MATERIAL (USD MILLION), 2020-2029
TABLE 100 SOUTH KOREA PET FOAM MARKET BY RAW MATERIAL (TONS), 2020-2029
TABLE 101 SOUTH KOREA PET FOAM MARKET BY GRADE (USD MILLION), 2020-2029
TABLE 102 SOUTH KOREA PET FOAM MARKET BY GRADE (TONS), 2020-2029
TABLE 103 SOUTH KOREA PET FOAM MARKET BY APPLICATION (USD MILLION), 2020-2029
TABLE 104 SOUTH KOREA PET FOAM MARKET BY APPLICATION (TONS), 2020-2029
TABLE 105 AUSTRALIA PET FOAM MARKET BY RAW MATERIAL (USD MILLION), 2020-2029
TABLE 106 AUSTRALIA PET FOAM MARKET BY GRADEBY RAW MATERIAL (TONS), 2020-2029
TABLE 107 AUSTRALIA PET FOAM MARKET BY GRADE (USD MILLION), 2020-2029
TABLE 108 AUSTRALIA PET FOAM MARKET BY GRADE (TONS), 2020-2029
TABLE 109 AUSTRALIA PET FOAM MARKET BY APPLICATION (USD MILLION), 2020-2029
TABLE 110 AUSTRALIA PET FOAM MARKET BY APPLICATION (TONS), 2020-2029
TABLE 111 REST OF ASIA PACIFIC PET FOAM MARKET BY RAW MATERIAL (USD MILLION), 2020-2029
TABLE 112 REST OF ASIA PACIFIC PET FOAM MARKET BY GRADEBY RAW MATERIAL (TONS), 2020-2029
TABLE 113 REST OF ASIA PACIFIC PET FOAM MARKET BY GRADE (USD MILLION), 2020-2029
TABLE 114 REST OF ASIA PACIFIC PET FOAM MARKET BY GRADE (TONS), 2020-2029
TABLE 115 REST OF ASIA PACIFIC PET FOAM MARKET BY APPLICATION (USD MILLION), 2020-2029
TABLE 116 REST OF ASIA PACIFIC PET FOAM MARKET BY APPLICATION (TONS), 2020-2029
TABLE 117 EUROPE PET FOAM MARKET BY RAW MATERIAL (USD MILLION), 2020-2029
TABLE 118 EUROPE PET FOAM MARKET BY RAW MATERIAL (TONS), 2020-2029
TABLE 119 EUROPE PET FOAM MARKET BY GRADE (USD MILLION), 2020-2029
TABLE 120 EUROPE PET FOAM MARKET BY GRADE (TONS), 2020-2029
TABLE 121 EUROPE PET FOAM MARKET BY APPLICATION (USD MILLION), 2020-2029
TABLE 122 EUROPE PET FOAM MARKET BY APPLICATION (TONS), 2020-2029
TABLE 123 EUROPE PET FOAM MARKET BY COUNTRY (USD MILLION), 2020-2029
TABLE 124 EUROPE PET FOAM MARKET BY COUNTRY (TONS), 2020-2029
TABLE 125 GERMANY PET FOAM MARKET BY RAW MATERIAL (USD MILLION), 2020-2029
TABLE 126 GERMANY PET FOAM MARKET BY RAW MATERIAL (TONS), 2020-2029
TABLE 127 GERMANY PET FOAM MARKET BY GRADE (USD MILLION), 2020-2029
TABLE 128 GERMANY PET FOAM MARKET BY GRADE (TONS), 2020-2029
TABLE 129 GERMANY PET FOAM MARKET BY APPLICATION (USD MILLION), 2020-2029
TABLE 130 GERMANY PET FOAM MARKET BY APPLICATION (TONS), 2020-2029
TABLE 131 UK PET FOAM MARKET BY RAW MATERIAL (USD MILLION), 2020-2029
TABLE 132 UK PET FOAM MARKET BY RAW MATERIAL (TONS), 2020-2029
TABLE 133 UK PET FOAM MARKET BY GRADE (USD MILLION), 2020-2029
TABLE 134 UK PET FOAM MARKET BY GRADE (TONS), 2020-2029
TABLE 135 UK PET FOAM MARKET BY APPLICATION (USD MILLION), 2020-2029
TABLE 136 UK PET FOAM MARKET BY APPLICATION (USD MILLION), 2020-2029
TABLE 137 FRANCE PET FOAM MARKET BY RAW MATERIAL (USD MILLION), 2020-2029
TABLE 138 FRANCE PET FOAM MARKET BY RAW MATERIAL (TONS), 2020-2029
TABLE 139 FRANCE PET FOAM MARKET BY GRADE (USD MILLION), 2020-2029
TABLE 140 FRANCE PET FOAM MARKET BY GRADE (TONS), 2020-2029
TABLE 141 FRANCE PET FOAM MARKET BY APPLICATION (USD MILLION), 2020-2029
TABLE 142 FRANCE PET FOAM MARKET BY APPLICATION (TONS), 2020-2029
TABLE 143 ITALY PET FOAM MARKET BY RAW MATERIAL (USD MILLION), 2020-2029
TABLE 144 ITALY PET FOAM MARKET BY RAW MATERIAL (TONS), 2020-2029
TABLE 145 ITALY PET FOAM MARKET BY GRADE (USD MILLION), 2020-2029
TABLE 146 ITALY PET FOAM MARKET BY GRADE (TONS), 2020-2029
TABLE 147 ITALY PET FOAM MARKET BY APPLICATION (USD MILLION), 2020-2029
TABLE 148 ITALY PET FOAM MARKET BY APPLICATION (TONS), 2020-2029
TABLE 149 SPAIN PET FOAM MARKET BY RAW MATERIAL (USD MILLION), 2020-2029
TABLE 150 SPAIN PET FOAM MARKET BY RAW MATERIAL (TONS), 2020-2029
TABLE 151 SPAIN PET FOAM MARKET BY GRADE (USD MILLION), 2020-2029
TABLE 152 SPAIN PET FOAM MARKET BY GRADE (TONS), 2020-2029
TABLE 153 SPAIN PET FOAM MARKET BY APPLICATION (USD MILLION), 2020-2029
TABLE 154 SPAIN PET FOAM MARKET BY APPLICATION (TONS), 2020-2029
TABLE 155 RUSSIA PET FOAM MARKET BY RAW MATERIAL (USD MILLION), 2020-2029
TABLE 156 RUSSIA PET FOAM MARKET BY RAW MATERIAL (TONS), 2020-2029
TABLE 157 RUSSIA PET FOAM MARKET BY GRADE (USD MILLION), 2020-2029
TABLE 158 RUSSIA PET FOAM MARKET BY GRADE (TONS), 2020-2029
TABLE 159 RUSSIA PET FOAM MARKET BY APPLICATION (USD MILLION), 2020-2029
TABLE 160 RUSSIA PET FOAM MARKET BY APPLICATION (TONS), 2020-2029
TABLE 161 REST OF EUROPE PET FOAM MARKET BY RAW MATERIAL (USD MILLION), 2020-2029
TABLE 162 REST OF EUROPE PET FOAM MARKET BY RAW MATERIAL (TONS), 2020-2029
TABLE 163 REST OF EUROPE PET FOAM MARKET BY GRADE (USD MILLION), 2020-2029
TABLE 164 REST OF EUROPE PET FOAM MARKET BY GRADE (TONS), 2020-2029
TABLE 165 REST OF EUROPE PET FOAM MARKET BY APPLICATIONN (USD MILLION), 2020-2029
TABLE 166 REST OF EUROPE PET FOAM MARKET BY APPLICATIONN (TONS), 2020-2029
TABLE 167 MIDDLE EAST AND AFRICA PET FOAM MARKET BY RAW MATERIAL (USD MILLION), 2020-2029
TABLE 168 MIDDLE EAST AND AFRICA PET FOAM MARKET BY RAW MATERIAL (TONS), 2020-2029
TABLE 169 MIDDLE EAST AND AFRICA PET FOAM MARKET BY GRADE (USD MILLION), 2020-2029
TABLE 170 MIDDLE EAST AND AFRICA PET FOAM MARKET BY GRADE (TONS), 2020-2029
TABLE 171 MIDDLE EAST AND AFRICA PET FOAM MARKET BY APPLICATION (USD MILLION), 2020-2029
TABLE 172 MIDDLE EAST AND AFRICA PET FOAM MARKET BY APPLICATION (TONS), 2020-2029
TABLE 173 MIDDLE EAST AND AFRICA PET FOAM MARKET BY COUNTRY (USD MILLION), 2020-2029
TABLE 174 MIDDLE EAST AND AFRICA PET FOAM MARKET BY COUNTRY (TONS), 2020-2029
TABLE 175 UAE PET FOAM MARKET BY RAW MATERIAL (USD MILLION), 2020-2029
TABLE 176 UAE PET FOAM MARKET BY RAW MATERIAL (TONS), 2020-2029
TABLE 177 UAE PET FOAM MARKET BY GRADE (USD MILLION), 2020-2029
TABLE 178 UAE PET FOAM MARKET BY GRADE (TONS), 2020-2029
TABLE 179 UAE PET FOAM MARKET BY APPLICATION (USD MILLION), 2020-2029
TABLE 180 UAE PET FOAM MARKET BY APPLICATION (TONS), 2020-2029
TABLE 181 SAUDI ARABIA PET FOAM MARKET BY RAW MATERIAL (USD MILLION), 2020-2029
TABLE 182 SAUDI ARABIA PET FOAM MARKET BY RAW MATERIAL (TONS), 2020-2029
TABLE 183 SAUDI ARABIA PET FOAM MARKET BY GRADE (USD MILLION), 2020-2029
TABLE 184 SAUDI ARABIA PET FOAM MARKET BY GRADE (TONS), 2020-2029
TABLE 185 SAUDI ARABIA PET FOAM MARKET BY APPLICATION (USD MILLION), 2020-2029
TABLE 186 SAUDI ARABIA PET FOAM MARKET BY APPLICATION (TONS), 2020-2029
TABLE 187 SOUTH AFRICA PET FOAM MARKET BY RAW MATERIAL (USD MILLION), 2020-2029
TABLE 188 SOUTH AFRICA PET FOAM MARKET BY RAW MATERIAL (TONS), 2020-2029
TABLE 189 SOUTH AFRICA PET FOAM MARKET BY GRADE (USD MILLION), 2020-2029
TABLE 190 SOUTH AFRICA PET FOAM MARKET BY GRADE (TONS), 2020-2029
TABLE 191 SOUTH AFRICA PET FOAM MARKET BY APPLICATION (USD MILLION), 2020-2029
TABLE 192 SOUTH AFRICA PET FOAM MARKET BY APPLICATION (TONS), 2020-2029
TABLE 193 REST OF MIDDLE EAST AND AFRICA PET FOAM MARKET BY RAW MATERIAL (USD MILLION), 2020-2029
TABLE 194 REST OF MIDDLE EAST AND AFRICA PET FOAM MARKET BY RAW MATERIAL (TONS), 2020-2029
TABLE 195 REST OF MIDDLE EAST AND AFRICA PET FOAM MARKET BY GRADE (USD MILLION), 2020-2029
TABLE 196 REST OF MIDDLE EAST AND AFRICA PET FOAM MARKET BY GRADE (TONS), 2020-2029
TABLE 197 REST OF MIDDLE EAST AND AFRICA PET FOAM MARKET BY APPLICATION (USD MILLION), 2020-2029
TABLE 198 REST OF MIDDLE EAST AND AFRICA PET FOAM MARKET BY APPLICATION (TONS), 2020-2029
LIST OF FIGURES
FIGURE 1 MARKET DYNAMICS
FIGURE 2 MARKET SEGMENTATION
FIGURE 3 REPORT TIMELINES: YEARS CONSIDERED
FIGURE 4 DATA TRIANGULATION
FIGURE 5 BOTTOM-UP APPROACH
FIGURE 6 TOP-DOWN APPROACH
FIGURE 7 RESEARCH FLOW
FIGURE 8 GLOBAL PET FOAM MARKET BY RAW MATERIAL, USD MILLION, 2020-2029
FIGURE 9 GLOBAL PET FOAM MARKET BY GRADE, USD MILLION, 2020-2029
FIGURE 10 GLOBAL PET FOAM MARKET BY APPLICATION, USD MILLION, 2021
FIGURE 11 GLOBAL PET FOAM MARKET BY REGION, USD MILLION, 2020-2029
FIGURE 12 PORTER’S FIVE FORCES MODEL
FIGURE 13 GLOBAL PET FOAM MARKET BY RAW MATERIAL, USD MILLION, 2021
FIGURE 14 GLOBAL PET FOAM MARKET BY GRADE, USD MILLION, 2021
FIGURE 15 GLOBAL PET FOAM MARKET BY APPLICATION, USD MILLION, 2021
FIGURE 16 GLOBAL PET FOAM MARKET BY REGION, USD MILLION, 2021
FIGURE 17 MARKET SHARE ANALYSIS
FIGURE 18 ARMACELL INTERNATIONAL S.A.: COMPANY SNAPSHOT
FIGURE 19 3A COMPOSITES: COMPANY SNAPSHOT
FIGURE 20 GURIT HOLDING AG: COMPANY SNAPSHOT
FIGURE 21 DIAB GROUP: COMPANY SNAPSHOT
FIGURE 22 BASF SE: COMPANY SNAPSHOT
FIGURE 23 SEKISUI PLASTICS CO. LTD.: COMPANY SNAPSHOT
FIGURE 24 HUNTSMAN INTERNATIONAL LLC: COMPANY SNAPSHOT
FIGURE 25 CORELITE INC.: COMPANY SNAPSHOT
FIGURE 26 CHANGZHOU TIANSHENG NEW MATERIALS CO. LTD.: COMPANY SNAPSHOT
FIGURE 27 CARBON-CORE CORPORATION: COMPANY SNAPSHOT
DOWNLOAD FREE SAMPLE REPORT
License Type
SPEAK WITH OUR ANALYST
Want to know more about the report or any specific requirement?
WANT TO CUSTOMIZE THE REPORT?
Our Clients Speak
We asked them to research ‘ Equipment market’ all over the world, and their whole arrangement was helpful to us. thehealthanalytics.com insightful analysis and reports contributed to our current analysis and in creating a future strategy. Besides, the te
Yosuke Mitsui
Senior Associate Construction Equipment Sales & Marketing
We asked them to research ‘Equipment market’ all over the world, and their whole arrangement was helpful to us. thehealthanalytics.com insightful analysis and reports contributed to our current analysis and in creating a future strategy. Besides, the te


