

Base Year Value ()
x.x %
x.x %
CAGR ()
x.x %
x.x %
Forecast Year Value ()
x.x %
x.x %
Historical Data Period
Largest Region
Forecast Period
Marché du NAS évolutif par composant (logiciel, matériel), par technologie de stockage (fichier, objet, bloc), par modèle de déploiement (sur site, cloud), par taille d'organisation (PME, grandes entreprises), par secteur vertical (BFSI, gouvernement, soins de santé) et par région, tendances mondiales et prévisions de 2022 à 2029
Instant access to hundreds of data points and trends
- Market estimates from 2014-2029
- Competitive analysis, industry segmentation, financial benchmarks
- Incorporates SWOT, Porter's Five Forces and risk management frameworks
- PDF report or online database with Word, Excel and PowerPoint export options
- 100% money back guarantee
Aperçu du marché des NAS évolutifs
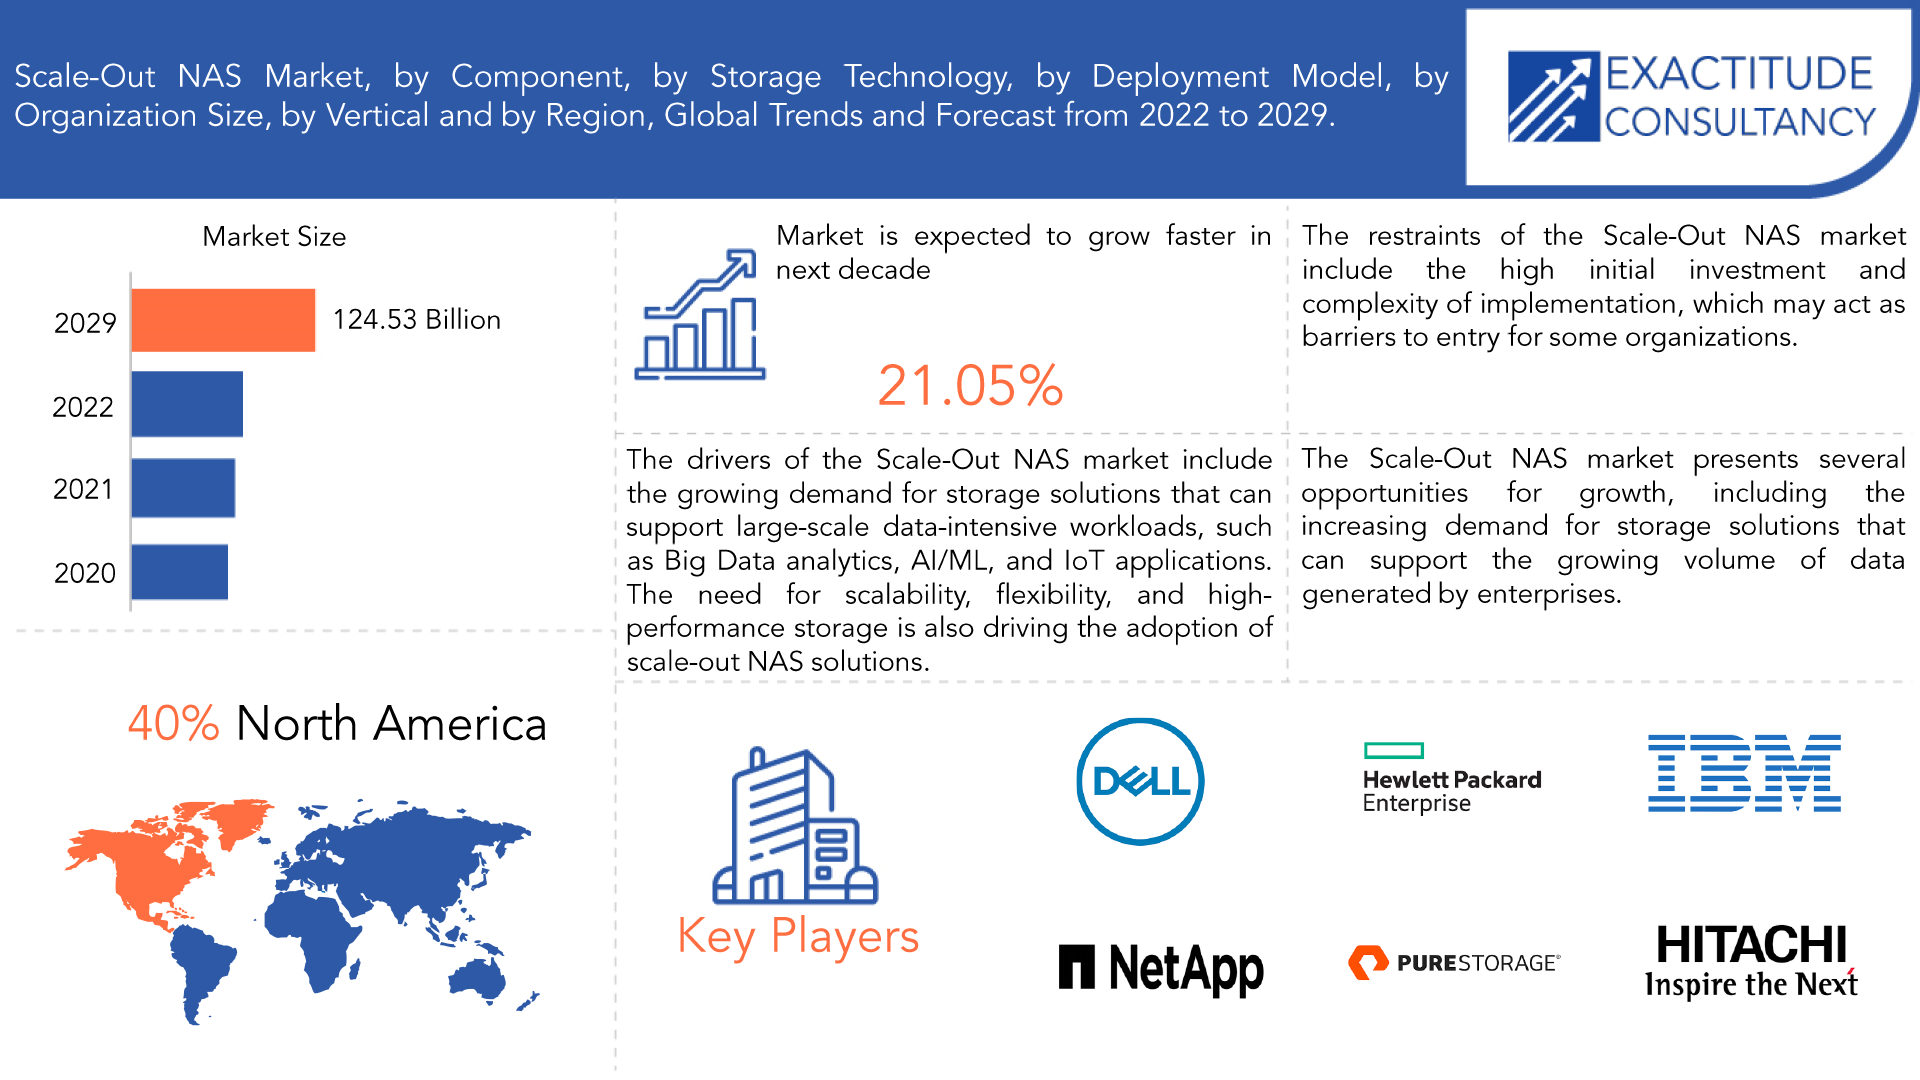
Le marché des NAS évolutifs devrait croître à un TCAC de 21,05 % entre 2022 et 2029. Il devrait atteindre plus de 124,53 milliards USD d'ici 2029, contre 22,31 milliards USD en 2020.
En ajoutant davantage de nœuds de stockage à l'infrastructure actuelle, le NAS (Network Attached Storage), une forme de système de stockage distribué, permet une mise à l'échelle horizontale. Les secteurs à forte intensité de données comme les médias et le divertissement, la santé, la recherche scientifique et les applications basées sur le cloud adoptent fréquemment des solutions NAS évolutives. La taille du marché des NAS évolutifs est souvent exprimée en termes de revenus et de capacité de stockage et comprend le matériel, les logiciels et les services d'assistance.
La demande d’options de stockage hautes performances capables de gérer le volume croissant de données générées par les entreprises est à l’origine de la croissance du secteur des NAS évolutifs. Pourtant, pour certaines entreprises, le coût initial substantiel et la complexité de la mise en œuvre peuvent constituer des obstacles à l’entrée. Le secteur est extrêmement compétitif, les principaux concurrents se concentrant sur l’innovation et les alliances commerciales pour préserver leur part de marché.
| ATTRIBUT | DÉTAILS |
| Période d'étude | 2020-2029 |
| Année de base | 2021 |
| Année estimée | 2022 |
| Année prévue | 2022-2029 |
| Période historique | 2018-2020 |
| Unité | Valeur (en milliards USD). |
| Segmentation | Par composant, par technologie de stockage, par modèle de déploiement, par taille d'organisation, par secteur vertical, par région. |
| Par composant |
|
| Par technologie de stockage |
|
| Par modèle de déploiement |
|
| Par taille d'organisation |
|
| Par vertical |
|
| Par région |
|
Le besoin d'options de stockage capables de prendre en charge des charges de travail très gourmandes en données, telles que l'analyse du Big Data, l'IA/ML et les applications IoT, est l'un des facteurs clés de la mise en place d'un NAS évolutif. La popularité des solutions NAS évolutives est également alimentée par la demande d'évolutivité, de flexibilité et de stockage hautes performances. Les systèmes NAS évolutifs sont également très demandés car ils sont nécessaires dans un certain nombre de secteurs, notamment la santé, les médias et le divertissement, et la recherche scientifique, où il existe un besoin de solutions de stockage abordables et fiables.
L’investissement initial élevé et la mise en œuvre compliquée sont deux facteurs qui limitent la croissance du secteur des NAS évolutifs et pourraient empêcher certaines entreprises d’y entrer. Parmi les autres difficultés auxquelles le marché est confronté figurent les inquiétudes concernant la sécurité des données et les exigences de conformité réglementaire. Les NAS évolutifs et le stockage basé sur le cloud sont deux alternatives aux NAS traditionnels qui peuvent limiter la croissance du secteur des NAS évolutifs.
La demande de solutions de stockage capables de prendre en charge le volume croissant de données générées par les entreprises est l'une des nombreuses perspectives potentielles présentées par le secteur du NAS évolutif. Les solutions de stockage hautes performances sont très demandées en raison du développement de technologies telles que l'IA /ML, l'analyse Big Data et l'IoT. En outre, on s'attend à ce que le marché connaisse de nouvelles opportunités en raison de la demande croissante de solutions de stockage définies par logiciel et de virtualisation des données. En outre, la croissance du marché devrait être alimentée par le besoin de solutions de stockage évolutives et abordables.
La pandémie de COVID-19 a eu un impact sur le marché des NAS évolutifs, car elle a ralenti l'activité économique et provoqué des problèmes de chaîne d'approvisionnement. Bien que davantage d'entreprises aient adopté des règles de travail à distance et des plans de transformation numérique en raison de la pandémie, cela a également augmenté la demande de solutions de stockage de données. En conséquence, le marché a constaté une augmentation de la demande de solutions de stockage définies par logiciel et de solutions NAS évolutives pouvant être exploitées à distance.
[caption id="attachment_24513" align="aligncenter" width="1920"]
Frequently Asked Questions
• What is the worth of scale-out NAS market?
The scale-out NAS market is expected to grow at 21.05 % CAGR from 2022 to 2029. It is expected to reach above USD 124.53 Billion by 2029 from USD 22.31 Billion in 2020.
• What is the size of the North America scale-out NAS industry?
North America held more than 40% of the scale-out NAS market revenue share in 2021 and will witness expansion in the forecast period.
• What are some of the market's driving forces?
The need for storage options that can accommodate massively data-intensive workloads, such as Big Data analytics, AI/ML, and IoT applications, is one of the key factors for scale-out NAS. Scale-out NAS solution popularity is also being fueled by the demand for scalability, flexibility, and high-performance storage.
• Which are the top companies to hold the market share in scale-out NAS market?
The scale-out NAS market key players includes Dell Technologies Inc., Hewlett Packard Enterprise Development LP, IBM Corporation, Hitachi Vantara Corporation, Pure Storage, Inc., NetApp, Inc., Fujitsu Limited, Qumulo, Inc., Nutanix, Inc., Panasas, Inc.
• What is the leading component of scale-out NAS market?
The scale-out network attached storage (NAS) market is divided into two categories based on component: software and service. High performance computing, data integration, data management, big data, and in-memory data grid are sub-segments of the software segment. Professional services and system integration are sub-segments of the service segment.
Scale-Out NAS Market Segment Analysis
The scale-out NAS market is segmented based on component, storage technology, deployment model, organization size and Vertical.
The scale-out network attached storage (NAS) market is divided into two categories based on component: software and service. High performance computing, data integration, data management, big data, and in-memory data grid are sub-segments of the software segment. Professional services and system integration are sub-segments of the service segment.
The file storage, block storage, and object storage segments of the worldwide scale out NAS market are separated based on storage technology. The market segment with the biggest share in recent years is predicted to continue dominating during the forecast period. The segment for block storage is predicted to experience the largest CAGR growth during the projection period. During the course of the projection period, object storage is anticipated to grow at a sizable CAGR.
The global scale out NAS market may be divided into two categories based on deployment type: on-premises and cloud. With a remarkable CAGR of 20.0% over the course of the projected year, the cloud-based segment is predicted to reach significant revenue levels. The advantage of cloud technology is its low-cost integration into the existing business environment. The scalability and flexibility of cloud-based systems are well known.
The global scale out NAS market is segmented based on organization size into large and small & medium-sized businesses. Throughout the projection period, market growth is anticipated in the big enterprise sector. Big businesses can buy just a software license or software copy to operate the platform due to they have dedicated servers and computer equipment. They are then able to lower the costs associated with implementation, total ownership, and other relevant expenses.
The BFSI, healthcare, and government segments make up the worldwide scale out NAS market. The BFSI sector is anticipated to have the greatest CAGR over the projection period. Consumers may now conduct smooth banking through the mobile channel thanks to the rising use of smartphones for financial transactions. This has resulted in more personalized engagement. The possibility and complexity of managing to provide a great client experience have both expanded with this new trend.
[caption id="attachment_24517" align="aligncenter" width="1920"]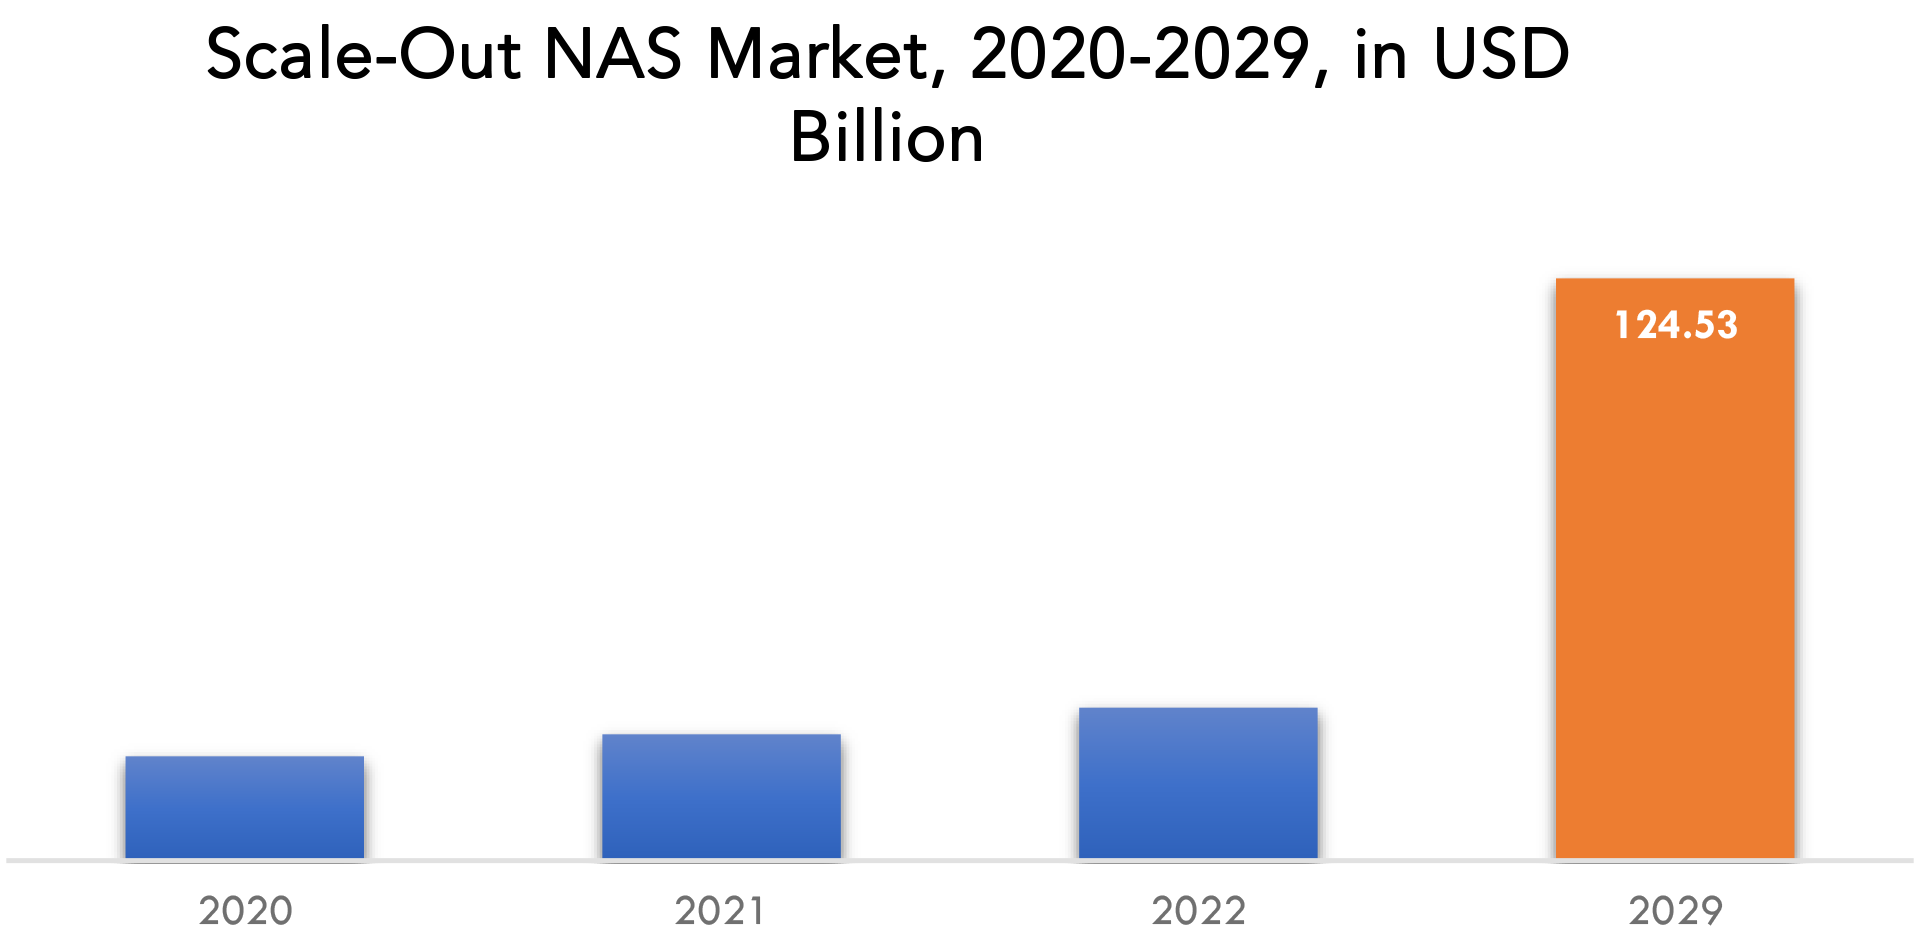
Scale-Out NAS Market Player
The scale-out NAS market key players includes Dell Technologies Inc., Hewlett Packard Enterprise Development LP, IBM Corporation, Hitachi Vantara Corporation, Pure Storage, Inc., NetApp, Inc., Fujitsu Limited, Qumulo, Inc., Nutanix, Inc., Panasas, Inc.
Recent Developments 20 March 2023: Hewlett Packard Enterprise announced that it had entered into a definitive agreement to acquire OpsRamp, an IT operations management (ITOM) company that monitors, observes, automates and manages IT infrastructure, cloud resources, workloads and applications for hybrid and multi-cloud environments, including the leading hyperscalers. 26 February 2023: Hewlett Packard Enterprise and Nokia announced the expansion of their existing partnership by signing a Memorandum of Understanding (MoU) to jointly offer an open and competitive Cloud RAN solution to Communication Service Providers (CSPs) and enterprises worldwide.Who Should Buy? Or Key Stakeholders
- Scale-out NAS Software Vendors
- Service Providers
- Application Design and Development Service Providers
- System Integrators/Migration Service Providers
- Consultancy Firms/Advisory Firms
- Training and Education Service Providers
- Data Integration Service Providers
- Managed Service Providers
- Investors
- Others
Scale-Out NAS Market Regional Analysis
The scale-out NAS market by region includes North America, Asia-Pacific (APAC), Europe, South America, and Middle East & Africa (MEA).
- North America: includes the US, Canada, Mexico
- Asia Pacific: includes China, Japan, South Korea, India, Australia, ASEAN and Rest of APAC
- Europe: includes UK, Germany, France, Italy, Spain, Russia, and Rest of Europe
- South America: includes Brazil, Argentina and Rest of South America
- Middle East & Africa: includes Turkey, UAE, Saudi Arabia, South Africa, and Rest of MEA
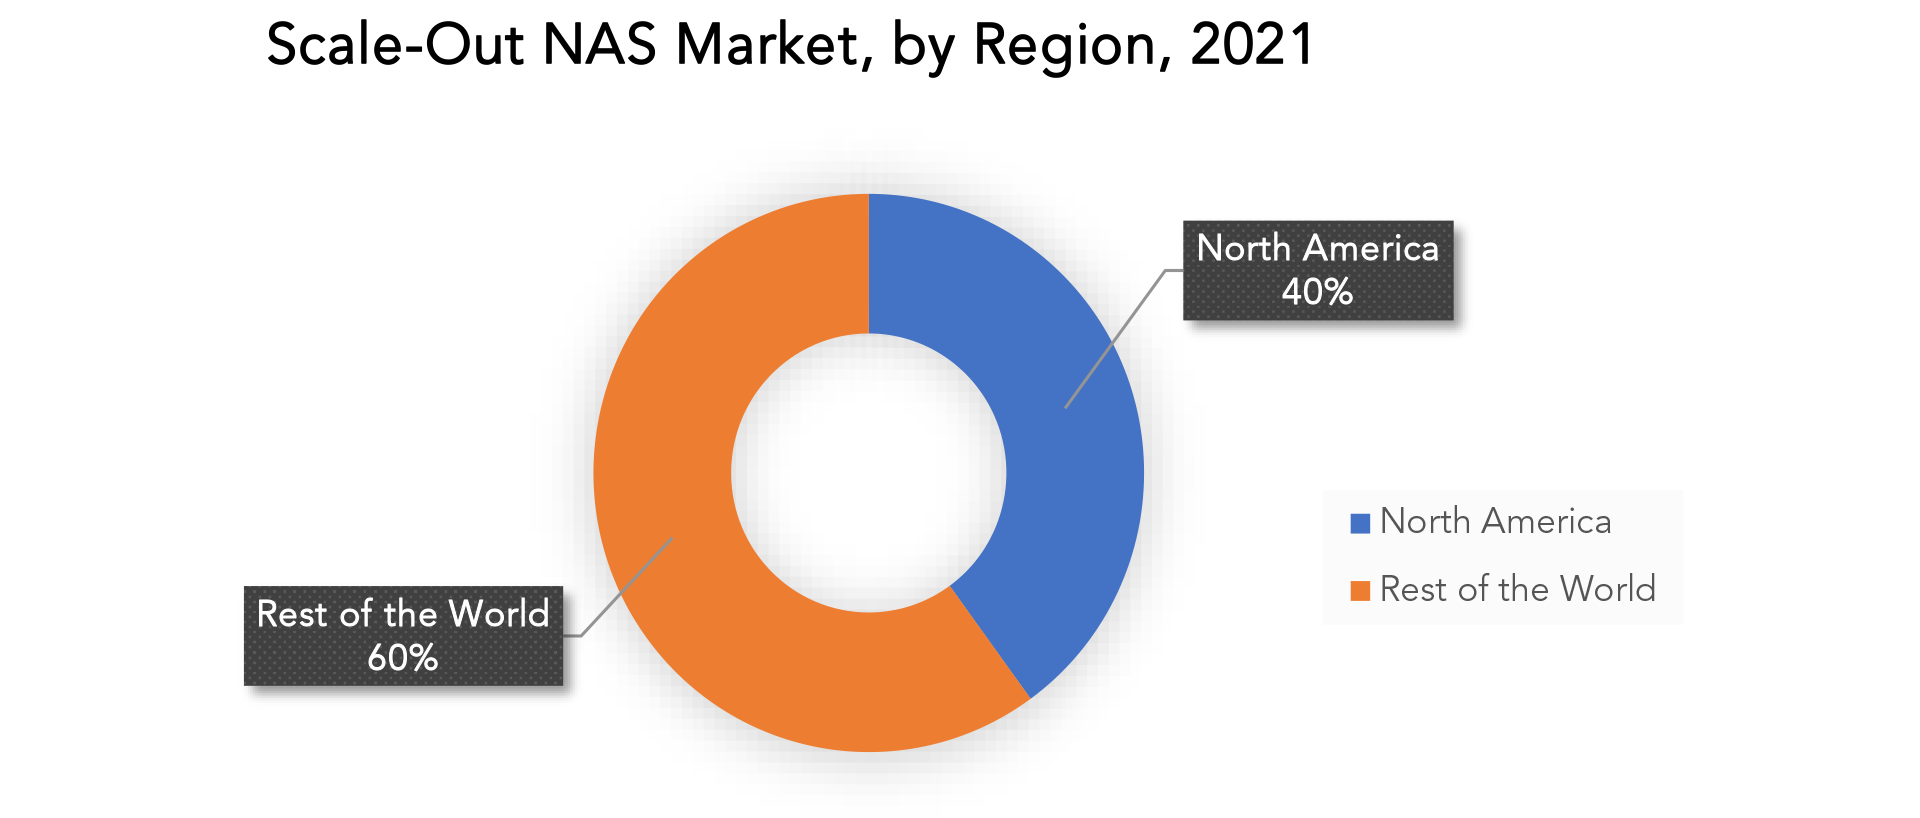
North America held more than 40% of the scale-out NAS market revenue share in 2021 and will witness expansion in the forecast period. Due to to the widespread use of digital transformation technologies and the concentration of some of the most significant market participants in North America, this region accounted for the largest market for Scale-Out NAS systems. Due to reasons including the rising use of cloud-based services, the rising popularity of big data analytics, and the presence of numerous expanding economies like China and India, the Asia Pacific area was predicted to have considerable growth throughout the projection period.
Another key market for Scale-Out NAS systems was Europe, which was fueled by the presence of numerous well-known players there and the growing adoption of digital transformation technologies across different industries.Key Market Segments: Scale-Out NAS Market
Scale-Out NAS Market by Component, 2020-2029, (USD Billion).- Software
- Hardware
- File
- Object
- Block
- On-Premise
- Cloud
- SMEs
- Large Enterprises
- BFSI
- Government
- Healthcare
- North America
- Asia Pacific
- Europe
- South America
- Middle East And Africa
Exactitude Consultancy Services Key Objectives
- Increasing sales and market share
- Developing new technology
- Improving profitability
- Entering new markets
- Enhancing brand reputation
Key Question Answered
- What is the expected growth rate of the scale-out NAS market over the next 21.05 years?
- Who are the major players in the scale-out NAS market and what is their market share?
- What are the end-user industries driving demand for market and what is their outlook?
- What are the opportunities for growth in emerging markets such As Asia-Pacific, Middle East, and Africa?
- How is the economic environment affecting the scale-out NAS market, including factors such as interest rates, inflation, and exchange rates?
- What is the expected impact of government policies and regulations on the scale-out NAS market?
- What is the current and forecasted size and growth rate of the global scale-out NAS market?
- What are the key drivers of growth in the scale-out NAS market?
- What are the distribution channels and supply chain dynamics in the scale-out NAS market?
- What are the technological advancements and innovations in the scale-out NAS market and their impact on storage technology development and growth?
- What are the regulatory considerations and their impact on the market?
- What are the challenges faced by players in the scale-out NAS market and how are they addressing these challenges?
- What are the opportunities for growth and expansion in the scale-out NAS market?
- What are the products offerings and specifications of leading players in the market?
- What is the pricing trend of scale-out NAS in the market and what is the impact of raw storage technology prices on the price trend?
- INTRODUCTION
- DÉFINITION DU MARCHÉ
- SEGMENTATION DU MARCHÉ
- ÉCHÉANCES DE RECHERCHE
- Hypothèses et limites
- MÉTHODOLOGIE DE RECHERCHE
- EXPLORATION DE DONNÉES
- RECHERCHE SECONDAIRE
- RECHERCHE PRIMAIRE
- CONSEILS D'EXPERTS EN LA MATIÈRE
- CONTRÔLES DE QUALITÉ
- REVUE FINALE
- TRIANGULATION DES DONNÉES
- APPROCHE ASCENDANTE
- APPROCHE DESCENDANTE
- FLUX DE RECHERCHE
- SOURCES DE DONNÉES
- EXPLORATION DE DONNÉES
- RÉSUMÉ EXÉCUTIF
- APERÇU DU MARCHÉ
- PERSPECTIVES DU MARCHÉ MONDIAL DES NAS À GRANDE ÉCHELLE
- MOTEURS DU MARCHÉ
- RESTRICTIONS DU MARCHÉ
- OPPORTUNITÉS DE MARCHÉ
- IMPACT DU COVID-19 SUR LE MARCHÉ DES NAS À GRANDE ÉCHELLE
- MODÈLE DES CINQ FORCES DE PORTER
- MENACE DES NOUVEAUX ENTRANTS
- MENACE DES SUBSTITUTS
- POUVOIR DE NÉGOCIATION DES FOURNISSEURS
- POUVOIR DE NÉGOCIATION DES CLIENTS
- DEGRÉ DE COMPÉTITION
- ANALYSE DE LA CHAÎNE DE VALEUR INDUSTRIELLE
- PERSPECTIVES DU MARCHÉ MONDIAL DES NAS À GRANDE ÉCHELLE
- MARCHÉ MONDIAL DES NAS À GRANDE ÉCHELLE PAR COMPOSANT (MILLIARDS USD), 2020-2029
- LOGICIEL
- MATÉRIEL
- MARCHÉ MONDIAL DES NAS À ÉCHELLE EXTENSIBLE PAR TECHNOLOGIE DE STOCKAGE (MILLIARDS USD), 2020-2029
- DÉPOSER
- OBJET
- BLOC
- MARCHÉ MONDIAL DES NAS À GRANDE ÉCHELLE PAR MODÈLE DE DÉPLOIEMENT (MILLIARDS USD), 2020-2029
- SUR PLACE
- NUAGE
- MARCHÉ MONDIAL DES NAS À GRANDE ÉCHELLE PAR TAILLE D'ORGANISATION (MILLIARDS USD), 2020-2029
- PME
- GRANDES ENTREPRISES
- MARCHÉ MONDIAL DES NAS À GRANDE ÉCHELLE PAR VERTICAL (EN MILLIARDS DE DOLLARS), 2020-2029
- BFSI
- GOUVERNEMENT
- SOINS DE SANTÉ
- MARCHÉ MONDIAL DES NAS À GRANDE ÉCHELLE PAR RÉGION (MILLIARDS USD), 2020-2029
- AMÉRIQUE DU NORD
- NOUS
- CANADA
- MEXIQUE
- AMÉRIQUE DU SUD
- BRÉSIL
- ARGENTINE
- COLOMBIE
- RESTE DE L'AMÉRIQUE DU SUD
- EUROPE
- ALLEMAGNE
- ROYAUME-UNI
- FRANCE
- ITALIE
- ESPAGNE
- RUSSIE
- RESTE DE L'EUROPE
- ASIE-PACIFIQUE
- INDE
- CHINE
- JAPON
- SOUTH KOREA
- AUSTRALIA
- SOUTH-EAST ASIA
- REST OF ASIA PACIFIC
- MIDDLE EAST AND AFRICA
- UAE
- SAUDI ARABIA
- SOUTH AFRICA
- REST OF MIDDLE EAST AND AFRICA
- AMÉRIQUE DU NORD
- COMPANY PROFILES* (BUSINESS OVERVIEW, COMPANY SNAPSHOT, PRODUCTS OFFERED, RECENT DEVELOPMENTS)
- DELL TECHNOLOGIES INC.
- HEWLETT PACKARD ENTERPRISE DEVELOPMENT LP
- IBM CORPORATION
- HITACHI VANTARA CORPORATION
- PURE STORAGE, INC.
- NETAPP, INC.
- FUJITSU LIMITED
- QUMULO, INC.
- NUTANIX, INC.
- PANASAS, INC. *THE COMPANY LIST IS INDICATIVE
LIST OF TABLES
TABLE 1 GLOBAL SCALE-OUT NAS MARKET BY COMPONENT (USD BILLION) 2020-2029
TABLE 2 GLOBAL SCALE-OUT NAS MARKET BY STORAGE TECHNOLOGY (USD BILLION) 2020-2029
TABLE 3 GLOBAL SCALE-OUT NAS MARKET BY DEPLOYMENT MODEL (USD BILLION) 2020-2029
TABLE 4 GLOBAL SCALE-OUT NAS MARKET BY ORGANIZATION SIZE (USD BILLION) 2020-2029
TABLE 5 GLOBAL SCALE-OUT NAS MARKET BY VERTICAL (USD BILLION) 2020-2029
TABLE 6 GLOBAL SCALE-OUT NAS MARKET BY REGION (USD BILLION) 2020-2029
TABLE 7 NORTH AMERICA SCALE-OUT NAS MARKET BY COUNTRY (USD BILLION) 2020-2029
TABLE 8 NORTH AMERICA SCALE-OUT NAS MARKET BY COMPONENT (USD BILLION) 2020-2029
TABLE 9 NORTH AMERICA SCALE-OUT NAS MARKET BY STORAGE TECHNOLOGY (USD BILLION) 2020-2029
TABLE 10 NORTH AMERICA SCALE-OUT NAS MARKET BY DEPLOYMENT MODEL (USD BILLION) 2020-2029
TABLE 11 NORTH AMERICA SCALE-OUT NAS MARKET BY ORGANIZATION SIZE (USD BILLION) 2020-2029
TABLE 12 NORTH AMERICA SCALE-OUT NAS MARKET BY VERTICAL (USD BILLION) 2020-2029
TABLE 13 US SCALE-OUT NAS MARKET BY COMPONENT (USD BILLION) 2020-2029
TABLE 14 US SCALE-OUT NAS MARKET BY STORAGE TECHNOLOGY (USD BILLION) 2020-2029
TABLE 15 US SCALE-OUT NAS MARKET BY DEPLOYMENT MODEL (USD BILLION) 2020-2029
TABLE 16 US SCALE-OUT NAS MARKET BY ORGANIZATION SIZE (USD BILLION) 2020-2029
TABLE 17 US SCALE-OUT NAS MARKET BY VERTICAL (USD BILLION) 2020-2029
TABLE 18 CANADA SCALE-OUT NAS MARKET BY COMPONENT (USD BILLION) 2020-2029
TABLE 19 CANADA SCALE-OUT NAS MARKET BY STORAGE TECHNOLOGY (USD BILLION) 2020-2029
TABLE 20 CANADA SCALE-OUT NAS MARKET BY DEPLOYMENT MODEL (USD BILLION) 2020-2029
TABLE 21 CANADA SCALE-OUT NAS MARKET BY ORGANIZATION SIZE (USD BILLION) 2020-2029
TABLE 22 CANADA SCALE-OUT NAS MARKET BY VERTICAL (USD BILLION) 2020-2029
TABLE 23 MEXICO SCALE-OUT NAS MARKET BY COMPONENT (USD BILLION) 2020-2029
TABLE 24 MEXICO SCALE-OUT NAS MARKET BY STORAGE TECHNOLOGY (USD BILLION) 2020-2029
TABLE 25 MEXICO SCALE-OUT NAS MARKET BY DEPLOYMENT MODEL (USD BILLION) 2020-2029
TABLE 26 MEXICO SCALE-OUT NAS MARKET BY ORGANIZATION SIZE (USD BILLION) 2020-2029
TABLE 27 MEXICO SCALE-OUT NAS MARKET BY VERTICAL (USD BILLION) 2020-2029
TABLE 28 SOUTH AMERICA SCALE-OUT NAS MARKET BY COUNTRY (USD BILLION) 2020-2029
TABLE 29 SOUTH AMERICA SCALE-OUT NAS MARKET BY COMPONENT (USD BILLION) 2020-2029
TABLE 30 SOUTH AMERICA SCALE-OUT NAS MARKET BY STORAGE TECHNOLOGY (USD BILLION) 2020-2029
TABLE 31 SOUTH AMERICA SCALE-OUT NAS MARKET BY DEPLOYMENT MODEL (USD BILLION) 2020-2029
TABLE 32 SOUTH AMERICA SCALE-OUT NAS MARKET BY ORGANIZATION SIZE (USD BILLION) 2020-2029
TABLE 33 SOUTH AMERICA SCALE-OUT NAS MARKET BY VERTICAL (USD BILLION) 2020-2029
TABLE 34 BRAZIL SCALE-OUT NAS MARKET BY COMPONENT (USD BILLION) 2020-2029
TABLE 35 BRAZIL SCALE-OUT NAS MARKET BY STORAGE TECHNOLOGY (USD BILLION) 2020-2029
TABLE 36 BRAZIL SCALE-OUT NAS MARKET BY DEPLOYMENT MODEL (USD BILLION) 2020-2029
TABLE 37 BRAZIL SCALE-OUT NAS MARKET BY ORGANIZATION SIZE (USD BILLION) 2020-2029
TABLE 38 BRAZIL SCALE-OUT NAS MARKET BY VERTICAL (USD BILLION) 2020-2029
TABLE 39 ARGENTINA SCALE-OUT NAS MARKET BY COMPONENT (USD BILLION) 2020-2029
TABLE 40 ARGENTINA SCALE-OUT NAS MARKET BY STORAGE TECHNOLOGY (USD BILLION) 2020-2029
TABLE 41 ARGENTINA SCALE-OUT NAS MARKET BY DEPLOYMENT MODEL (USD BILLION) 2020-2029
TABLE 42 ARGENTINA SCALE-OUT NAS MARKET BY ORGANIZATION SIZE (USD BILLION) 2020-2029
TABLE 43 ARGENTINA SCALE-OUT NAS MARKET BY VERTICAL (USD BILLION) 2020-2029
TABLE 44 COLOMBIA SCALE-OUT NAS MARKET BY COMPONENT (USD BILLION) 2020-2029
TABLE 45 COLOMBIA SCALE-OUT NAS MARKET BY STORAGE TECHNOLOGY (USD BILLION) 2020-2029
TABLE 46 COLOMBIA SCALE-OUT NAS MARKET BY DEPLOYMENT MODEL (USD BILLION) 2020-2029
TABLE 47 COLOMBIA SCALE-OUT NAS MARKET BY ORGANIZATION SIZE (USD BILLION) 2020-2029
TABLE 48 COLOMBIA SCALE-OUT NAS MARKET BY VERTICAL (USD BILLION) 2020-2029
TABLE 49 REST OF SOUTH AMERICA SCALE-OUT NAS MARKET BY COMPONENT (USD BILLION) 2020-2029
TABLE 50 REST OF SOUTH AMERICA SCALE-OUT NAS MARKET BY STORAGE TECHNOLOGY (USD BILLION) 2020-2029
TABLE 51 REST OF SOUTH AMERICA SCALE-OUT NAS MARKET BY DEPLOYMENT MODEL (USD BILLION) 2020-2029
TABLE 52 REST OF SOUTH AMERICA SCALE-OUT NAS MARKET BY ORGANIZATION SIZE (USD BILLION) 2020-2029
TABLE 53 REST OF SOUTH AMERICA SCALE-OUT NAS MARKET BY VERTICAL (USD BILLION) 2020-2029
TABLE 54 ASIA-PACIFIC SCALE-OUT NAS MARKET BY COUNTRY (USD BILLION) 2020-2029
TABLE 55 ASIA-PACIFIC SCALE-OUT NAS MARKET BY COMPONENT (USD BILLION) 2020-2029
TABLE 56 ASIA-PACIFIC SCALE-OUT NAS MARKET BY STORAGE TECHNOLOGY (USD BILLION) 2020-2029
TABLE 57 ASIA-PACIFIC SCALE-OUT NAS MARKET BY DEPLOYMENT MODEL (USD BILLION) 2020-2029
TABLE 58 ASIA-PACIFIC SCALE-OUT NAS MARKET BY ORGANIZATION SIZE (USD BILLION) 2020-2029
TABLE 59 ASIA-PACIFIC SCALE-OUT NAS MARKET BY VERTICAL (USD BILLION) 2020-2029
TABLE 60 INDIA SCALE-OUT NAS MARKET BY COMPONENT (USD BILLION) 2020-2029
TABLE 61 INDIA SCALE-OUT NAS MARKET BY STORAGE TECHNOLOGY (USD BILLION) 2020-2029
TABLE 62 INDIA SCALE-OUT NAS MARKET BY DEPLOYMENT MODEL (USD BILLION) 2020-2029
TABLE 63 INDIA SCALE-OUT NAS MARKET BY ORGANIZATION SIZE (USD BILLION) 2020-2029
TABLE 64 INDIA SCALE-OUT NAS MARKET BY VERTICAL (USD BILLION) 2020-2029
TABLE 65 CHINA SCALE-OUT NAS MARKET BY COMPONENT (USD BILLION) 2020-2029
TABLE 66 CHINA SCALE-OUT NAS MARKET BY STORAGE TECHNOLOGY (USD BILLION) 2020-2029
TABLE 67 CHINA SCALE-OUT NAS MARKET BY DEPLOYMENT MODEL (USD BILLION) 2020-2029
TABLE 68 CHINA SCALE-OUT NAS MARKET BY ORGANIZATION SIZE (USD BILLION) 2020-2029
TABLE 69 CHINA SCALE-OUT NAS MARKET BY VERTICAL (USD BILLION) 2020-2029
TABLE 70 JAPAN SCALE-OUT NAS MARKET BY COMPONENT (USD BILLION) 2020-2029
TABLE 71 JAPAN SCALE-OUT NAS MARKET BY STORAGE TECHNOLOGY (USD BILLION) 2020-2029
TABLE 72 JAPAN SCALE-OUT NAS MARKET BY DEPLOYMENT MODEL (USD BILLION) 2020-2029
TABLE 73 JAPAN SCALE-OUT NAS MARKET BY ORGANIZATION SIZE (USD BILLION) 2020-2029
TABLE 74 JAPAN SCALE-OUT NAS MARKET BY VERTICAL (USD BILLION) 2020-2029
TABLE 75 SOUTH KOREA SCALE-OUT NAS MARKET BY COMPONENT (USD BILLION) 2020-2029
TABLE 76 SOUTH KOREA SCALE-OUT NAS MARKET BY STORAGE TECHNOLOGY (USD BILLION) 2020-2029
TABLE 77 SOUTH KOREA SCALE-OUT NAS MARKET BY DEPLOYMENT MODEL (USD BILLION) 2020-2029
TABLE 78 SOUTH KOREA SCALE-OUT NAS MARKET BY ORGANIZATION SIZE (USD BILLION) 2020-2029
TABLE 79 SOUTH KOREA SCALE-OUT NAS MARKET BY VERTICAL (USD BILLION) 2020-2029
TABLE 80 AUSTRALIA SCALE-OUT NAS MARKET BY COMPONENT (USD BILLION) 2020-2029
TABLE 81 AUSTRALIA SCALE-OUT NAS MARKET BY STORAGE TECHNOLOGY (USD BILLION) 2020-2029
TABLE 82 AUSTRALIA SCALE-OUT NAS MARKET BY DEPLOYMENT MODEL (USD BILLION) 2020-2029
TABLE 83 AUSTRALIA SCALE-OUT NAS MARKET BY ORGANIZATION SIZE (USD BILLION) 2020-2029
TABLE 84 AUSTRALIA SCALE-OUT NAS MARKET BY VERTICAL (USD BILLION) 2020-2029
TABLE 85 SOUTH-EAST ASIA SCALE-OUT NAS MARKET BY COMPONENT (USD BILLION) 2020-2029
TABLE 86 SOUTH-EAST ASIA SCALE-OUT NAS MARKET BY STORAGE TECHNOLOGY (USD BILLION) 2020-2029
TABLE 87 SOUTH-EAST ASIA SCALE-OUT NAS MARKET BY DEPLOYMENT MODEL (USD BILLION) 2020-2029
TABLE 88 SOUTH-EAST ASIA SCALE-OUT NAS MARKET BY ORGANIZATION SIZE (USD BILLION) 2020-2029
TABLE 89 SOUTH-EAST ASIA SCALE-OUT NAS MARKET BY VERTICAL (USD BILLION) 2020-2029
TABLE 90 REST OF ASIA PACIFIC SCALE-OUT NAS MARKET BY COMPONENT (USD BILLION) 2020-2029
TABLE 91 REST OF ASIA PACIFIC SCALE-OUT NAS MARKET BY STORAGE TECHNOLOGY (USD BILLION) 2020-2029
TABLE 92 REST OF ASIA PACIFIC SCALE-OUT NAS MARKET BY DEPLOYMENT MODEL (USD BILLION) 2020-2029
TABLE 93 REST OF ASIA PACIFIC SCALE-OUT NAS MARKET BY ORGANIZATION SIZE (USD BILLION) 2020-2029
TABLE 94 REST OF ASIA PACIFIC SCALE-OUT NAS MARKET BY VERTICAL (USD BILLION) 2020-2029
TABLE 95 EUROPE SCALE-OUT NAS MARKET BY COUNTRY (USD BILLION) 2020-2029
TABLE 96 EUROPE SCALE-OUT NAS MARKET BY COMPONENT (USD BILLION) 2020-2029
TABLE 97 EUROPE SCALE-OUT NAS MARKET BY STORAGE TECHNOLOGY (USD BILLION) 2020-2029
TABLE 98 EUROPE SCALE-OUT NAS MARKET BY DEPLOYMENT MODEL (USD BILLION) 2020-2029
TABLE 99 EUROPE SCALE-OUT NAS MARKET BY ORGANIZATION SIZE (USD BILLION) 2020-2029
TABLE 100 EUROPE SCALE-OUT NAS MARKET BY VERTICAL (USD BILLION) 2020-2029
TABLE 101 GERMANY SCALE-OUT NAS MARKET BY COMPONENT (USD BILLION) 2020-2029
TABLE 102 GERMANY SCALE-OUT NAS MARKET BY STORAGE TECHNOLOGY (USD BILLION) 2020-2029
TABLE 103 GERMANY SCALE-OUT NAS MARKET BY DEPLOYMENT MODEL (USD BILLION) 2020-2029
TABLE 104 GERMANY SCALE-OUT NAS MARKET BY ORGANIZATION SIZE (USD BILLION) 2020-2029
TABLE 105 GERMANY SCALE-OUT NAS MARKET BY VERTICAL (USD BILLION) 2020-2029
TABLE 106 UK SCALE-OUT NAS MARKET BY COMPONENT (USD BILLION) 2020-2029
TABLE 107 UK SCALE-OUT NAS MARKET BY STORAGE TECHNOLOGY (USD BILLION) 2020-2029
TABLE 108 UK SCALE-OUT NAS MARKET BY DEPLOYMENT MODEL (USD BILLION) 2020-2029
TABLE 109 UK SCALE-OUT NAS MARKET BY ORGANIZATION SIZE (USD BILLION) 2020-2029
TABLE 110 UK SCALE-OUT NAS MARKET BY VERTICAL (USD BILLION) 2020-2029
TABLE 111 FRANCE SCALE-OUT NAS MARKET BY COMPONENT (USD BILLION) 2020-2029
TABLE 112 FRANCE SCALE-OUT NAS MARKET BY STORAGE TECHNOLOGY (USD BILLION) 2020-2029
TABLE 113 FRANCE SCALE-OUT NAS MARKET BY DEPLOYMENT MODEL (USD BILLION) 2020-2029
TABLE 114 FRANCE SCALE-OUT NAS MARKET BY ORGANIZATION SIZE (USD BILLION) 2020-2029
TABLE 115 FRANCE SCALE-OUT NAS MARKET BY VERTICAL (USD BILLION) 2020-2029
TABLE 116 ITALY SCALE-OUT NAS MARKET BY COMPONENT (USD BILLION) 2020-2029
TABLE 117 ITALY SCALE-OUT NAS MARKET BY STORAGE TECHNOLOGY (USD BILLION) 2020-2029
TABLE 118 ITALY SCALE-OUT NAS MARKET BY DEPLOYMENT MODEL (USD BILLION) 2020-2029
TABLE 119 ITALY SCALE-OUT NAS MARKET BY ORGANIZATION SIZE (USD BILLION) 2020-2029
TABLE 120 ITALY SCALE-OUT NAS MARKET BY VERTICAL (USD BILLION) 2020-2029
TABLE 121 SPAIN SCALE-OUT NAS MARKET BY COMPONENT (USD BILLION) 2020-2029
TABLE 122 SPAIN SCALE-OUT NAS MARKET BY STORAGE TECHNOLOGY (USD BILLION) 2020-2029
TABLE 123 SPAIN SCALE-OUT NAS MARKET BY DEPLOYMENT MODEL (USD BILLION) 2020-2029
TABLE 124 SPAIN SCALE-OUT NAS MARKET BY ORGANIZATION SIZE (USD BILLION) 2020-2029
TABLE 125 SPAIN SCALE-OUT NAS MARKET BY VERTICAL (USD BILLION) 2020-2029
TABLE 126 RUSSIA SCALE-OUT NAS MARKET BY COMPONENT (USD BILLION) 2020-2029
TABLE 127 RUSSIA SCALE-OUT NAS MARKET BY STORAGE TECHNOLOGY (USD BILLION) 2020-2029
TABLE 128 RUSSIA SCALE-OUT NAS MARKET BY DEPLOYMENT MODEL (USD BILLION) 2020-2029
TABLE 129 RUSSIA SCALE-OUT NAS MARKET BY ORGANIZATION SIZE (USD BILLION) 2020-2029
TABLE 130 RUSSIA SCALE-OUT NAS MARKET BY VERTICAL (USD BILLION) 2020-2029
TABLE 131 REST OF EUROPE SCALE-OUT NAS MARKET BY COMPONENT (USD BILLION) 2020-2029
TABLE 132 REST OF EUROPE SCALE-OUT NAS MARKET BY STORAGE TECHNOLOGY (USD BILLION) 2020-2029
TABLE 133 REST OF EUROPE SCALE-OUT NAS MARKET BY DEPLOYMENT MODEL (USD BILLION) 2020-2029
TABLE 134 REST OF EUROPE SCALE-OUT NAS MARKET BY ORGANIZATION SIZE (USD BILLION) 2020-2029
TABLE 135 REST OF EUROPE SCALE-OUT NAS MARKET BY VERTICAL (USD BILLION) 2020-2029
TABLE 136 MIDDLE EAST AND AFRICA SCALE-OUT NAS MARKET BY COUNTRY (USD BILLION) 2020-2029
TABLE 137 MIDDLE EAST AND AFRICA SCALE-OUT NAS MARKET BY COMPONENT (USD BILLION) 2020-2029
TABLE 138 MIDDLE EAST AND AFRICA SCALE-OUT NAS MARKET BY STORAGE TECHNOLOGY (USD BILLION) 2020-2029
TABLE 139 MIDDLE EAST AND AFRICA SCALE-OUT NAS MARKET BY DEPLOYMENT MODEL (USD BILLION) 2020-2029
TABLE 140 MIDDLE EAST AND AFRICA SCALE-OUT NAS MARKET BY ORGANIZATION SIZE (USD BILLION) 2020-2029
TABLE 141 MIDDLE EAST AND AFRICA SCALE-OUT NAS MARKET BY VERTICAL (USD BILLION) 2020-2029
TABLE 142 UAE SCALE-OUT NAS MARKET BY COMPONENT (USD BILLION) 2020-2029
TABLE 143 UAE SCALE-OUT NAS MARKET BY STORAGE TECHNOLOGY (USD BILLION) 2020-2029
TABLE 144 UAE SCALE-OUT NAS MARKET BY DEPLOYMENT MODEL (USD BILLION) 2020-2029
TABLE 145 UAE SCALE-OUT NAS MARKET BY ORGANIZATION SIZE (USD BILLION) 2020-2029
TABLE 146 UAE SCALE-OUT NAS MARKET BY VERTICAL (USD BILLION) 2020-2029
TABLE 147 SAUDI ARABIA SCALE-OUT NAS MARKET BY COMPONENT (USD BILLION) 2020-2029
TABLE 148 SAUDI ARABIA SCALE-OUT NAS MARKET BY STORAGE TECHNOLOGY (USD BILLION) 2020-2029
TABLE 149 SAUDI ARABIA SCALE-OUT NAS MARKET BY DEPLOYMENT MODEL (USD BILLION) 2020-2029
TABLE 150 SAUDI ARABIA SCALE-OUT NAS MARKET BY ORGANIZATION SIZE (USD BILLION) 2020-2029
TABLE 151 SAUDI ARABIA SCALE-OUT NAS MARKET BY VERTICAL (USD BILLION) 2020-2029
TABLE 152 SOUTH AFRICA SCALE-OUT NAS MARKET BY COMPONENT (USD BILLION) 2020-2029
TABLE 153 SOUTH AFRICA SCALE-OUT NAS MARKET BY STORAGE TECHNOLOGY (USD BILLION) 2020-2029
TABLE 154 SOUTH AFRICA SCALE-OUT NAS MARKET BY DEPLOYMENT MODEL (USD BILLION) 2020-2029
TABLE 155 SOUTH AFRICA SCALE-OUT NAS MARKET BY ORGANIZATION SIZE (USD BILLION) 2020-2029
TABLE 156 SOUTH AFRICA SCALE-OUT NAS MARKET BY VERTICAL (USD BILLION) 2020-2029
TABLE 157 REST OF MIDDLE EAST AND AFRICA SCALE-OUT NAS MARKET BY COMPONENT (USD BILLION) 2020-2029
TABLE 158 REST OF MIDDLE EAST AND AFRICA SCALE-OUT NAS MARKET BY STORAGE TECHNOLOGY (USD BILLION) 2020-2029
TABLE 159 REST OF MIDDLE EAST AND AFRICA SCALE-OUT NAS MARKET BY DEPLOYMENT MODEL (USD BILLION) 2020-2029
TABLE 160 REST OF MIDDLE EAST AND AFRICA SCALE-OUT NAS MARKET BY ORGANIZATION SIZE (USD BILLION) 2020-2029
TABLE 161 REST OF MIDDLE EAST AND AFRICA SCALE-OUT NAS MARKET BY VERTICAL (USD BILLION) 2020-2029
LIST OF FIGURES
FIGURE 1 MARKET DYNAMICS
FIGURE 2 REPORT TIMELINES: YEARS CONSIDERED
FIGURE 3 BOTTOM-UP APPROACH
FIGURE 4 RESEARCH FLOW
FIGURE 5 GLOBAL SCALE-OUT NAS MARKET BY COMPONENT, USD BILLION, 2020-2029
FIGURE 6 GLOBAL SCALE-OUT NAS MARKET BY STORAGE TECHNOLOGY, USD BILLION, 2020-2029
FIGURE 7 GLOBAL SCALE-OUT NAS MARKET BY DEPLOYMENT MODEL, USD BILLION, 2020-2029
FIGURE 8 GLOBAL SCALE-OUT NAS MARKET BY ORGANIZATION SIZE, USD BILLION, 2020-2029
FIGURE 9 GLOBAL SCALE-OUT NAS MARKET BY VERTICAL, USD BILLION, 2020-2029
FIGURE 19 GLOBAL SCALE-OUT NAS MARKET BY REGION, USD BILLION, 2020-2029
FIGURE 11 PORTER’S FIVE FORCES MODEL
FIGURE 12 GLOBAL SCALE-OUT NAS MARKET BY COMPONENT, USD BILLION, 2021
FIGURE 13 GLOBAL SCALE-OUT NAS MARKET BY STORAGE TECHNOLOGY, USD BILLION, 2021
FIGURE 14 GLOBAL SCALE-OUT NAS MARKET BY DEPLOYMENT MODEL, USD BILLION, 2021
FIGURE 15 GLOBAL SCALE-OUT NAS MARKET BY ORGANIZATION SIZE, USD BILLION, 2021
FIGURE 16 GLOBAL SCALE-OUT NAS MARKET BY VERTICAL, USD BILLION, 2021
FIGURE 17 GLOBAL SCALE-OUT NAS MARKET BY REGION, USD BILLION, 2021
FIGURE 18 MARKET SHARE ANALYSIS
FIGURE 19 DELL TECHNOLOGIES INC.: COMPANY SNAPSHOT
FIGURE 20 HEWLETT PACKARD ENTERPRISE DEVELOPMENT LP: COMPANY SNAPSHOT
FIGURE 21 IBM CORPORATION: COMPANY SNAPSHOT
FIGURE 22 HITACHI VANTARA CORPORATION: COMPANY SNAPSHOT
FIGURE 23 PURE STORAGE, INC.: COMPANY SNAPSHOT
FIGURE 24 NETAPP, INC.: COMPANY SNAPSHOT
FIGURE 25 FUJITSU LIMITED: COMPANY SNAPSHOT
FIGURE 26 QUMULO, INC.: COMPANY SNAPSHOT
FIGURE 27 NUTANIX, INC.: COMPANY SNAPSHOT
FIGURE 28 PANASAS, INC.: COMPANY SNAPSHOT
DOWNLOAD FREE SAMPLE REPORT
License Type
SPEAK WITH OUR ANALYST
Want to know more about the report or any specific requirement?
WANT TO CUSTOMIZE THE REPORT?
Our Clients Speak
We asked them to research ‘ Equipment market’ all over the world, and their whole arrangement was helpful to us. thehealthanalytics.com insightful analysis and reports contributed to our current analysis and in creating a future strategy. Besides, the te
Yosuke Mitsui
Senior Associate Construction Equipment Sales & Marketing
We asked them to research ‘Equipment market’ all over the world, and their whole arrangement was helpful to us. thehealthanalytics.com insightful analysis and reports contributed to our current analysis and in creating a future strategy. Besides, the te


