

Base Year Value ()
x.x %
x.x %
CAGR ()
x.x %
x.x %
Forecast Year Value ()
x.x %
x.x %
Historical Data Period
Largest Region
Forecast Period
Marché des engrenages automobiles par type de produit (planétaire, conique, crémaillère et pignon, hypoïde, vis sans fin, hélicoïdal), par matériau (métallique, non métallique), par type de véhicule (voitures particulières, véhicules utilitaires légers, véhicules utilitaires lourds), par application (transmission, différentiel, système de direction, autre) et région, tendances mondiales et prévisions de 2022 à 2029
Instant access to hundreds of data points and trends
- Market estimates from 2014-2029
- Competitive analysis, industry segmentation, financial benchmarks
- Incorporates SWOT, Porter's Five Forces and risk management frameworks
- PDF report or online database with Word, Excel and PowerPoint export options
- 100% money back guarantee
Aperçu du marché des engrenages automobiles
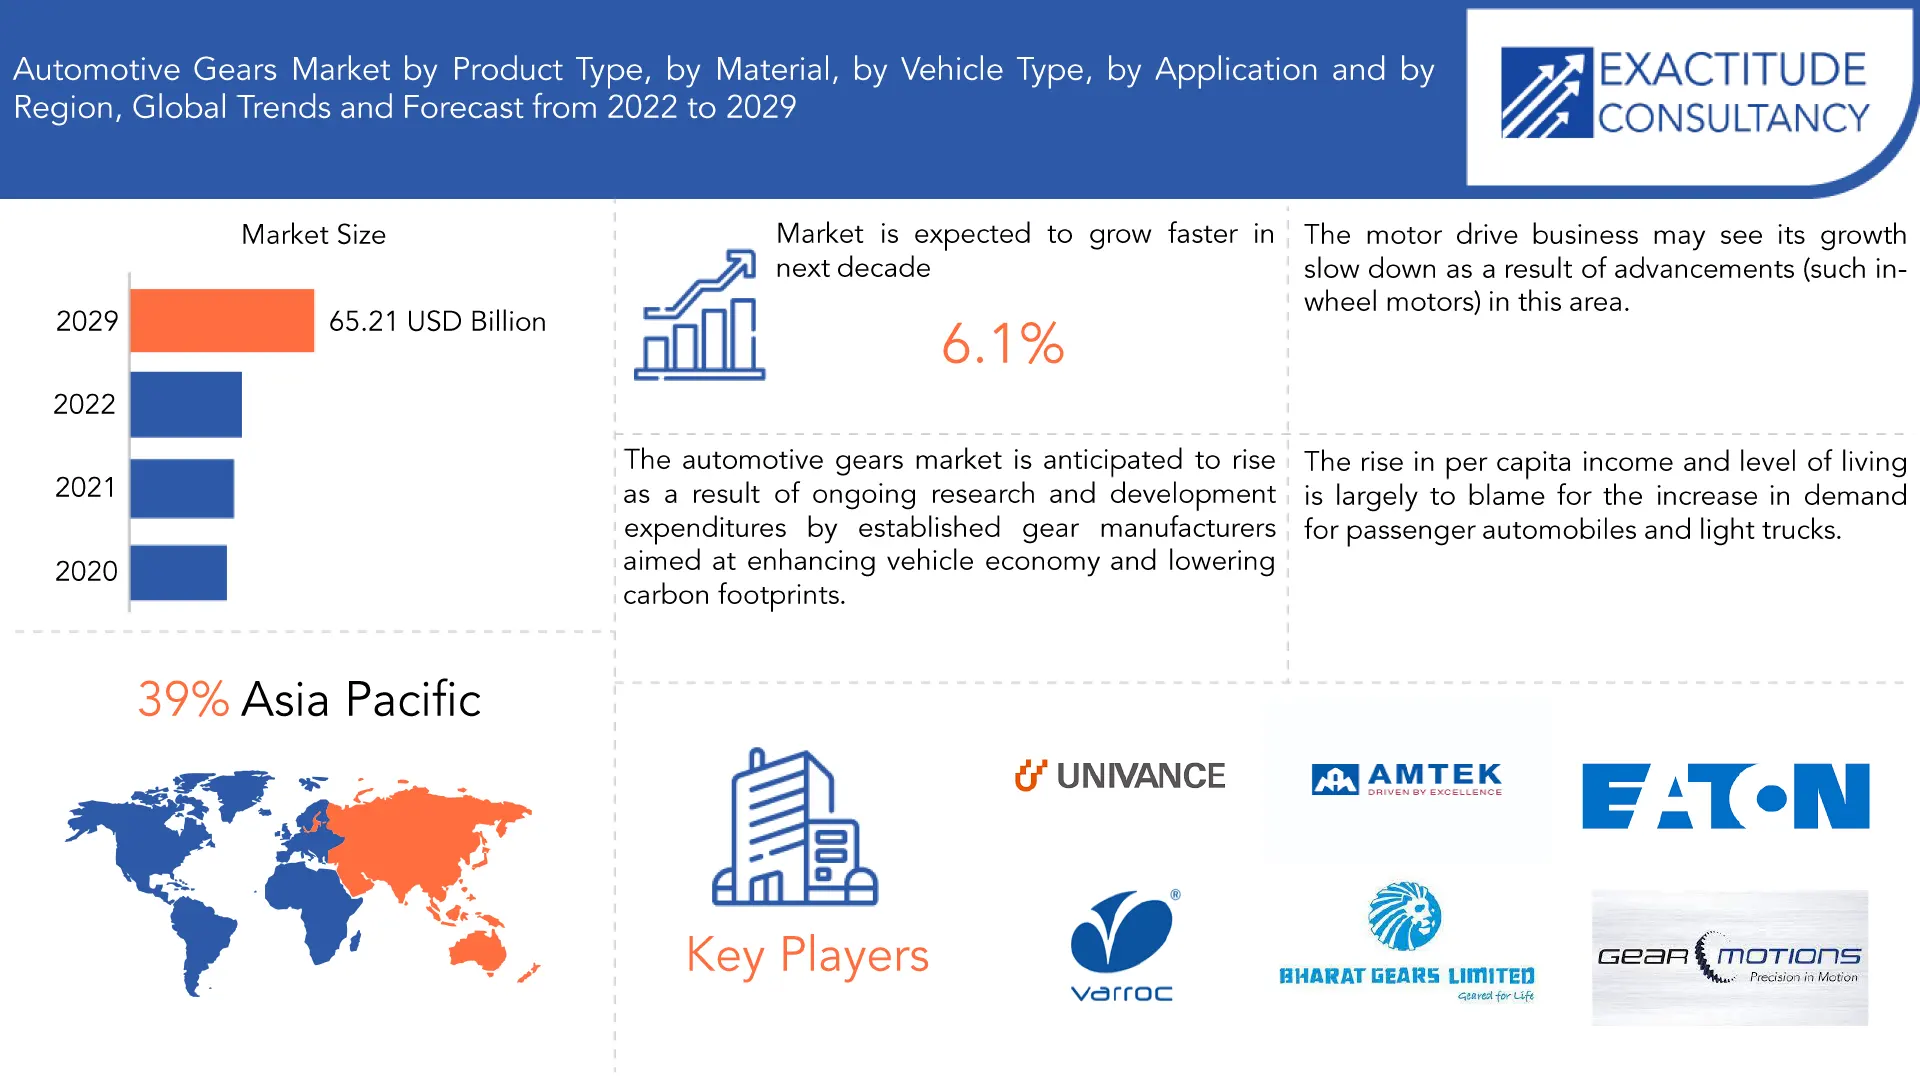
Le marché des engrenages automobiles devrait croître à un TCAC de 6,1 % de 2022 à 2029. Il devrait atteindre plus de 65,21 milliards USD d'ici 2029, contre 38,27 milliards USD en 2020.
Les engrenages d'une machine rotative sont constitués de dents coupantes. Le couple, la vitesse et le sens de l'alimentation électrique peuvent tous être modifiés via des dispositifs à engrenages. Ces systèmes modifient le couple pour produire un avantage mécanique grâce au rapport de démultiplication. Le terme « transmission par engrenages » fait référence à un ensemble de deux ou plusieurs engrenages engrenés fonctionnant dans un ordre spécifique. Les systèmes des automobiles contiennent de nombreux engrenages. Les ventes de véhicules ont un impact direct sur l'expansion du marché des engrenages. La transition de l'industrie automobile vers des systèmes plus coûteux et plus économes en énergie, tels que les boîtes de vitesses automatiques à sept et huit rapports, est un autre facteur de croissance du marché. Néanmoins, plusieurs raisons, telles que la demande croissante de véhicules électriques, freinent l'expansion de l'industrie des engrenages en raison de l'amélioration continue des lois sur la pollution. Les engrenages ne sont pas fréquemment utilisés dans les véhicules électriques .
[caption id="attachment_27462" align="aligncenter" width="1920"]
Le nombre total d'engrenages utilisés est considérablement réduit en raison du nombre réduit de systèmes de transmission, de différentiels et de boîtes de vitesses presque inexistantes. De plus, deux variables qui alimentent l'expansion du marché sont le besoin croissant d'automobiles économes en carburant et de composants automobiles légers . En outre, les perspectives du marché des engrenages automobiles devraient être favorables à mesure que les industries automobiles se développent dans les pays en développement comme le Brésil et l'Inde. Le rythme de croissance du marché serait freiné par les coûts élevés des engrenages automobiles. Le marché des engrenages automobiles est sérieusement menacé par la demande et la production croissantes de véhicules électriques. Le développement de transmissions entièrement automatiques constituera une fois de plus un obstacle important à l'expansion du marché.
Vehicle production and sales have increased globally, which is what is primarily driving the global automotive gear industry. The industry is also expanding as a result of rising sales of commercial vehicles like trucks, tractors, and trailers. Aluminum and composite gears are anticipated to experience significant market growth and increase in popularity over the course of the forecast period. One of the most rapidly expanding developments in the automotive industry is the requirement for automatic transmission, which has raised the demand for automotive equipment. During the forecast period, the market is expected to grow due to the development of plastic gears reinforced with carbon fibre.
Lockdowns were enacted in most of the impacted countries as a result of the WHO's coronavirus pandemic proclamation. Industry participants have been forced to permit their personnel to operate remotely and virtually as a result of the stringent constraints that international government authorities have placed. The widespread growth of the worldwide automotive gear market is anticipated to be supported by the adoption of automated developed technologies to reduce human interaction in areas like manufacturing and production facilities throughout the forecast period, which will finish in 2030. The broad application of technologies, such as automatic machinery and cutting-edge electronics in the automotive industry, has ensured the ongoing operation of firms during the epidemic and increased job efficiency.
| ATTRIBUTE | DETAILS |
| Study period | 2020-2029 |
| Base year | 2021 |
| Estimated year | 2022 |
| Forecasted year | 2022-2029 |
| Historical period | 2018-2020 |
| Unit | Value (USD Billion), (Thousand Units) |
| Segmentation | By Product Type, By Material, By Vehicle Type, By Application, By Region |
| By Product Type |
|
| By Material |
|
| By Vehicle Type |
|
| By Application |
|
| By Region |
|
Frequently Asked Questions
•What is the worth of automotive gears market?
The automotive gears market is expected to grow at 6.1% CAGR from 2022 to 2029. It is expected to reach above USD 65.21 Billion by 2029 from USD 38.27 Billion in 2020.
•What is the size of the asia pacific in automotive gears market?
Asia Pacific held more than 39% of the automotive gears market revenue share in 2021 and will witness expansion in the forecast period.
•What are some of the automotive gears market's driving forces?
An increase in the level of globalization and the demand for high-quality gears as a result of intensifying global rivalry are also anticipated to foster foreign direct investment, which is predicted to boost employment in the technological sector and fuel the market's expansion.
•Which are the top companies to hold the market share in automotive gears market?
The market research report covers the analysis of market players. Key companies profiled in the report include JATCO Ltd, NORD, Amtek International, Bharat Gears Ltd., Eaton, Gear Motions, Mahindra CIE, RENOLD, Varroc Group, Univance Corporation
•Which is the largest regional market for automotive gears market?
Asia-Pacific (APAC), with China and India as the two biggest markets there, is anticipated to be the world's largest market for automotive gears throughout the projection period. The growing demand for personal transportation cars and the rising standard of life are the primary factors driving the APAC automotive gears market.
Automotive Gears Market Segment Analysis
Automotive gears market is segmented based on product type, material, vehicle type, application, and region.
Based on product type, a significant portion of the market was made up of planetary. Speed reducers are made of planetary gears. They are utilized to boost torque while slowing down engines. Since planetary gears are smaller than other types of gearboxes, they are typically used in circumstances where space is limited.
Based on material, a significant portion of the market was made up of non-metallic. Due to their low modulus of elasticity, which is roughly 100 times lower than that of metal gears, non-metallic gears are more flexible than metallic gears. As a result, the actual contact ratio for non-metallic gears is larger than the optimum value.
Based on vehicle type, a significant portion of the market was made up of passenger cars. Some of the factors driving the expansion of the passenger cars automotive gears segment globally include an increase in demand for innovative features, an improvement in standard of life, and an increase in individual per capita income.
Based on application, a significant portion of the market was made up of transmission. The transmission system enables the vehicle to drive at various speeds by transferring power from the engine to the wheels. Due to their comfort and simplicity of use, automatic transmissions are becoming more and more popular.
[caption id="attachment_27466" align="aligncenter" width="1920"]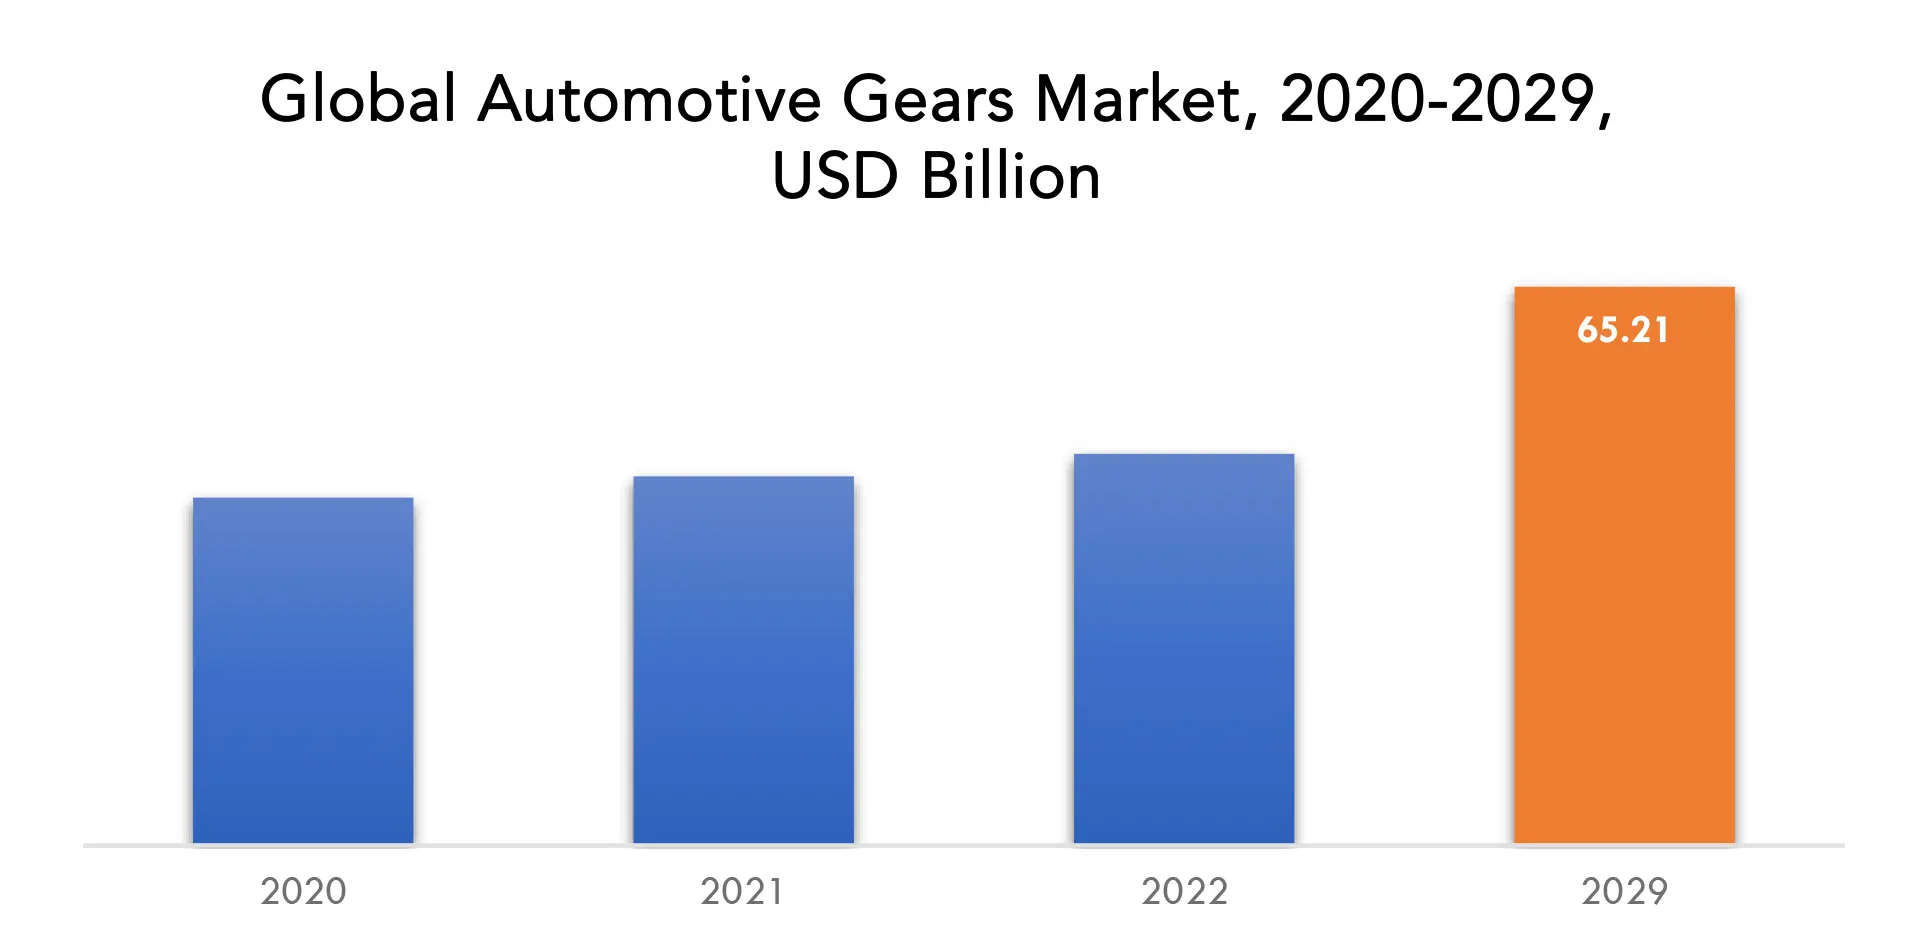
Automotive Gears Market Players
The market research report covers the analysis of market players. Key companies profiled in the report include JATCO Ltd, NORD, Amtek International, Bharat Gears Ltd., Eaton, Gear Motions, Mahindra CIE, RENOLD, Varroc Group, Univance Corporation. Recent Developments:- On June 2021, JATCO Ltd has developed a new continuously variable transmission (CVT) for medium to large FWD vehicles that brings a leap in environmental performance and drivability, the “Jatco CVT-X” (JF022E) (hereinafter CVT-X).
- On August 2021, NORD offers flexible drive solutions for bucket elevators, as well as screw, drag, and belt conveyors. These solutions are engineered to provide high load capacities with power up to 8000 HP and a gear ratio range from 6 to 1600:1
Who Should Buy? Or Key Stakeholders
- Manufacturers of automotive gear systems
- Dealers and distributors of automotive gear systems
- Industry associations
- Investment firms
- Equity research firms
- Private equity firms
- Others
Automotive Gears Market Regional Analysis
The automotive gears market by region includes North America, Asia-Pacific (APAC), Europe, South America, And Middle East & Africa (MEA).
- North America: includes the US, Canada, Mexico
- Asia Pacific: includes China, Japan, South Korea, India, Australia, ASEAN, and Rest of APAC
- Europe: includes UK, Germany, France, Italy, Spain, Russia, and Rest of Europe
- South America: includes Brazil, Argentina, and Rest of South America
- Middle East & Africa: includes Turkey, UAE, Saudi Arabia, South Africa, and Rest of MEA
In terms of revenue, asia pacific dominated the automotive gears market in 2021 with a 39% share. Globe, with China significantly contributing to the growth of the industry in the area. Future automobile production in countries like China and India, as well as manufacturers' emphasis on increasing their production capacity, are likely to result in a major increase in demand for automotive equipment. For instance, Due IC vehicles still make up the majority of the country's automotive market, some newspapers have claimed that China intends to sell 80 million IC engines annually in the next years. Also, the desire for fuel-efficient vehicles and lightweight automotive components is driving growth in the Asia Pacific market. As a result, it is projected that over the projection period, demand would rise for lightweight, incredibly durable aluminium and composite gears.
[caption id="attachment_27467" align="aligncenter" width="1920"]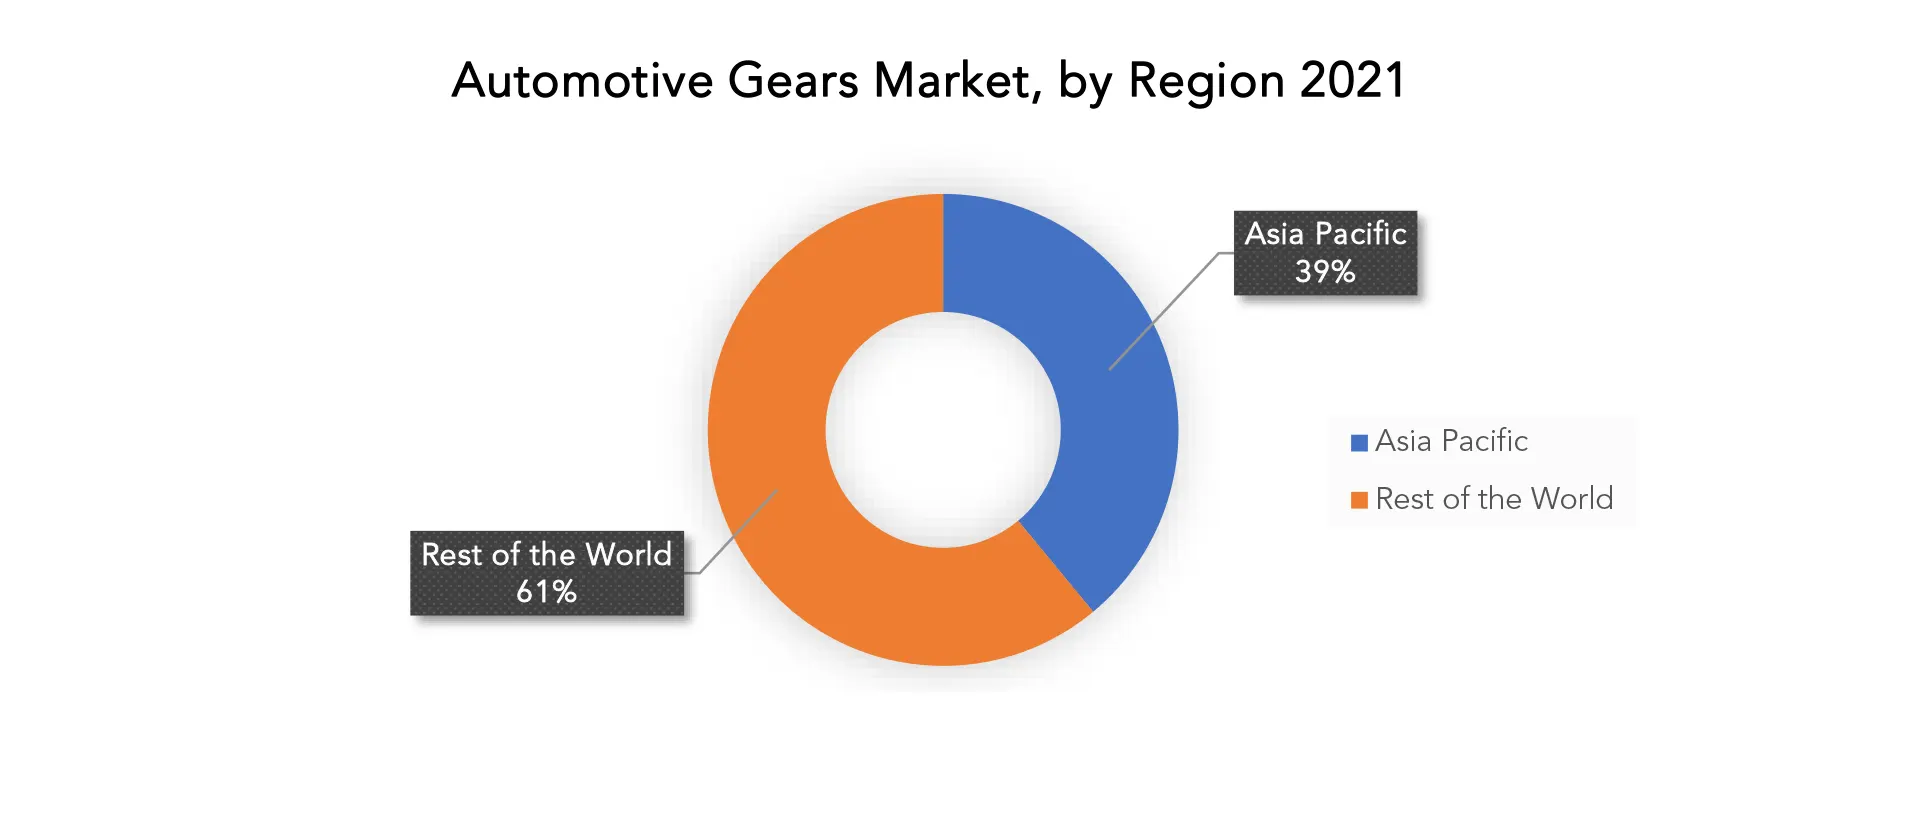
Key Market Segments: Automotive Gears Market
Automotive Gears Market By Product Type, 2020-2029, (USD Billion), (Thousand Units).- Planetary
- Bevel
- Rack & Pinion
- Hypoid
- Worm
- Helical
- Metallic
- Non-Metallic
- Passengers Cars
- Light Commercial Vehicles
- Heavy Commercial Vehicles
- Transmission
- Differential
- Steering System
- Other
- North America
- Asia Pacific
- Europe
- South America
- Middle East And Africa
Exactitude Consultancy Services Key Objectives
- Increasing sales and Market share
- Developing new technology
- Improving profitability
- Entering new markets
- Enhancing brand reputation
Key Question Answered
- What is the expected growth rate of the automotive gears market over the next 7 years?
- Who are the major players in the automotive gears market and what is their market share?
- What are the construction type industries driving demand for market and what is their outlook?
- What are the opportunities for growth in emerging markets such as Asia-Pacific, Middle East, And Africa?
- How is the economic environment affecting the automotive gears market, including factors such as interest rates, inflation, and exchange rates?
- What is the expected impact of government policies and regulations on the automotive gears market?
- What is the current and forecasted size and growth rate of the global automotive gears market?
- What are the key drivers of growth in the automotive gears market?
- Who are the major players in the market and what is their market share?
- What are the distribution channels and supply chain dynamics in the automotive gears market?
- What are the technological advancements and innovations in the automotive gears market and their impact on composite development and growth?
- What are the regulatory considerations and their impact on the market?
- What are the challenges faced by players in the automotive gears market and how are they addressing these challenges?
- What are the opportunities for growth and expansion in the automotive gears market?
- What are the products offerings and specifications of leading players in the market?
- INTRODUCTION
- MARKET DEFINITION
- MARKET SEGMENTATION
- RESEARCH TIMELINES
- ASSUMPTIONS AND LIMITATIONS
- RESEARCH METHODOLOGY
- DATA MINING
- SECONDARY RESEARCH
- PRIMARY RESEARCH
- SUBJECT-MATTER EXPERTS’ ADVICE
- QUALITY CHECKS
- FINAL REVIEW
- DATA TRIANGULATION
- BOTTOM-UP APPROACH
- TOP-DOWN APPROACH
- RESEARCH FLOW
- DATA SOURCES
- DATA MINING
- EXECUTIVE SUMMARY
- MARKET OVERVIEW
- GLOBAL AUTOMOTIVE GEARS MARKET OUTLOOK
- MARKET DRIVERS
- MARKET RESTRAINTS
- MARKET OPPORTUNITIES
- IMPACT OF COVID-19 ON AUTOMOTIVE GEARS MARKET
- PORTER’S FIVE FORCES MODEL
- THREAT FROM NEW ENTRANTS
- THREAT FROM SUBSTITUTES
- BARGAINING POWER OF SUPPLIERS
- BARGAINING POWER OF CUSTOMERS
- DEGREE OF COMPETITION
- INDUSTRY VALUE CHAIN ANALYSIS
- GLOBAL AUTOMOTIVE GEARS MARKET OUTLOOK
- GLOBAL AUTOMOTIVE GEARS MARKET BY PRODUCT TYPE, (USD BILLION), (THOUSAND UNITS), 2020-2029
- PLANETARY
- BEVEL
- RACK & PINION
- HYPOID
- WORM
- HELICAL
- GLOBAL AUTOMOTIVE GEARS MARKET BY MATERIAL, (USD BILLION), (THOUSAND UNITS), 2020-2029
- METALLIC
- NON-METALLIC
- GLOBAL AUTOMOTIVE GEARS MARKET BY VEHICLE TYPE, (USD BILLION), (THOUSAND UNITS), 2020-2029
- PASSENGERS CARS
- LIGHT COMMERCIAL VEHICLES
- HEAVY COMMERCIAL VEHICLES
- GLOBAL AUTOMOTIVE GEARS MARKET BY APPLICATION, (USD BILLION), (THOUSAND UNITS), 2020-2029
- TRANSMISSION
- DIFFERENTIAL
- STEERING SYSTEM
- OTHER
- GLOBAL AUTOMOTIVE GEARS MARKET BY REGION, (USD BILLION), (THOUSAND UNITS), 2020-2029
- NORTH AMERICA
- US
- CANADA
- MEXICO
- SOUTH AMERICA
- BRAZIL
- ARGENTINA
- COLOMBIA
- REST OF SOUTH AMERICA
- EUROPE
- GERMANY
- UK
- FRANCE
- ITALY
- SPAIN
- RUSSIA
- REST OF EUROPE
- ASIA PACIFIC
- INDIA
- CHINA
- JAPAN
- SOUTH KOREA
- AUSTRALIA
- SOUTH-EAST ASIA
- REST OF ASIA PACIFIC
- MIDDLE EAST AND AFRICA
- UAE
- SAUDI ARABIA
- SOUTH AFRICA
- REST OF MIDDLE EAST AND AFRICA
- NORTH AMERICA
- COMPANY PROFILES* (BUSINESS OVERVIEW, COMPANY SNAPSHOT, PRODUCTS OFFERED, RECENT DEVELOPMENTS)
- JATCO LTD
- NORD
- AMTEK INTERNATIONAL
- BHARAT GEARS LTD.
- EATON
- GEAR MOTIONS
- MAHINDRA CIE
- RENOLD
- VARROC GROUP
- UNIVANCE CORPORATION *THE COMPANY LIST IS INDICATIVE
LIST OF TABLES
TABLE 1 GLOBAL AUTOMOTIVE GEARS MARKET BY PRODUCT TYPE (USD BILLION) 2020-2029
TABLE 2 GLOBAL AUTOMOTIVE GEARS MARKET BY PRODUCT TYPE (THOUSAND UNITS) 2020-2029
TABLE 3 GLOBAL AUTOMOTIVE GEARS MARKET BY MATERIAL (USD BILLION) 2020-2029
TABLE 4 GLOBAL AUTOMOTIVE GEARS MARKET BY MATERIAL (THOUSAND UNITS) 2020-2029
TABLE 5 GLOBAL AUTOMOTIVE GEARS MARKET BY VEHICLE TYPE (USD BILLION) 2020-2029
TABLE 6 GLOBAL AUTOMOTIVE GEARS MARKET BY VEHICLE TYPE (THOUSAND UNITS) 2020-2029
TABLE 7 GLOBAL AUTOMOTIVE GEARS MARKET BY APPLICATION (USD BILLION) 2020-2029
TABLE 8 GLOBAL AUTOMOTIVE GEARS MARKET BY APPLICATION (THOUSAND UNITS) 2020-2029
TABLE 9 GLOBAL AUTOMOTIVE GEARS MARKET BY REGION (USD BILLION) 2020-2029
TABLE 10 GLOBAL AUTOMOTIVE GEARS MARKET BY REGION (THOUSAND UNITS) 2020-2029
TABLE 11 NORTH AMERICA AUTOMOTIVE GEARS MARKET BY COUNTRY (USD BILLION) 2020-2029
TABLE 12 NORTH AMERICA AUTOMOTIVE GEARS MARKET BY COUNTRY (THOUSAND UNITS) 2020-2029
TABLE 13 NORTH AMERICA AUTOMOTIVE GEARS MARKET BY PRODUCT TYPE (USD BILLION) 2020-2029
TABLE 14 NORTH AMERICA AUTOMOTIVE GEARS MARKET BY PRODUCT TYPE (THOUSAND UNITS) 2020-2029
TABLE 15 NORTH AMERICA AUTOMOTIVE GEARS MARKET BY MATERIAL (USD BILLION) 2020-2029
TABLE 16 NORTH AMERICA AUTOMOTIVE GEARS MARKET BY MATERIAL (THOUSAND UNITS) 2020-2029
TABLE 17 NORTH AMERICA AUTOMOTIVE GEARS MARKET BY VEHICLE TYPE (USD BILLION) 2020-2029
TABLE 18 NORTH AMERICA AUTOMOTIVE GEARS MARKET BY VEHICLE TYPE (THOUSAND UNITS) 2020-2029
TABLE 19 NORTH AMERICA AUTOMOTIVE GEARS MARKET BY APPLICATION (USD BILLION) 2020-2029
TABLE 20 NORTH AMERICA AUTOMOTIVE GEARS MARKET BY APPLICATION (THOUSAND UNITS) 2020-2029
TABLE 21 US AUTOMOTIVE GEARS MARKET BY PRODUCT TYPE (USD BILLION) 2020-2029
TABLE 22 US AUTOMOTIVE GEARS MARKET BY PRODUCT TYPE (THOUSAND UNITS) 2020-2029
TABLE 23 US AUTOMOTIVE GEARS MARKET BY MATERIAL (USD BILLION) 2020-2029
TABLE 24 US AUTOMOTIVE GEARS MARKET BY MATERIAL (THOUSAND UNITS) 2020-2029
TABLE 25 US AUTOMOTIVE GEARS MARKET BY VEHICLE TYPE (USD BILLION) 2020-2029
TABLE 26 US AUTOMOTIVE GEARS MARKET BY VEHICLE TYPE (THOUSAND UNITS) 2020-2029
TABLE 27 US AUTOMOTIVE GEARS MARKET BY APPLICATION (USD BILLION) 2020-2029
TABLE 28 US AUTOMOTIVE GEARS MARKET BY APPLICATION (THOUSAND UNITS) 2020-2029
TABLE 29 CANADA AUTOMOTIVE GEARS MARKET BY PRODUCT TYPE (USD BILLION) 2020-2029
TABLE 30 CANADA AUTOMOTIVE GEARS MARKET BY PRODUCT TYPE (THOUSAND UNITS) 2020-2029
TABLE 31 CANADA AUTOMOTIVE GEARS MARKET BY MATERIAL (USD BILLION) 2020-2029
TABLE 32 CANADA AUTOMOTIVE GEARS MARKET BY MATERIAL (THOUSAND UNITS) 2020-2029
TABLE 33 CANADA AUTOMOTIVE GEARS MARKET BY VEHICLE TYPE (USD BILLION) 2020-2029
TABLE 34 CANADA AUTOMOTIVE GEARS MARKET BY VEHICLE TYPE (THOUSAND UNITS) 2020-2029
TABLE 35 CANADA AUTOMOTIVE GEARS MARKET BY APPLICATION (USD BILLION) 2020-2029
TABLE 36 CANADA AUTOMOTIVE GEARS MARKET BY APPLICATION (THOUSAND UNITS) 2020-2029
TABLE 37 MEXICO AUTOMOTIVE GEARS MARKET BY PRODUCT TYPE (USD BILLION) 2020-2029
TABLE 38 MEXICO AUTOMOTIVE GEARS MARKET BY PRODUCT TYPE (THOUSAND UNITS) 2020-2029
TABLE 39 MEXICO AUTOMOTIVE GEARS MARKET BY MATERIAL (USD BILLION) 2020-2029
TABLE 40 MEXICO AUTOMOTIVE GEARS MARKET BY MATERIAL (THOUSAND UNITS) 2020-2029
TABLE 41 MEXICO AUTOMOTIVE GEARS MARKET BY VEHICLE TYPE (USD BILLION) 2020-2029
TABLE 42 MEXICO AUTOMOTIVE GEARS MARKET BY VEHICLE TYPE (THOUSAND UNITS) 2020-2029
TABLE 43 MEXICO AUTOMOTIVE GEARS MARKET BY APPLICATION (USD BILLION) 2020-2029
TABLE 44 MEXICO AUTOMOTIVE GEARS MARKET BY APPLICATION (THOUSAND UNITS) 2020-2029
TABLE 45 SOUTH AMERICA AUTOMOTIVE GEARS MARKET BY COUNTRY (USD BILLION) 2020-2029
TABLE 46 SOUTH AMERICA AUTOMOTIVE GEARS MARKET BY COUNTRY (THOUSAND UNITS) 2020-2029
TABLE 47 SOUTH AMERICA AUTOMOTIVE GEARS MARKET BY PRODUCT TYPE (USD BILLION) 2020-2029
TABLE 48 SOUTH AMERICA AUTOMOTIVE GEARS MARKET BY PRODUCT TYPE (THOUSAND UNITS) 2020-2029
TABLE 49 SOUTH AMERICA AUTOMOTIVE GEARS MARKET BY MATERIAL (USD BILLION) 2020-2029
TABLE 50 SOUTH AMERICA AUTOMOTIVE GEARS MARKET BY MATERIAL (THOUSAND UNITS) 2020-2029
TABLE 51 SOUTH AMERICA AUTOMOTIVE GEARS MARKET BY VEHICLE TYPE (USD BILLION) 2020-2029
TABLE 52 SOUTH AMERICA AUTOMOTIVE GEARS MARKET BY VEHICLE TYPE (THOUSAND UNITS) 2020-2029
TABLE 53 SOUTH AMERICA AUTOMOTIVE GEARS MARKET BY APPLICATION (USD BILLION) 2020-2029
TABLE 54 SOUTH AMERICA AUTOMOTIVE GEARS MARKET BY APPLICATION (THOUSAND UNITS) 2020-2029
TABLE 55 BRAZIL AUTOMOTIVE GEARS MARKET BY PRODUCT TYPE (USD BILLION) 2020-2029
TABLE 56 BRAZIL AUTOMOTIVE GEARS MARKET BY PRODUCT TYPE (THOUSAND UNITS) 2020-2029
TABLE 57 BRAZIL AUTOMOTIVE GEARS MARKET BY MATERIAL (USD BILLION) 2020-2029
TABLE 58 BRAZIL AUTOMOTIVE GEARS MARKET BY MATERIAL (THOUSAND UNITS) 2020-2029
TABLE 59 BRAZIL AUTOMOTIVE GEARS MARKET BY VEHICLE TYPE (USD BILLION) 2020-2029
TABLE 60 BRAZIL AUTOMOTIVE GEARS MARKET BY VEHICLE TYPE (THOUSAND UNITS) 2020-2029
TABLE 61 BRAZIL AUTOMOTIVE GEARS MARKET BY APPLICATION (USD BILLION) 2020-2029
TABLE 62 BRAZIL AUTOMOTIVE GEARS MARKET BY APPLICATION (THOUSAND UNITS) 2020-2029
TABLE 63 ARGENTINA AUTOMOTIVE GEARS MARKET BY PRODUCT TYPE (USD BILLION) 2020-2029
TABLE 64 ARGENTINA AUTOMOTIVE GEARS MARKET BY PRODUCT TYPE (THOUSAND UNITS) 2020-2029
TABLE 65 ARGENTINA AUTOMOTIVE GEARS MARKET BY MATERIAL (USD BILLION) 2020-2029
TABLE 66 ARGENTINA AUTOMOTIVE GEARS MARKET BY MATERIAL (THOUSAND UNITS) 2020-2029
TABLE 67 ARGENTINA AUTOMOTIVE GEARS MARKET BY VEHICLE TYPE (USD BILLION) 2020-2029
TABLE 68 ARGENTINA AUTOMOTIVE GEARS MARKET BY VEHICLE TYPE (THOUSAND UNITS) 2020-2029
TABLE 69 ARGENTINA AUTOMOTIVE GEARS MARKET BY APPLICATION (USD BILLION) 2020-2029
TABLE 70 ARGENTINA AUTOMOTIVE GEARS MARKET BY APPLICATION (THOUSAND UNITS) 2020-2029
TABLE 71 COLOMBIA AUTOMOTIVE GEARS MARKET BY PRODUCT TYPE (USD BILLION) 2020-2029
TABLE 72 COLOMBIA AUTOMOTIVE GEARS MARKET BY PRODUCT TYPE (THOUSAND UNITS) 2020-2029
TABLE 73 COLOMBIA AUTOMOTIVE GEARS MARKET BY MATERIAL (USD BILLION) 2020-2029
TABLE 74 COLOMBIA AUTOMOTIVE GEARS MARKET BY MATERIAL (THOUSAND UNITS) 2020-2029
TABLE 75 COLOMBIA AUTOMOTIVE GEARS MARKET BY VEHICLE TYPE (USD BILLION) 2020-2029
TABLE 76 COLOMBIA AUTOMOTIVE GEARS MARKET BY VEHICLE TYPE (THOUSAND UNITS) 2020-2029
TABLE 77 COLOMBIA AUTOMOTIVE GEARS MARKET BY APPLICATION (USD BILLION) 2020-2029
TABLE 78 COLOMBIA AUTOMOTIVE GEARS MARKET BY APPLICATION (THOUSAND UNITS) 2020-2029
TABLE 79 REST OF SOUTH AMERICA AUTOMOTIVE GEARS MARKET BY PRODUCT TYPE (USD BILLION) 2020-2029
TABLE 80 REST OF SOUTH AMERICA AUTOMOTIVE GEARS MARKET BY PRODUCT TYPE (THOUSAND UNITS) 2020-2029
TABLE 81 REST OF SOUTH AMERICA AUTOMOTIVE GEARS MARKET BY MATERIAL (USD BILLION) 2020-2029
TABLE 82 REST OF SOUTH AMERICA AUTOMOTIVE GEARS MARKET BY MATERIAL (THOUSAND UNITS) 2020-2029
TABLE 83 REST OF SOUTH AMERICA AUTOMOTIVE GEARS MARKET BY VEHICLE TYPE (USD BILLION) 2020-2029
TABLE 84 REST OF SOUTH AMERICA AUTOMOTIVE GEARS MARKET BY VEHICLE TYPE (THOUSAND UNITS) 2020-2029
TABLE 85 REST OF SOUTH AMERICA AUTOMOTIVE GEARS MARKET BY APPLICATION (USD BILLION) 2020-2029
TABLE 86 REST OF SOUTH AMERICA AUTOMOTIVE GEARS MARKET BY APPLICATION (THOUSAND UNITS) 2020-2029
TABLE 87 ASIA-PACIFIC AUTOMOTIVE GEARS MARKET BY COUNTRY (USD BILLION) 2020-2029
TABLE 88 ASIA-PACIFIC AUTOMOTIVE GEARS MARKET BY COUNTRY (THOUSAND UNITS) 2020-2029
TABLE 89 ASIA-PACIFIC AUTOMOTIVE GEARS MARKET BY PRODUCT TYPE (USD BILLION) 2020-2029
TABLE 90 ASIA-PACIFIC AUTOMOTIVE GEARS MARKET BY PRODUCT TYPE (THOUSAND UNITS) 2020-2029
TABLE 91 ASIA-PACIFIC AUTOMOTIVE GEARS MARKET BY MATERIAL (USD BILLION) 2020-2029
TABLE 92 ASIA-PACIFIC AUTOMOTIVE GEARS MARKET BY MATERIAL (THOUSAND UNITS) 2020-2029
TABLE 93 ASIA-PACIFIC AUTOMOTIVE GEARS MARKET BY VEHICLE TYPE (USD BILLION) 2020-2029
TABLE 94 ASIA-PACIFIC AUTOMOTIVE GEARS MARKET BY VEHICLE TYPE (THOUSAND UNITS) 2020-2029
TABLE 95 ASIA-PACIFIC AUTOMOTIVE GEARS MARKET BY APPLICATION (USD BILLION) 2020-2029
TABLE 96 ASIA-PACIFIC AUTOMOTIVE GEARS MARKET BY APPLICATION (THOUSAND UNITS) 2020-2029
TABLE 97 INDIA AUTOMOTIVE GEARS MARKET BY PRODUCT TYPE (USD BILLION) 2020-2029
TABLE 98 INDIA AUTOMOTIVE GEARS MARKET BY PRODUCT TYPE (THOUSAND UNITS) 2020-2029
TABLE 99 INDIA AUTOMOTIVE GEARS MARKET BY MATERIAL (USD BILLION) 2020-2029
TABLE 100 INDIA AUTOMOTIVE GEARS MARKET BY MATERIAL (THOUSAND UNITS) 2020-2029
TABLE 101 INDIA AUTOMOTIVE GEARS MARKET BY VEHICLE TYPE (USD BILLION) 2020-2029
TABLE 102 INDIA AUTOMOTIVE GEARS MARKET BY VEHICLE TYPE (THOUSAND UNITS) 2020-2029
TABLE 103 INDIA AUTOMOTIVE GEARS MARKET BY APPLICATION (USD BILLION) 2020-2029
TABLE 104 INDIA AUTOMOTIVE GEARS MARKET BY APPLICATION (THOUSAND UNITS) 2020-2029
TABLE 105 CHINA AUTOMOTIVE GEARS MARKET BY PRODUCT TYPE (USD BILLION) 2020-2029
TABLE 106 CHINA AUTOMOTIVE GEARS MARKET BY PRODUCT TYPE (THOUSAND UNITS) 2020-2029
TABLE 107 CHINA AUTOMOTIVE GEARS MARKET BY MATERIAL (USD BILLION) 2020-2029
TABLE 108 CHINA AUTOMOTIVE GEARS MARKET BY MATERIAL (THOUSAND UNITS) 2020-2029
TABLE 109 CHINA AUTOMOTIVE GEARS MARKET BY VEHICLE TYPE (USD BILLION) 2020-2029
TABLE 110 CHINA AUTOMOTIVE GEARS MARKET BY VEHICLE TYPE (THOUSAND UNITS) 2020-2029
TABLE 111 CHINA AUTOMOTIVE GEARS MARKET BY APPLICATION (USD BILLION) 2020-2029
TABLE 112 CHINA AUTOMOTIVE GEARS MARKET BY APPLICATION (THOUSAND UNITS) 2020-2029
TABLE 113 JAPAN AUTOMOTIVE GEARS MARKET BY PRODUCT TYPE (USD BILLION) 2020-2029
TABLE 114 JAPAN AUTOMOTIVE GEARS MARKET BY PRODUCT TYPE (THOUSAND UNITS) 2020-2029
TABLE 115 JAPAN AUTOMOTIVE GEARS MARKET BY MATERIAL (USD BILLION) 2020-2029
TABLE 116 JAPAN AUTOMOTIVE GEARS MARKET BY MATERIAL (THOUSAND UNITS) 2020-2029
TABLE 117 JAPAN AUTOMOTIVE GEARS MARKET BY VEHICLE TYPE (USD BILLION) 2020-2029
TABLE 118 JAPAN AUTOMOTIVE GEARS MARKET BY VEHICLE TYPE (THOUSAND UNITS) 2020-2029
TABLE 119 JAPAN AUTOMOTIVE GEARS MARKET BY APPLICATION (USD BILLION) 2020-2029
TABLE 120 JAPAN AUTOMOTIVE GEARS MARKET BY APPLICATION (THOUSAND UNITS) 2020-2029
TABLE 121 SOUTH KOREA AUTOMOTIVE GEARS MARKET BY PRODUCT TYPE (USD BILLION) 2020-2029
TABLE 122 SOUTH KOREA AUTOMOTIVE GEARS MARKET BY PRODUCT TYPE (THOUSAND UNITS) 2020-2029
TABLE 123 SOUTH KOREA AUTOMOTIVE GEARS MARKET BY MATERIAL (USD BILLION) 2020-2029
TABLE 124 SOUTH KOREA AUTOMOTIVE GEARS MARKET BY MATERIAL (THOUSAND UNITS) 2020-2029
TABLE 125 SOUTH KOREA AUTOMOTIVE GEARS MARKET BY VEHICLE TYPE (USD BILLION) 2020-2029
TABLE 126 SOUTH KOREA AUTOMOTIVE GEARS MARKET BY VEHICLE TYPE (THOUSAND UNITS) 2020-2029
TABLE 127 SOUTH KOREA AUTOMOTIVE GEARS MARKET BY APPLICATION (USD BILLION) 2020-2029
TABLE 128 SOUTH KOREA AUTOMOTIVE GEARS MARKET BY APPLICATION (THOUSAND UNITS) 2020-2029
TABLE 129 AUSTRALIA AUTOMOTIVE GEARS MARKET BY PRODUCT TYPE (USD BILLION) 2020-2029
TABLE 130 AUSTRALIA AUTOMOTIVE GEARS MARKET BY PRODUCT TYPE (THOUSAND UNITS) 2020-2029
TABLE 131 AUSTRALIA AUTOMOTIVE GEARS MARKET BY MATERIAL (USD BILLION) 2020-2029
TABLE 132 AUSTRALIA AUTOMOTIVE GEARS MARKET BY MATERIAL (THOUSAND UNITS) 2020-2029
TABLE 133 AUSTRALIA AUTOMOTIVE GEARS MARKET BY VEHICLE TYPE (USD BILLION) 2020-2029
TABLE 134 AUSTRALIA AUTOMOTIVE GEARS MARKET BY VEHICLE TYPE (THOUSAND UNITS) 2020-2029
TABLE 135 AUSTRALIA AUTOMOTIVE GEARS MARKET BY APPLICATION (USD BILLION) 2020-2029
TABLE 136 AUSTRALIA AUTOMOTIVE GEARS MARKET BY APPLICATION (THOUSAND UNITS) 2020-2029
TABLE 137 SOUTH-EAST ASIA AUTOMOTIVE GEARS MARKET BY PRODUCT TYPE (USD BILLION) 2020-2029
TABLE 138 SOUTH-EAST ASIA AUTOMOTIVE GEARS MARKET BY PRODUCT TYPE (THOUSAND UNITS) 2020-2029
TABLE 139 SOUTH-EAST ASIA AUTOMOTIVE GEARS MARKET BY MATERIAL (USD BILLION) 2020-2029
TABLE 140 SOUTH-EAST ASIA AUTOMOTIVE GEARS MARKET BY MATERIAL (THOUSAND UNITS) 2020-2029
TABLE 141 SOUTH-EAST ASIA AUTOMOTIVE GEARS MARKET BY VEHICLE TYPE (USD BILLION) 2020-2029
TABLE 142 SOUTH-EAST ASIA AUTOMOTIVE GEARS MARKET BY VEHICLE TYPE (THOUSAND UNITS) 2020-2029
TABLE 143 SOUTH-EAST ASIA AUTOMOTIVE GEARS MARKET BY APPLICATION (USD BILLION) 2020-2029
TABLE 144 SOUTH-EAST ASIA AUTOMOTIVE GEARS MARKET BY APPLICATION (THOUSAND UNITS) 2020-2029
TABLE 145 REST OF ASIA PACIFIC AUTOMOTIVE GEARS MARKET BY PRODUCT TYPE (USD BILLION) 2020-2029
TABLE 146 REST OF ASIA PACIFIC AUTOMOTIVE GEARS MARKET BY PRODUCT TYPE (THOUSAND UNITS) 2020-2029
TABLE 147 REST OF ASIA PACIFIC AUTOMOTIVE GEARS MARKET BY MATERIAL (USD BILLION) 2020-2029
TABLE 148 REST OF ASIA PACIFIC AUTOMOTIVE GEARS MARKET BY MATERIAL (THOUSAND UNITS) 2020-2029
TABLE 149 REST OF ASIA PACIFIC AUTOMOTIVE GEARS MARKET BY VEHICLE TYPE (USD BILLION) 2020-2029
TABLE 150 REST OF ASIA PACIFIC AUTOMOTIVE GEARS MARKET BY VEHICLE TYPE (THOUSAND UNITS) 2020-2029
TABLE 151 REST OF ASIA PACIFIC AUTOMOTIVE GEARS MARKET BY APPLICATION (USD BILLION) 2020-2029
TABLE 152 REST OF ASIA PACIFIC AUTOMOTIVE GEARS MARKET BY APPLICATION (THOUSAND UNITS) 2020-2029
TABLE 153 EUROPE AUTOMOTIVE GEARS MARKET BY COUNTRY (USD BILLION) 2020-2029
TABLE 154 EUROPE AUTOMOTIVE GEARS MARKET BY COUNTRY (THOUSAND UNITS) 2020-2029
TABLE 155 EUROPE AUTOMOTIVE GEARS MARKET BY PRODUCT TYPE (USD BILLION) 2020-2029
TABLE 156 EUROPE AUTOMOTIVE GEARS MARKET BY PRODUCT TYPE (THOUSAND UNITS) 2020-2029
TABLE 157 EUROPE AUTOMOTIVE GEARS MARKET BY MATERIAL (USD BILLION) 2020-2029
TABLE 158 EUROPE AUTOMOTIVE GEARS MARKET BY MATERIAL (THOUSAND UNITS) 2020-2029
TABLE 159 EUROPE AUTOMOTIVE GEARS MARKET BY VEHICLE TYPE (USD BILLION) 2020-2029
TABLE 160 EUROPE AUTOMOTIVE GEARS MARKET BY VEHICLE TYPE (THOUSAND UNITS) 2020-2029
TABLE 161 EUROPE AUTOMOTIVE GEARS MARKET BY APPLICATION (USD BILLION) 2020-2029
TABLE 162 EUROPE AUTOMOTIVE GEARS MARKET BY APPLICATION (THOUSAND UNITS) 2020-2029
TABLE 163 GERMANY AUTOMOTIVE GEARS MARKET BY PRODUCT TYPE (USD BILLION) 2020-2029
TABLE 164 GERMANY AUTOMOTIVE GEARS MARKET BY PRODUCT TYPE (THOUSAND UNITS) 2020-2029
TABLE 165 GERMANY AUTOMOTIVE GEARS MARKET BY MATERIAL (USD BILLION) 2020-2029
TABLE 166 GERMANY AUTOMOTIVE GEARS MARKET BY MATERIAL (THOUSAND UNITS) 2020-2029
TABLE 167 GERMANY AUTOMOTIVE GEARS MARKET BY VEHICLE TYPE (USD BILLION) 2020-2029
TABLE 168 GERMANY AUTOMOTIVE GEARS MARKET BY VEHICLE TYPE (THOUSAND UNITS) 2020-2029
TABLE 169 GERMANY AUTOMOTIVE GEARS MARKET BY APPLICATION (USD BILLION) 2020-2029
TABLE 170 GERMANY AUTOMOTIVE GEARS MARKET BY APPLICATION (THOUSAND UNITS) 2020-2029
TABLE 171 UK AUTOMOTIVE GEARS MARKET BY PRODUCT TYPE (USD BILLION) 2020-2029
TABLE 172 UK AUTOMOTIVE GEARS MARKET BY PRODUCT TYPE (THOUSAND UNITS) 2020-2029
TABLE 173 UK AUTOMOTIVE GEARS MARKET BY MATERIAL (USD BILLION) 2020-2029
TABLE 174 UK AUTOMOTIVE GEARS MARKET BY MATERIAL (THOUSAND UNITS) 2020-2029
TABLE 175 UK AUTOMOTIVE GEARS MARKET BY VEHICLE TYPE (USD BILLION) 2020-2029
TABLE 176 UK AUTOMOTIVE GEARS MARKET BY VEHICLE TYPE (THOUSAND UNITS) 2020-2029
TABLE 177 UK AUTOMOTIVE GEARS MARKET BY APPLICATION (USD BILLION) 2020-2029
TABLE 178 UK AUTOMOTIVE GEARS MARKET BY APPLICATION (THOUSAND UNITS) 2020-2029
TABLE 179 FRANCE AUTOMOTIVE GEARS MARKET BY PRODUCT TYPE (USD BILLION) 2020-2029
TABLE 180 FRANCE AUTOMOTIVE GEARS MARKET BY PRODUCT TYPE (THOUSAND UNITS) 2020-2029
TABLE 181 FRANCE AUTOMOTIVE GEARS MARKET BY MATERIAL (USD BILLION) 2020-2029
TABLE 182 FRANCE AUTOMOTIVE GEARS MARKET BY MATERIAL (THOUSAND UNITS) 2020-2029
TABLE 183 FRANCE AUTOMOTIVE GEARS MARKET BY VEHICLE TYPE (USD BILLION) 2020-2029
TABLE 184 FRANCE AUTOMOTIVE GEARS MARKET BY VEHICLE TYPE (THOUSAND UNITS) 2020-2029
TABLE 185 FRANCE AUTOMOTIVE GEARS MARKET BY APPLICATION (USD BILLION) 2020-2029
TABLE 186 FRANCE AUTOMOTIVE GEARS MARKET BY APPLICATION (THOUSAND UNITS) 2020-2029
TABLE 187 ITALY AUTOMOTIVE GEARS MARKET BY PRODUCT TYPE (USD BILLION) 2020-2029
TABLE 188 ITALY AUTOMOTIVE GEARS MARKET BY PRODUCT TYPE (THOUSAND UNITS) 2020-2029
TABLE 189 ITALY AUTOMOTIVE GEARS MARKET BY MATERIAL (USD BILLION) 2020-2029
TABLE 190 ITALY AUTOMOTIVE GEARS MARKET BY MATERIAL (THOUSAND UNITS) 2020-2029
TABLE 191 ITALY AUTOMOTIVE GEARS MARKET BY VEHICLE TYPE (USD BILLION) 2020-2029
TABLE 192 ITALY AUTOMOTIVE GEARS MARKET BY VEHICLE TYPE (THOUSAND UNITS) 2020-2029
TABLE 193 ITALY AUTOMOTIVE GEARS MARKET BY APPLICATION (USD BILLION) 2020-2029
TABLE 194 ITALY AUTOMOTIVE GEARS MARKET BY APPLICATION (THOUSAND UNITS) 2020-2029
TABLE 195 SPAIN AUTOMOTIVE GEARS MARKET BY PRODUCT TYPE (USD BILLION) 2020-2029
TABLE 196 SPAIN AUTOMOTIVE GEARS MARKET BY PRODUCT TYPE (THOUSAND UNITS) 2020-2029
TABLE 197 SPAIN AUTOMOTIVE GEARS MARKET BY MATERIAL (USD BILLION) 2020-2029
TABLE 198 SPAIN AUTOMOTIVE GEARS MARKET BY MATERIAL (THOUSAND UNITS) 2020-2029
TABLE 199 SPAIN AUTOMOTIVE GEARS MARKET BY VEHICLE TYPE (USD BILLION) 2020-2029
TABLE 200 SPAIN AUTOMOTIVE GEARS MARKET BY VEHICLE TYPE (THOUSAND UNITS) 2020-2029
TABLE 201 SPAIN AUTOMOTIVE GEARS MARKET BY APPLICATION (USD BILLION) 2020-2029
TABLE 202 SPAIN AUTOMOTIVE GEARS MARKET BY APPLICATION (THOUSAND UNITS) 2020-2029
TABLE 203 RUSSIA AUTOMOTIVE GEARS MARKET BY PRODUCT TYPE (USD BILLION) 2020-2029
TABLE 204 RUSSIA AUTOMOTIVE GEARS MARKET BY PRODUCT TYPE (THOUSAND UNITS) 2020-2029
TABLE 205 RUSSIA AUTOMOTIVE GEARS MARKET BY MATERIAL (USD BILLION) 2020-2029
TABLE 206 RUSSIA AUTOMOTIVE GEARS MARKET BY MATERIAL (THOUSAND UNITS) 2020-2029
TABLE 207 RUSSIA AUTOMOTIVE GEARS MARKET BY VEHICLE TYPE (USD BILLION) 2020-2029
TABLE 208 RUSSIA AUTOMOTIVE GEARS MARKET BY VEHICLE TYPE (THOUSAND UNITS) 2020-2029
TABLE 209 RUSSIA AUTOMOTIVE GEARS MARKET BY APPLICATION (USD BILLION) 2020-2029
TABLE 210 RUSSIA AUTOMOTIVE GEARS MARKET BY APPLICATION (THOUSAND UNITS) 2020-2029
TABLE 211 REST OF EUROPE AUTOMOTIVE GEARS MARKET BY PRODUCT TYPE (USD BILLION) 2020-2029
TABLE 212 REST OF EUROPE AUTOMOTIVE GEARS MARKET BY PRODUCT TYPE (THOUSAND UNITS) 2020-2029
TABLE 213 REST OF EUROPE AUTOMOTIVE GEARS MARKET BY MATERIAL (USD BILLION) 2020-2029
TABLE 214 REST OF EUROPE AUTOMOTIVE GEARS MARKET BY MATERIAL (THOUSAND UNITS) 2020-2029
TABLE 215 REST OF EUROPE AUTOMOTIVE GEARS MARKET BY VEHICLE TYPE (USD BILLION) 2020-2029
TABLE 216 REST OF EUROPE AUTOMOTIVE GEARS MARKET BY VEHICLE TYPE (THOUSAND UNITS) 2020-2029
TABLE 217 REST OF EUROPE AUTOMOTIVE GEARS MARKET BY APPLICATION (USD BILLION) 2020-2029
TABLE 218 REST OF EUROPE AUTOMOTIVE GEARS MARKET BY APPLICATION (THOUSAND UNITS) 2020-2029
TABLE 219 MIDDLE EAST AND AFRICA AUTOMOTIVE GEARS MARKET BY COUNTRY (USD BILLION) 2020-2029
TABLE 220 MIDDLE EAST AND AFRICA AUTOMOTIVE GEARS MARKET BY COUNTRY (THOUSAND UNITS) 2020-2029
TABLE 221 MIDDLE EAST AND AFRICA AUTOMOTIVE GEARS MARKET BY PRODUCT TYPE (USD BILLION) 2020-2029
TABLE 222 MIDDLE EAST AND AFRICA AUTOMOTIVE GEARS MARKET BY PRODUCT TYPE (THOUSAND UNITS) 2020-2029
TABLE 223 MIDDLE EAST AND AFRICA AUTOMOTIVE GEARS MARKET BY MATERIAL (USD BILLION) 2020-2029
TABLE 224 MIDDLE EAST AND AFRICA AUTOMOTIVE GEARS MARKET BY MATERIAL (THOUSAND UNITS) 2020-2029
TABLE 225 MIDDLE EAST AND AFRICA AUTOMOTIVE GEARS MARKET BY VEHICLE TYPE (USD BILLION) 2020-2029
TABLE 226 MIDDLE EAST AND AFRICA AUTOMOTIVE GEARS MARKET BY VEHICLE TYPE (THOUSAND UNITS) 2020-2029
TABLE 227 MIDDLE EAST AND AFRICA AUTOMOTIVE GEARS MARKET BY APPLICATION (USD BILLION) 2020-2029
TABLE 228 MIDDLE EAST AND AFRICA AUTOMOTIVE GEARS MARKET BY APPLICATION (THOUSAND UNITS) 2020-2029
TABLE 229 UAE AUTOMOTIVE GEARS MARKET BY PRODUCT TYPE (USD BILLION) 2020-2029
TABLE 230 UAE AUTOMOTIVE GEARS MARKET BY PRODUCT TYPE (THOUSAND UNITS) 2020-2029
TABLE 231 UAE AUTOMOTIVE GEARS MARKET BY MATERIAL (USD BILLION) 2020-2029
TABLE 232 UAE AUTOMOTIVE GEARS MARKET BY MATERIAL (THOUSAND UNITS) 2020-2029
TABLE 233 UAE AUTOMOTIVE GEARS MARKET BY VEHICLE TYPE (USD BILLION) 2020-2029
TABLE 234 UAE AUTOMOTIVE GEARS MARKET BY VEHICLE TYPE (THOUSAND UNITS) 2020-2029
TABLE 235 UAE AUTOMOTIVE GEARS MARKET BY APPLICATION (USD BILLION) 2020-2029
TABLE 236 UAE AUTOMOTIVE GEARS MARKET BY APPLICATION (THOUSAND UNITS) 2020-2029
TABLE 237 SAUDI ARABIA AUTOMOTIVE GEARS MARKET BY PRODUCT TYPE (USD BILLION) 2020-2029
TABLE 238 SAUDI ARABIA AUTOMOTIVE GEARS MARKET BY PRODUCT TYPE (THOUSAND UNITS) 2020-2029
TABLE 239 SAUDI ARABIA AUTOMOTIVE GEARS MARKET BY MATERIAL (USD BILLION) 2020-2029
TABLE 240 SAUDI ARABIA AUTOMOTIVE GEARS MARKET BY MATERIAL (THOUSAND UNITS) 2020-2029
TABLE 241 SAUDI ARABIA AUTOMOTIVE GEARS MARKET BY VEHICLE TYPE (USD BILLION) 2020-2029
TABLE 242 SAUDI ARABIA AUTOMOTIVE GEARS MARKET BY VEHICLE TYPE (THOUSAND UNITS) 2020-2029
TABLE 243 SAUDI ARABIA AUTOMOTIVE GEARS MARKET BY APPLICATION (USD BILLION) 2020-2029
TABLE 244 SAUDI ARABIA AUTOMOTIVE GEARS MARKET BY APPLICATION (THOUSAND UNITS) 2020-2029
TABLE 245 SOUTH AFRICA AUTOMOTIVE GEARS MARKET BY PRODUCT TYPE (USD BILLION) 2020-2029
TABLE 246 SOUTH AFRICA AUTOMOTIVE GEARS MARKET BY PRODUCT TYPE (THOUSAND UNITS) 2020-2029
TABLE 247 SOUTH AFRICA AUTOMOTIVE GEARS MARKET BY MATERIAL (USD BILLION) 2020-2029
TABLE 248 SOUTH AFRICA AUTOMOTIVE GEARS MARKET BY MATERIAL (THOUSAND UNITS) 2020-2029
TABLE 249 SOUTH AFRICA AUTOMOTIVE GEARS MARKET BY VEHICLE TYPE (USD BILLION) 2020-2029
TABLE 250 SOUTH AFRICA AUTOMOTIVE GEARS MARKET BY VEHICLE TYPE (THOUSAND UNITS) 2020-2029
TABLE 251 SOUTH AFRICA AUTOMOTIVE GEARS MARKET BY APPLICATION (USD BILLION) 2020-2029
TABLE 252 SOUTH AFRICA AUTOMOTIVE GEARS MARKET BY APPLICATION (THOUSAND UNITS) 2020-2029
TABLE 253 REST OF MIDDLE EAST AND AFRICA AUTOMOTIVE GEARS MARKET BY PRODUCT TYPE (USD BILLION) 2020-2029
TABLE 254 REST OF MIDDLE EAST AND AFRICA AUTOMOTIVE GEARS MARKET BY PRODUCT TYPE (THOUSAND UNITS) 2020-2029
TABLE 255 REST OF MIDDLE EAST AND AFRICA AUTOMOTIVE GEARS MARKET BY MATERIAL (USD BILLION) 2020-2029
TABLE 256 REST OF MIDDLE EAST AND AFRICA AUTOMOTIVE GEARS MARKET BY MATERIAL (THOUSAND UNITS) 2020-2029
TABLE 257 REST OF MIDDLE EAST AND AFRICA AUTOMOTIVE GEARS MARKET BY VEHICLE TYPE (USD BILLION) 2020-2029
TABLE 258 REST OF MIDDLE EAST AND AFRICA AUTOMOTIVE GEARS MARKET BY VEHICLE TYPE (THOUSAND UNITS) 2020-2029
TABLE 259 REST OF MIDDLE EAST AND AFRICA AUTOMOTIVE GEARS MARKET BY APPLICATION (USD BILLION) 2020-2029
TABLE 260 REST OF MIDDLE EAST AND AFRICA AUTOMOTIVE GEARS MARKET BY APPLICATION (THOUSAND UNITS) 2020-2029
LIST OF FIGURES
FIGURE 1 MARKET DYNAMICS
FIGURE 2 MARKET SEGMENTATION
FIGURE 3 REPORT TIMELINES: YEARS CONSIDERED
FIGURE 4 DATA TRIANGULATION
FIGURE 5 BOTTOM-UP APPROACH
FIGURE 6 TOP-DOWN APPROACH
FIGURE 7 RESEARCH FLOW
FIGURE 8 GLOBAL AUTOMOTIVE GEARS MARKET BY PRODUCT TYPE, USD BILLION, 2020-2029
FIGURE 9 GLOBAL AUTOMOTIVE GEARS MARKET BY MATERIAL, USD BILLION, 2020-2029
FIGURE 10 GLOBAL AUTOMOTIVE GEARS MARKET BY VEHICLE TYPE, USD BILLION, 2020-2029
FIGURE 11 GLOBAL AUTOMOTIVE GEARS MARKET BY APPLICATION, USD BILLION, 2020-2029
FIGURE 12 GLOBAL AUTOMOTIVE GEARS MARKET BY REGION, USD BILLION, 2020-2029
FIGURE 13 GLOBAL AUTOMOTIVE GEARS MARKET BY PRODUCT TYPE, USD BILLION, 2021
FIGURE 14 GLOBAL AUTOMOTIVE GEARS MARKET BY MATERIAL, USD BILLION, 2021
FIGURE 15 GLOBAL AUTOMOTIVE GEARS MARKET BY VEHICLE TYPE, USD BILLION, 2021
FIGURE 16 GLOBAL AUTOMOTIVE GEARS MARKET BY APPLICATION, USD BILLION, 2021
FIGURE 17 GLOBAL AUTOMOTIVE GEARS MARKET BY REGION, USD BILLION, 2021
FIGURE 18 PORTER’S FIVE FORCES MODEL
FIGURE 19 MARKET SHARE ANALYSIS
FIGURE 20 JATCO LTD: COMPANY SNAPSHOT
FIGURE 21 NORD: COMPANY SNAPSHOT
FIGURE 22 AMTEK INTERNATIONAL: COMPANY SNAPSHOT
FIGURE 23 BHARAT GEARS LTD.: COMPANY SNAPSHOT
FIGURE 24 EATON: COMPANY SNAPSHOT
FIGURE 25 GEAR MOTIONS: COMPANY SNAPSHOT
FIGURE 26 MAHINDRA CIE: COMPANY SNAPSHOT
FIGURE 27 RENOLD: COMPANY SNAPSHOT
FIGURE 28 VARROC GROUP: COMPANY SNAPSHOT
FIGURE 29 UNIVANCE CORPORATION: COMPANY SNAPSHOT
DOWNLOAD FREE SAMPLE REPORT
License Type
SPEAK WITH OUR ANALYST
Want to know more about the report or any specific requirement?
WANT TO CUSTOMIZE THE REPORT?
Our Clients Speak
We asked them to research ‘ Equipment market’ all over the world, and their whole arrangement was helpful to us. thehealthanalytics.com insightful analysis and reports contributed to our current analysis and in creating a future strategy. Besides, the te
Yosuke Mitsui
Senior Associate Construction Equipment Sales & Marketing
We asked them to research ‘Equipment market’ all over the world, and their whole arrangement was helpful to us. thehealthanalytics.com insightful analysis and reports contributed to our current analysis and in creating a future strategy. Besides, the te


