

Base Year Value ()
x.x %
x.x %
CAGR ()
x.x %
x.x %
Forecast Year Value ()
x.x %
x.x %
Historical Data Period
Largest Region
Forecast Period
Marché des cartes de vœux par type (carte électronique, carte traditionnelle), par canal de distribution (en ligne, hors ligne) et région, tendances mondiales et prévisions de 2024 à 2030.
Instant access to hundreds of data points and trends
- Market estimates from 2014-2029
- Competitive analysis, industry segmentation, financial benchmarks
- Incorporates SWOT, Porter's Five Forces and risk management frameworks
- PDF report or online database with Word, Excel and PowerPoint export options
- 100% money back guarantee
Aperçu du marché des cartes de vœux
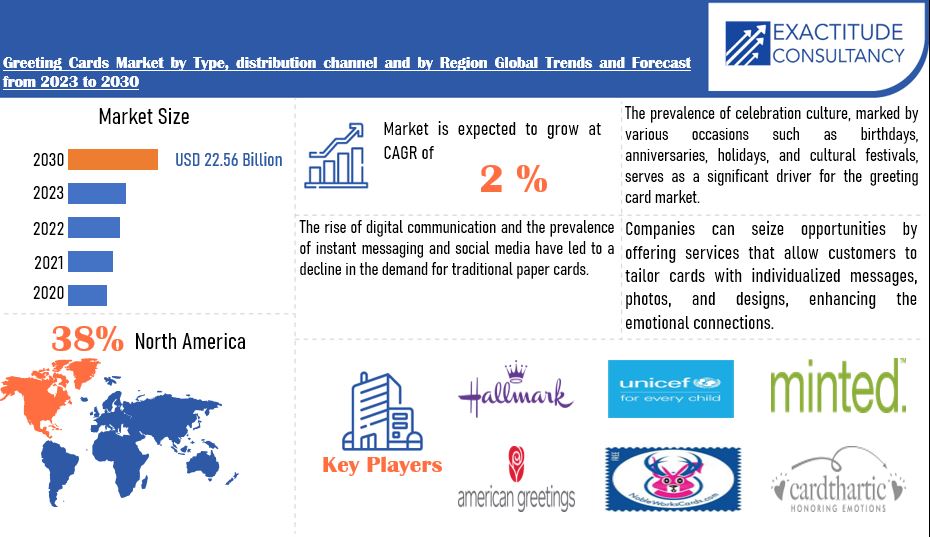
Le marché mondial des cartes de vœux devrait passer de 19,64 milliards USD en 2023 à 22,56 milliards USD en 2030, à un TCAC de 2 % au cours de la période de prévision.
Le marché des cartes de vœux est une industrie florissante et multiforme qui produit et distribue des cartes pour une variété d'occasions et d'émotions. Les gens peuvent utiliser ces cartes comme un moyen d'exprimer leurs sentiments, de marquer des occasions spéciales ou de souhaiter bonne chance à leurs proches. Il existe de nombreuses catégories de cartes différentes disponibles sur le marché, telles que les cartes de condoléances, de félicitations, d'anniversaire et d'anniversaire. En raison de la diversité de ce marché, les clients peuvent sélectionner une carte qui exprime parfaitement le sentiment ou l'occasion qu'ils souhaitent partager. Le marché des cartes de vœux a récemment évolué pour inclure des cartes numériques ou électroniques qui peuvent être envoyées et reçues en ligne en plus des cartes papier plus conventionnelles. L'avènement de la technologie numérique a élargi l'attrait du marché et a permis aux gens de s'exprimer virtuellement, en particulier à l'ère des médias sociaux et de la messagerie instantanée. Pourtant, les cartes papier traditionnelles sont encore largement utilisées car elles plaisent aux personnes qui apprécient la qualité tangible et intime d'une carte physique.
[caption id="attachment_35880" align="aligncenter" width="930"]
Les acteurs importants du marché des cartes de vœux sont des fabricants de cartes réputés, des artistes indépendants et des éditeurs qui soutiennent l’environnement créatif du secteur. Pour offrir aux clients une variété de choix, ces entreprises innovent constamment en termes de conception, de matériaux et de méthodes d’impression. Les tendances saisonnières, les particularités culturelles et les goûts changeants des clients ont également un impact sur le marché, ce qui le rend dynamique et sensible aux dynamiques sociales changeantes. Tout bien considéré, le marché des cartes de vœux est essentiel pour permettre des connexions profondes et des expressions émotionnelles, satisfaisant le besoin humain durable de connexion et de communication. Les cartes de vœux restent un moyen réfléchi et intemporel pour les gens de se connecter et de célébrer différents aspects de la vie, qu’elles soient envoyées numériquement ou en personne.
| ATTRIBUT | DÉTAILS |
| Période d'étude | 2020-2030 |
| Année de base | 2022 |
| Année estimée | 2023 |
| Année prévue | 2023-2030 |
| Période historique | 2019-2021 |
| Unité | Valeur (milliards USD) Volume (milliers d'unités) |
| Segmentation | Par type, canal de distribution et région |
| Par type |
|
| Par canal de distribution |
|
| By Region |
|
Frequently Asked Questions
• What is the market size for the Greeting Cards market?
The Greeting Cards market is anticipated to grow from USD 19.64 Billion in 2023 to USD 22.56 Billion by 2030, at a CAGR of 2 % during the forecast period.
• Which region is dominating in the Greeting Cards market?
North America accounted for the largest market in the Greeting Cards market. North America accounted for 38 % market share of the global market value.
• Who are the major key players in the Greeting Cards market?
Hallmark Cards, Inc., American Greetings Corporation, Papyrus, Carlton Cards, Archies Limited, Paperchase, Moonpig, Avanti Press, Clintons , NobleWorks Cards, Card Factory, Current Catalog, UNICEF
• What are the key trends in the Greeting Cards market?
To give their messages a distinctive flair, customers are increasingly looking for greeting cards that can be customized and personalized. The need for more personalized and meaningful ways to express feelings propelled this trend. Demand for environmentally friendly greeting cards increased as environmental awareness increased. In the greeting card industry, there was a trend toward using sustainable production processes, and many customers were looking for cards made from recycled materials.
Greeting Cards Market Segmentation Analysis
The Greeting Cards market is divided into three type, distribution channel and region. By type it is divided as eCard, Traditional Card. eCard holds largest market share. Electronic cards, or eCards for short, have become more and more popular in the digital era. Designed and distributed via digital channels, these cards offer a rapid and easy means of communicating. Multimedia components like animations, music, and personalized messages are frequently included in eCards, making the recipient's experience more interactive and interesting. eCards are for people who appreciate the speed and environmental friendliness of digital communication. They can be sent immediately by email or social media. Conventional cards, on the other hand, continue to have a timeless appeal. Made of paper, these cards are frequently found in physical stores and come in a variety of designs suitable for a range of events. With traditional cards, people can choose a tangible, frequently handmade, way to express their feelings.
[caption id="attachment_35905" align="aligncenter" width="713"]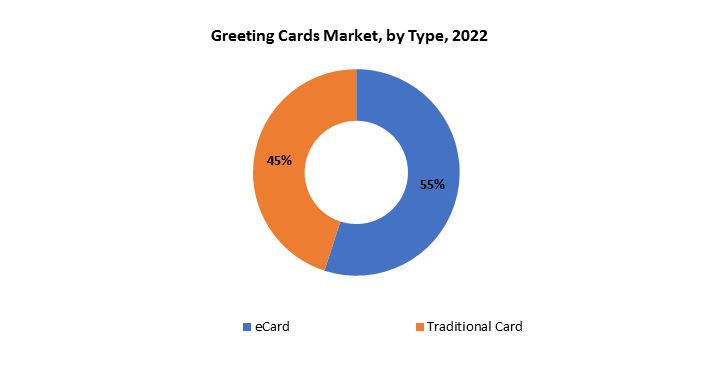
The process of selecting a card, writing a heartfelt message, and hand-delivering or mailing it adds a significant touch to communication. Those who value the tangible quality of a physical card and prefer a more customary and intimate way to send greetings tend to favor traditional cards. Essentially, the separation of the greeting card market into eCards and traditional cards represents the various tastes and modes of communication of consumers, allowing for the convenience of digital communication as well as the timeless appeal of physical expressions.
By Distribution Channel it is divided into Online and Offline. In this Online channel holds the largest market share. In recent years, online distribution channels have become increasingly popular, providing customers with the ease of browsing, choosing, and sending cards from the comfort of their own homes. Numerous digital and physical card options are available on online platforms such as social media, e-commerce marketplaces, and websites devoted to greeting cards. Consumers can peruse vast assortments, personalize greetings, and frequently take advantage of speedy delivery services. Tech-savvy customers who value the speed, accessibility, and wide selection provided by digital platforms are catered to by the online channel.
[caption id="attachment_35907" align="aligncenter" width="774"]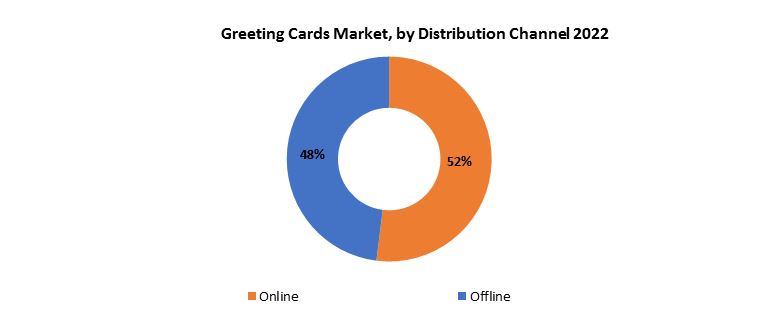
Brick and mortar retailers and specialty card shops are examples of offline distribution channels. Customers can browse through real displays, feel and touch the cards, and make in-store selections at these physical stores, which provide a hands-on shopping experience. Those who prefer the tactile experience of selecting and buying cards frequently prefer traditional retail establishments, particularly for last-minute events or when looking for a personalized touch. The greeting card market's separation of offline and online distribution channels illustrates how flexible the sector is in response to shifting consumer tastes and behaviors. Offline channels continue to have a certain allure, drawing people who value the tactile experience of choosing and receiving greeting cards, even though online channels are more convenient and offer a wider selection. With this two-pronged distribution strategy, customers can select the one that best suits their needs and the particular circumstances of the event.
[caption id="attachment_35908" align="aligncenter" width="759"]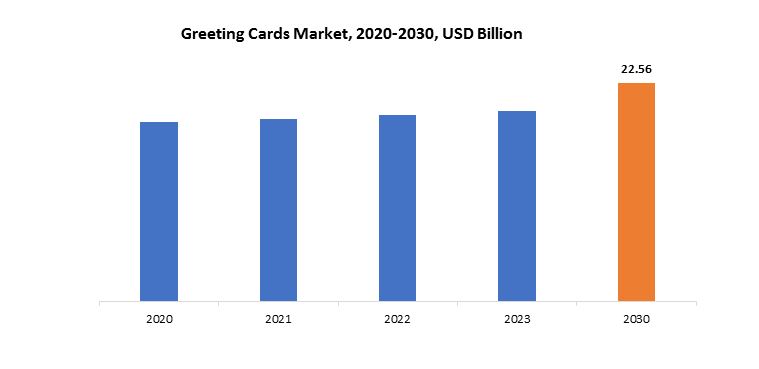
Greeting Cards Market Dynamics
Driver Consumers increasingly seek personalized and unique ways to express their feelings.Numerous customization options are available from greeting card manufacturers and retailers. Customers can add their own images, notes, and even custom themes or colors to make the cards uniquely theirs. With this degree of personalization, anyone can design a card that is especially suited to the recipient and the situation. Customers are prioritizing the option to add customized notes to their cards over the actual design. The ability to include personal messages, memories, or inside jokes gives the card a deeper, more meaningful depth that will make the recipient treasure it as a keepsake. Special occasions and milestones are also occasions where there is a need for personalized expression. There are now greeting cards available for a broad variety of special occasions, such as holidays and personal accomplishments.
Some customers are going above and beyond personalization by making their own handmade and do-it-yourself cards. This style is in line with the desire for genuineness and the fulfillment that comes from creating something by hand. Personalized cards made by hand frequently have sentimental value. Greeting cards with images of the individual have grown in popularity. People can now exhibit memories and record moments in a material way thanks to this trend. For special occasions like birthdays, anniversaries, and family milestones, photo cards are particularly popular. Customers are looking for cards that showcase a variety of identities and cultural backgrounds. In response, greeting card companies are introducing cards that honor various languages, customs, and ways of life. Customers who appreciate representation in the products they purchase are drawn to this inclusivity.
Restraint The production of traditional greeting cards often involves paper and various materials, contributing to environmental concerns related to deforestation and waste.Pulp made from wood, primarily from trees, is used to make paper. The extensive production of paper used to make greeting cards has the potential to exacerbate deforestation, a serious ecological threat. Clear-cutting forests for paper production has the potential to upset ecosystems, cause habitat loss, and worsen the decline of biodiversity. Paper production uses a lot of resources, including energy and water. Pulping, bleaching, and other chemical treatments that may have an effect on the environment are all part of the manufacturing process. The carbon footprint of conventional greeting cards is increased by the extraction and processing of raw materials. Creating vibrant and eye-catching cards may require the use of chemicals that are bad for the environment during the bleaching and dyeing processes. If these chemicals are not properly disposed of, it could lead to water pollution.
Greeting cards frequently include extra decorations, plastic wrapping, and envelopes. The overall waste produced by the creation and use of traditional cards includes the decorative components and packaging. These products can contribute to environmental pollution and landfill issues if they are disposed of improperly. Traditional greeting card distribution can result in large carbon emissions from transportation from producers to retailers to consumers. This is especially true if cards are made in one place and sent all over the world.
Opportunities With increasing environmental awareness, there is a growing market for eco-friendly greeting cards.Recycled paper or cardboard are frequently used as the main component of eco-friendly greeting cards. By doing this, the need for new raw materials is lessened and the environmental effect of producing paper is reduced. Using vegetable-based inks for card printing instead of conventional petroleum-based inks is a sustainable decision. Because they come from renewable resources, vegetable-based inks are less damaging to the environment. An important factor in greeting cards' environmental impact is their packaging. Compostable or biodegradable packaging is frequently included with eco-friendly cards, minimizing the quantity of waste produced. Certain eco-friendly greeting cards are made from materials like cotton, hemp, or bamboo that don't come from trees. When compared to conventional paper made from trees, these materials require less water and land to produce.
Eco-friendly cards frequently have simple designs that require less resources to produce. This strategy minimizes waste and energy use, which is in line with sustainability principles. Water-saving techniques may be used in the production of sustainable greeting cards in order to reduce the manufacturing process's negative environmental effects. Putting water-saving techniques into practice helps to conserve resources overall. Sustainability-focused greeting card companies might give local production and material sourcing priority. This boosts regional economies and lessens the carbon footprint caused by transportation. Through a variety of programs, some environmentally conscious greeting card companies offset their carbon emissions. This commitment to becoming carbon neutral shows how serious you are about protecting the environment.
Greeting Cards Market Trends
-
To give their messages a distinctive flair, customers are increasingly looking for greeting cards that can be customized and personalized. The need for more personalized and meaningful ways to express feelings propelled this trend.
-
Demand for environmentally friendly greeting cards increased as environmental awareness increased. In the greeting card industry, there was a trend toward using sustainable production processes, and many customers were looking for cards made from recycled materials.
-
Digital integration was increasing even as physical cards continued to be widely used. Certain greeting cards combined digital and traditional forms of communication by using technologies like augmented reality (AR) and QR codes to create interactive and interesting experiences.
-
Small companies, niche players, and independent designers rose to prominence as buyers sought out unique, superior designs that distinguished themselves from mass-produced options.
-
The ease of shopping online has been a major factor in the expansion of e-commerce in the greeting card industry. Online retailers made it possible for customers to peruse a large selection of cards, frequently with customizable options, and they also made it easier for smaller designers to enter the market.
-
A wider variety of inclusive and diverse themes and representations began to appear on greeting cards. A growing consciousness emerged regarding the significance of accommodating varied demographics and events, guaranteeing that cards were applicable and significant to a wider readership.
-
In addition to the more conventional holidays and birthdays, there was a trend toward themed and occasion-specific cards. Customers requested cards that were customized for particular occasions, pastimes, or interests, indicating a need for more specialized and niche selections.
Competitive Landscape
The competitive landscape of the Greeting Cards market was dynamic, with several prominent companies competing to provide innovative and advanced Greeting Cards solutions.- Hallmark Cards, Inc.
- American Greetings Corporation
- Papyrus
- Carlton Cards
- Archies Limited
- Paperchase
- Moonpig
- Avanti Press
- Clintons
- NobleWorks Cards
- Card Factory
- Current Catalog
- UNICEF
- Etsy
- Minted
- Dayspring Cards (Subsidiary of Hallmark)
- Designer Greetings
- Graphique de France
- Cardthartic
- Recycled Paper Greetings
November 16, 2023: AmericanGreetings.com kicks off the season of kindness and joy as the presenting sponsor of the 2023 Grand Central Terminal Holiday Fair. CLEVELAND — As the holiday spirit fills the halls of the historic Grand Central Terminal in New York City, AmericanGreetings.com is proud to help kick off the season of kindness and joy as the presenting sponsor of the 2023 Grand Central Terminal Holiday Fair for the second consecutive year.
November 8, 2023: Hallmark is enhancing holiday traditions with new, seasonal products designed to evoke nostalgia and celebrate togetherness. With a wide variety of Keepsake Ornaments, greeting cards and gifts for everyone, Hallmark is adding merrier and more meaning to every celebration the season brings.
Regional Analysis
North America accounted for the largest market in the Greeting Cards market. North America accounted for 38% of the worldwide market value. A vast range of occasions, themes, and styles define the greeting card market in North America, which has historically been a vibrant and diverse sector of the economy. The market has a wide range of participants, from well-known greeting card manufacturers to independent designers and small enterprises. A major factor in the market's ongoing demand is the widespread use of greeting cards to express feelings on special occasions like birthdays, holidays, weddings, and other occasions. A noteworthy development in recent years has been the move toward greeting cards that are individualized and adaptable. The need for personalized designs and messages is being driven by consumers' growing desire for original and meaningful ways to express their emotions. Due to this trend, websites that let users design personalized cards have emerged, encouraging competition and creativity in the market.
[caption id="attachment_35923" align="aligncenter" width="756"]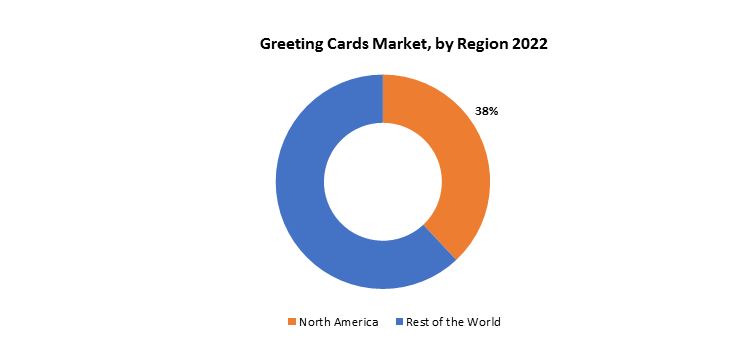
Furthermore, environmentally friendly and sustainable practices have become increasingly important in the North American greeting card industry. Many customers are looking for greeting cards made from recycled materials or produced using environmentally friendly processes as a result of growing awareness of environmental issues. This change is in line with a larger consumer trend toward ethical and sustainable shopping. Greeting cards are now distributed through a variety of channels, including online and physical retail stores. This is a significant evolution in the industry. E-commerce has gained traction and is becoming more popular, providing consumers with more options and convenience than traditional brick-and-mortar stores. Online platforms give niche players and smaller designers the chance to reach a worldwide audience.
Target Audience for Greeting Cards Market
- Individuals celebrating special occasions
- Families exchanging greetings
- Friends expressing sentiments
- Couples for romantic occasions
- Parents sending cards to children
- Children giving cards to parents
- Colleagues in workplace settings
- Corporations for business purposes
- Event organizers for special events
- Retailers selling greeting cards
- Online shoppers buying cards
- Art and design enthusiasts
Import & Export Data for Greeting Cards Market
Exactitude consultancy provides import and export data for the recent years. It also offers insights on production and consumption volume of the product. Understanding the import and export data is pivotal for any player in the Greeting Cards market. This knowledge equips businesses with strategic advantages, such as:
-
Identifying emerging markets with untapped potential.
-
Adapting supply chain strategies to optimize cost-efficiency and market responsiveness.
-
Navigating competition by assessing major players' trade dynamics.
Key insights
-
Trade volume trends: our report dissects import and export data spanning the last five years to reveal crucial trends and growth patterns within the global Greeting Cards market. This data-driven exploration empowers readers with a deep understanding of the market's trajectory.
-
Market players: gain insights into the leading players driving the Greeting Cards trade. From established giants to emerging contenders, our analysis highlights the key contributors to the import and export landscape.
-
Geographical dynamics: delve into the geographical distribution of trade activities. Uncover which regions dominate exports and which ones hold the reins on imports, painting a comprehensive picture of the industry's global footprint.
-
Product breakdown: by segmenting data based on Greeting Cards types –– we provide a granular view of trade preferences and shifts, enabling businesses to align strategies with the evolving technological landscape.
Import and export data is crucial in reports as it offers insights into global market trends, identifies emerging opportunities, and informs supply chain management. By analyzing trade flows, businesses can make informed decisions, manage risks, and tailor strategies to changing demand. This data aids government in policy formulation and trade negotiations, while investors use it to assess market potential. Moreover, import and export data contributes to economic indicators, influences product innovation, and promotes transparency in international trade, making it an essential component for comprehensive and informed analyses.
Segments Covered in the Greeting Cards Market Report
Greeting Cards market by Type, 2020-2030, (USD Billion) (Thousand Units)- eCard
- Traditional Card
- Online
- Offline
- North America
- Europe
- Asia Pacific
- South America
- Middle East and Africa
Key Question Answered
-
What is the expected growth rate of the Greeting Cards market over the next 7 years?
-
Who are the major players in the Greeting Cards market and what is their market share?
-
What are the end-user industries driving market demand and what is their outlook?
-
What are the opportunities for growth in emerging markets such as Asia-Pacific, the middle east, and Africa?
-
How is the economic environment affecting the Greeting Cards market, including factors such as interest rates, inflation, and exchange rates?
-
What is the expected impact of government policies and regulations on the Greeting Cards market?
-
What is the current and forecasted size and growth rate of the global Greeting Cards market?
-
What are the key drivers of growth in the Greeting Cards market?
-
Who are the major players in the market and what is their market share?
-
What are the distribution channels and supply chain dynamics in the Greeting Cards market?
-
What are the technological advancements and innovations in the Greeting Cards market and their impact on product development and growth?
-
What are the regulatory considerations and their impact on the market?
-
What are the challenges faced by players in the Greeting Cards market and how are they addressing these challenges?
-
What are the opportunities for growth and expansion in the Greeting Cards market?
-
What are the product offerings and specifications of leading players in the market?
TABLE OF CONTENTS
- INTRODUCTION
- MARKET DEFINITION
- MARKET SEGMENTATION
- RESEARCH TIMELINES
- ASSUMPTIONS AND LIMITATIONS
- RESEARCH METHODOLOGY
- DATA MINING
- SECONDARY RESEARCH
- PRIMARY RESEARCH
- SUBJECT-MATTER EXPERTS’ ADVICE
- QUALITY CHECKS
- FINAL REVIEW
- DATA TRIANGULATION
- BOTTOM-UP APPROACH
- TOP-DOWN APPROACH
- RESEARCH FLOW
- DATA SOURCES
- DATA MINING
- EXECUTIVE SUMMARY
- MARKET OVERVIEW
- GLOBAL SMART DOOR LOCK MARKET OUTLOOK
- MARKET DRIVERS
- MARKET RESTRAINTS
- MARKET OPPORTUNITIES
- IMPACT OF COVID-19 ON SMART DOOR LOCK MARKET
- PORTER’S FIVE FORCES MODEL
- THREAT FROM NEW ENTRANTS
- THREAT FROM SUBSTITUTES
- BARGAINING POWER OF SUPPLIERS
- BARGAINING POWER OF CUSTOMERS
- DEGREE OF COMPETITION
- INDUSTRY VALUE CHAIN ANALYSIS
- GLOBAL SMART DOOR LOCK MARKET OUTLOOK
- GLOBAL SMART DOOR LOCK MARKET BY TYPE, 2020-2030, (USD BILLION) (THOUSAND UNITS)
- DEADBOLT
- LEVER HANDLES
- PADLOCK
- OTHERS
- GLOBAL SMART DOOR LOCK MARKET BY PRODUCT, 2020-2030, (USD BILLION) (THOUSAND UNITS)
- BIOMETRIC DOOR
- SMART CARD DOOR LOCKS
- ELECTRIC STRIKE DOOR LOCKS
- OTHERS
- GLOBAL SMART DOOR LOCK MARKET BY REGION, 2020-2030, (USD BILLION) (THOUSAND UNITS)
- NORTH AMERICA
- US
- CANADA
- MEXICO
- SOUTH AMERICA
- BRAZIL
- ARGENTINA
- COLOMBIA
- REST OF SOUTH AMERICA
- EUROPE
- GERMANY
- UK
- FRANCE
- ITALY
- SPAIN
- RUSSIA
- REST OF EUROPE
- ASIA PACIFIC
- INDIA
- CHINA
- JAPAN
- SOUTH KOREA
- AUSTRALIA
- SOUTH-EAST ASIA
- REST OF ASIA PACIFIC
- MIDDLE EAST AND AFRICA
- UAE
- SAUDI ARABIA
- SOUTH AFRICA
- REST OF MIDDLE EAST AND AFRICA
- NORTH AMERICA
- COMPANY PROFILES*
(BUSINESS OVERVIEW, COMPANY SNAPSHOT, PRODUCT OFFERED, RECENT DEVELOPMENTS)
- ASSA ABLOY
- ALLEGION
- DORMAKABA
- SAMSUNG SDS
- HONEYWELL
- SCHLAGE
- AUGUST HOME
- KWIKSET
- ULTRALOQ
- GATE LABS
- NUKI
- IGLOOHOME
- LOCKITRON
- DANALOCK
- SALTO SYSTEMS
- AVENTSECURITY
- XEEDER
- HAVEN
- PANASONIC
- YALE *THE COMPANY LIST IS INDICATIVE
LIST OF TABLES
TABLE 1 GLOBAL SMART DOOR LOCK MARKET BY TYPE (USD BILLION) 2020-2030
TABLE 2 GLOBAL SMART DOOR LOCK MARKET BY TYPE (THOUSAND UNITS) 2020-2030
TABLE 3 GLOBAL SMART DOOR LOCK MARKET BY PRODUCT (USD BILLION) 2020-2030
TABLE 4 GLOBAL SMART DOOR LOCK MARKET BY PRODUCT (THOUSAND UNITS) 2020-2030
TABLE 5 GLOBAL SMART DOOR LOCK MARKET BY REGION (USD BILLION) 2020-2030
TABLE 6 GLOBAL SMART DOOR LOCK MARKET BY REGION (THOUSAND UNITS) 2020-2030
TABLE 7 NORTH AMERICA SMART DOOR LOCK MARKET BY COUNTRY (USD BILLION) 2020-2030
TABLE 8 NORTH AMERICA SMART DOOR LOCK MARKET BY COUNTRY (THOUSAND UNITS) 2020-2030
TABLE 9 NORTH AMERICA SMART DOOR LOCK MARKET BY TYPE (USD BILLION) 2020-2030
TABLE 10 NORTH AMERICA SMART DOOR LOCK MARKET BY TYPE (THOUSAND UNITS) 2020-2030
TABLE 11 NORTH AMERICA SMART DOOR LOCK MARKET BY PRODUCT (USD BILLION) 2020-2030
TABLE 12 NORTH AMERICA SMART DOOR LOCK MARKET BY PRODUCT (THOUSAND UNITS) 2020-2030
TABLE 13 US SMART DOOR LOCK MARKET BY TYPE (USD BILLION) 2020-2030
TABLE 14 US SMART DOOR LOCK MARKET BY TYPE (THOUSAND UNITS) 2020-2030
TABLE 15 US SMART DOOR LOCK MARKET BY PRODUCT (USD BILLION) 2020-2030
TABLE 16 US SMART DOOR LOCK MARKET BY PRODUCT (THOUSAND UNITS) 2020-2030
TABLE 17 CANADA SMART DOOR LOCK MARKET BY TYPE (USD BILLION) 2020-2030
TABLE 18 CANADA SMART DOOR LOCK MARKET BY TYPE (THOUSAND UNITS) 2020-2030
TABLE 19 CANADA SMART DOOR LOCK MARKET BY PRODUCT (USD BILLION) 2020-2030
TABLE 20 CANADA SMART DOOR LOCK MARKET BY PRODUCT (THOUSAND UNITS) 2020-2030
TABLE 21 MEXICO SMART DOOR LOCK MARKET BY TYPE (USD BILLION) 2020-2030
TABLE 22 MEXICO SMART DOOR LOCK MARKET BY TYPE (THOUSAND UNITS) 2020-2030
TABLE 23 MEXICO SMART DOOR LOCK MARKET BY PRODUCT (USD BILLION) 2020-2030
TABLE 24 MEXICO SMART DOOR LOCK MARKET BY PRODUCT (THOUSAND UNITS) 2020-2030
TABLE 25 SOUTH AMERICA SMART DOOR LOCK MARKET BY COUNTRY (USD BILLION) 2020-2030
TABLE 26 SOUTH AMERICA SMART DOOR LOCK MARKET BY COUNTRY (THOUSAND UNITS) 2020-2030
TABLE 27 SOUTH AMERICA SMART DOOR LOCK MARKET BY TYPE (USD BILLION) 2020-2030
TABLE 28 SOUTH AMERICA SMART DOOR LOCK MARKET BY TYPE (THOUSAND UNITS) 2020-2030
TABLE 29 SOUTH AMERICA SMART DOOR LOCK MARKET BY PRODUCT (USD BILLION) 2020-2030
TABLE 30 SOUTH AMERICA SMART DOOR LOCK MARKET BY PRODUCT (THOUSAND UNITS) 2020-2030
TABLE 31 BRAZIL SMART DOOR LOCK MARKET BY TYPE (USD BILLION) 2020-2030
TABLE 32 BRAZIL SMART DOOR LOCK MARKET BY TYPE (THOUSAND UNITS) 2020-2030
TABLE 33 BRAZIL SMART DOOR LOCK MARKET BY PRODUCT (USD BILLION) 2020-2030
TABLE 34 BRAZIL SMART DOOR LOCK MARKET BY PRODUCT (THOUSAND UNITS) 2020-2030
TABLE 35 ARGENTINA SMART DOOR LOCK MARKET BY TYPE (USD BILLION) 2020-2030
TABLE 36 ARGENTINA SMART DOOR LOCK MARKET BY TYPE (THOUSAND UNITS) 2020-2030
TABLE 37 ARGENTINA SMART DOOR LOCK MARKET BY PRODUCT (USD BILLION) 2020-2030
TABLE 38 ARGENTINA SMART DOOR LOCK MARKET BY PRODUCT (THOUSAND UNITS) 2020-2030
TABLE 39 COLOMBIA SMART DOOR LOCK MARKET BY TYPE (USD BILLION) 2020-2030
TABLE 40 COLOMBIA SMART DOOR LOCK MARKET BY TYPE (THOUSAND UNITS) 2020-2030
TABLE 41 COLOMBIA SMART DOOR LOCK MARKET BY PRODUCT (USD BILLION) 2020-2030
TABLE 42 COLOMBIA SMART DOOR LOCK MARKET BY PRODUCT (THOUSAND UNITS) 2020-2030
TABLE 43 REST OF SOUTH AMERICA SMART DOOR LOCK MARKET BY TYPE (USD BILLION) 2020-2030
TABLE 44 REST OF SOUTH AMERICA SMART DOOR LOCK MARKET BY TYPE (THOUSAND UNITS) 2020-2030
TABLE 45 REST OF SOUTH AMERICA SMART DOOR LOCK MARKET BY PRODUCT (USD BILLION) 2020-2030
TABLE 46 REST OF SOUTH AMERICA SMART DOOR LOCK MARKET BY PRODUCT (THOUSAND UNITS) 2020-2030
TABLE 47 ASIA-PACIFIC SMART DOOR LOCK MARKET BY COUNTRY (USD BILLION) 2020-2030
TABLE 48 ASIA-PACIFIC SMART DOOR LOCK MARKET BY COUNTRY (THOUSAND UNITS) 2020-2030
TABLE 49 ASIA-PACIFIC SMART DOOR LOCK MARKET BY TYPE (USD BILLION) 2020-2030
TABLE 50 ASIA-PACIFIC SMART DOOR LOCK MARKET BY TYPE (THOUSAND UNITS) 2020-2030
TABLE 51 ASIA-PACIFIC SMART DOOR LOCK MARKET BY PRODUCT (USD BILLION) 2020-2030
TABLE 52 ASIA-PACIFIC SMART DOOR LOCK MARKET BY PRODUCT (THOUSAND UNITS) 2020-2030
TABLE 53 INDIA SMART DOOR LOCK MARKET BY TYPE (USD BILLION) 2020-2030
TABLE 54 INDIA SMART DOOR LOCK MARKET BY TYPE (THOUSAND UNITS) 2020-2030
TABLE 55 INDIA SMART DOOR LOCK MARKET BY PRODUCT (USD BILLION) 2020-2030
TABLE 56 INDIA SMART DOOR LOCK MARKET BY PRODUCT (THOUSAND UNITS) 2020-2030
TABLE 57 CHINA SMART DOOR LOCK MARKET BY TYPE (USD BILLION) 2020-2030
TABLE 58 CHINA SMART DOOR LOCK MARKET BY TYPE (THOUSAND UNITS) 2020-2030
TABLE 59 CHINA SMART DOOR LOCK MARKET BY PRODUCT (USD BILLION) 2020-2030
TABLE 60 CHINA SMART DOOR LOCK MARKET BY PRODUCT (THOUSAND UNITS) 2020-2030
TABLE 61 JAPAN SMART DOOR LOCK MARKET BY TYPE (USD BILLION) 2020-2030
TABLE 62 JAPAN SMART DOOR LOCK MARKET BY TYPE (THOUSAND UNITS) 2020-2030
TABLE 63 JAPAN SMART DOOR LOCK MARKET BY PRODUCT (USD BILLION) 2020-2030
TABLE 64 JAPAN SMART DOOR LOCK MARKET BY PRODUCT (THOUSAND UNITS) 2020-2030
TABLE 65 SOUTH KOREA SMART DOOR LOCK MARKET BY TYPE (USD BILLION) 2020-2030
TABLE 66 SOUTH KOREA SMART DOOR LOCK MARKET BY TYPE (THOUSAND UNITS) 2020-2030
TABLE 67 SOUTH KOREA SMART DOOR LOCK MARKET BY PRODUCT (USD BILLION) 2020-2030
TABLE 68 SOUTH KOREA SMART DOOR LOCK MARKET BY PRODUCT (THOUSAND UNITS) 2020-2030
TABLE 69 AUSTRALIA SMART DOOR LOCK MARKET BY TYPE (USD BILLION) 2020-2030
TABLE 70 AUSTRALIA SMART DOOR LOCK MARKET BY TYPE (THOUSAND UNITS) 2020-2030
TABLE 71 AUSTRALIA SMART DOOR LOCK MARKET BY PRODUCT (USD BILLION) 2020-2030
TABLE 72 AUSTRALIA SMART DOOR LOCK MARKET BY PRODUCT (THOUSAND UNITS) 2020-2030
TABLE 73 SOUTH-EAST ASIA SMART DOOR LOCK MARKET BY TYPE (USD BILLION) 2020-2030
TABLE 74 SOUTH-EAST ASIA SMART DOOR LOCK MARKET BY TYPE (THOUSAND UNITS) 2020-2030
TABLE 75 SOUTH-EAST ASIA SMART DOOR LOCK MARKET BY PRODUCT (USD BILLION) 2020-2030
TABLE 76 SOUTH-EAST ASIA SMART DOOR LOCK MARKET BY PRODUCT (THOUSAND UNITS) 2020-2030
TABLE 77 REST OF ASIA PACIFIC SMART DOOR LOCK MARKET BY TYPE (USD BILLION) 2020-2030
TABLE 78 REST OF ASIA PACIFIC SMART DOOR LOCK MARKET BY TYPE (THOUSAND UNITS) 2020-2030
TABLE 79 REST OF ASIA PACIFIC SMART DOOR LOCK MARKET BY PRODUCT (USD BILLION) 2020-2030
TABLE 80 REST OF ASIA PACIFIC SMART DOOR LOCK MARKET BY PRODUCT (THOUSAND UNITS) 2020-2030
TABLE 81 EUROPE SMART DOOR LOCK MARKET BY COUNTRY (USD BILLION) 2020-2030
TABLE 82 EUROPE SMART DOOR LOCK MARKET BY COUNTRY (THOUSAND UNITS) 2020-2030
TABLE 83 EUROPE SMART DOOR LOCK MARKET BY TYPE (USD BILLION) 2020-2030
TABLE 84 EUROPE SMART DOOR LOCK MARKET BY TYPE (THOUSAND UNITS) 2020-2030
TABLE 85 EUROPE SMART DOOR LOCK MARKET BY PRODUCT (USD BILLION) 2020-2030
TABLE 86 EUROPE SMART DOOR LOCK MARKET BY PRODUCT (THOUSAND UNITS) 2020-2030
TABLE 87 GERMANY SMART DOOR LOCK MARKET BY TYPE (USD BILLION) 2020-2030
TABLE 88 GERMANY SMART DOOR LOCK MARKET BY TYPE (THOUSAND UNITS) 2020-2030
TABLE 89 GERMANY SMART DOOR LOCK MARKET BY PRODUCT (USD BILLION) 2020-2030
TABLE 90 GERMANY SMART DOOR LOCK MARKET BY PRODUCT (THOUSAND UNITS) 2020-2030
TABLE 91 UK SMART DOOR LOCK MARKET BY TYPE (USD BILLION) 2020-2030
TABLE 92 UK SMART DOOR LOCK MARKET BY TYPE (THOUSAND UNITS) 2020-2030
TABLE 93 UK SMART DOOR LOCK MARKET BY PRODUCT (USD BILLION) 2020-2030
TABLE 94 UK SMART DOOR LOCK MARKET BY PRODUCT (THOUSAND UNITS) 2020-2030
TABLE 95 FRANCE SMART DOOR LOCK MARKET BY TYPE (USD BILLION) 2020-2030
TABLE 96 FRANCE SMART DOOR LOCK MARKET BY TYPE (THOUSAND UNITS) 2020-2030
TABLE 97 FRANCE SMART DOOR LOCK MARKET BY PRODUCT (USD BILLION) 2020-2030
TABLE 98 FRANCE SMART DOOR LOCK MARKET BY PRODUCT (THOUSAND UNITS) 2020-2030
TABLE 99 ITALY SMART DOOR LOCK MARKET BY TYPE (USD BILLION) 2020-2030
TABLE 100 ITALY SMART DOOR LOCK MARKET BY TYPE (THOUSAND UNITS) 2020-2030
TABLE 101 ITALY SMART DOOR LOCK MARKET BY PRODUCT (USD BILLION) 2020-2030
TABLE 102 ITALY SMART DOOR LOCK MARKET BY PRODUCT (THOUSAND UNITS) 2020-2030
TABLE 103 SPAIN SMART DOOR LOCK MARKET BY TYPE (USD BILLION) 2020-2030
TABLE 104 SPAIN SMART DOOR LOCK MARKET BY TYPE (THOUSAND UNITS) 2020-2030
TABLE 105 SPAIN SMART DOOR LOCK MARKET BY PRODUCT (USD BILLION) 2020-2030
TABLE 106 SPAIN SMART DOOR LOCK MARKET BY PRODUCT (THOUSAND UNITS) 2020-2030
TABLE 107 RUSSIA SMART DOOR LOCK MARKET BY TYPE (USD BILLION) 2020-2030
TABLE 108 RUSSIA SMART DOOR LOCK MARKET BY TYPE (THOUSAND UNITS) 2020-2030
TABLE 109 RUSSIA SMART DOOR LOCK MARKET BY PRODUCT (USD BILLION) 2020-2030
TABLE 110 RUSSIA SMART DOOR LOCK MARKET BY PRODUCT (THOUSAND UNITS) 2020-2030
TABLE 111 REST OF EUROPE SMART DOOR LOCK MARKET BY TYPE (USD BILLION) 2020-2030
TABLE 112 REST OF EUROPE SMART DOOR LOCK MARKET BY TYPE (THOUSAND UNITS) 2020-2030
TABLE 113 REST OF EUROPE SMART DOOR LOCK MARKET BY PRODUCT (USD BILLION) 2020-2030
TABLE 114 REST OF EUROPE SMART DOOR LOCK MARKET BY PRODUCT (THOUSAND UNITS) 2020-2030
TABLE 115 MIDDLE EAST AND AFRICA SMART DOOR LOCK MARKET BY COUNTRY (USD BILLION) 2020-2030
TABLE 116 MIDDLE EAST AND AFRICA SMART DOOR LOCK MARKET BY COUNTRY (THOUSAND UNITS) 2020-2030
TABLE 117 MIDDLE EAST AND AFRICA SMART DOOR LOCK MARKET BY TYPE (USD BILLION) 2020-2030
TABLE 118 MIDDLE EAST AND AFRICA SMART DOOR LOCK MARKET BY TYPE (THOUSAND UNITS) 2020-2030
TABLE 119 MIDDLE EAST AND AFRICA SMART DOOR LOCK MARKET BY PRODUCT (USD BILLION) 2020-2030
TABLE 120 MIDDLE EAST AND AFRICA SMART DOOR LOCK MARKET BY PRODUCT (THOUSAND UNITS) 2020-2030
TABLE 121 UAE SMART DOOR LOCK MARKET BY TYPE (USD BILLION) 2020-2030
TABLE 122 UAE SMART DOOR LOCK MARKET BY TYPE (THOUSAND UNITS) 2020-2030
TABLE 123 UAE SMART DOOR LOCK MARKET BY PRODUCT (USD BILLION) 2020-2030
TABLE 124 UAE SMART DOOR LOCK MARKET BY PRODUCT (THOUSAND UNITS) 2020-2030
TABLE 125 SAUDI ARABIA SMART DOOR LOCK MARKET BY TYPE (USD BILLION) 2020-2030
TABLE 126 SAUDI ARABIA SMART DOOR LOCK MARKET BY TYPE (THOUSAND UNITS) 2020-2030
TABLE 127 SAUDI ARABIA SMART DOOR LOCK MARKET BY PRODUCT (USD BILLION) 2020-2030
TABLE 128 SAUDI ARABIA SMART DOOR LOCK MARKET BY PRODUCT (THOUSAND UNITS) 2020-2030
TABLE 129 SOUTH AFRICA SMART DOOR LOCK MARKET BY TYPE (USD BILLION) 2020-2030
TABLE 130 SOUTH AFRICA SMART DOOR LOCK MARKET BY TYPE (THOUSAND UNITS) 2020-2030
TABLE 131 SOUTH AFRICA SMART DOOR LOCK MARKET BY PRODUCT (USD BILLION) 2020-2030
TABLE 132 SOUTH AFRICA SMART DOOR LOCK MARKET BY PRODUCT (THOUSAND UNITS) 2020-2030
TABLE 133 REST OF MIDDLE EAST AND AFRICA SMART DOOR LOCK MARKET BY TYPE (USD BILLION) 2020-2030
TABLE 134 REST OF MIDDLE EAST AND AFRICA SMART DOOR LOCK MARKET BY TYPE (THOUSAND UNITS) 2020-2030
TABLE 135 REST OF MIDDLE EAST AND AFRICA SMART DOOR LOCK MARKET BY PRODUCT (USD BILLION) 2020-2030
TABLE 136 REST OF MIDDLE EAST AND AFRICA SMART DOOR LOCK MARKET BY PRODUCT (THOUSAND UNITS) 2020-2030
LIST OF FIGURES
FIGURE 1 MARKET DYNAMICS
FIGURE 2 MARKET SEGMENTATION
FIGURE 3 REPORT TIMELINES: YEARS CONSIDERED
FIGURE 4 DATA TRIANGULATION
FIGURE 5 BOTTOM-UP APPROACH
FIGURE 6 TOP-DOWN APPROACH
FIGURE 7 RESEARCH FLOW
FIGURE 8 GLOBAL SMART DOOR LOCK MARKET BY TYPE (USD BILLION) 2020-2030
FIGURE 9 GLOBAL SMART DOOR LOCK MARKET BY PRODUCT (USD BILLION) 2020-2030
FIGURE 11 GLOBAL SMART DOOR LOCK MARKET BY REGION (USD BILLION) 2020-2030
FIGURE 12 PORTER’S FIVE FORCES MODEL
FIGURE 13 GLOBAL SMART DOOR LOCK MARKET BY TYPE (USD BILLION) 2022
FIGURE 14 GLOBAL SMART DOOR LOCK MARKET BY PRODUCT (USD BILLION) 2022
FIGURE 16 GLOBAL SMART DOOR LOCK MARKET BY REGION (USD BILLION) 2022
FIGURE 17 MARKET SHARE ANALYSIS
FIGURE 18 ASSA ABLOY: COMPANY SNAPSHOT
FIGURE 19 ALLEGION: COMPANY SNAPSHOT
FIGURE 20 DORMAKABA: COMPANY SNAPSHOT
FIGURE 21 SAMSUNG SDS: COMPANY SNAPSHOT
FIGURE 22 HONEYWELL: COMPANY SNAPSHOT
FIGURE 23 SCHLAGE: COMPANY SNAPSHOT
FIGURE 24 AUGUST HOME: COMPANY SNAPSHOT
FIGURE 25 KWIKSET: COMPANY SNAPSHOT
FIGURE 26 ULTRALOQ: COMPANY SNAPSHOT
FIGURE 27 GATE LABS: COMPANY SNAPSHOT
FIGURE 28 NUKI: COMPANY SNAPSHOT
FIGURE 29 IGLOOHOME: COMPANY SNAPSHOT
FIGURE 30 LOCKITRON: COMPANY SNAPSHOT
FIGURE 31 DANALOCK: COMPANY SNAPSHOT
FIGURE 32 SALTO SYSTEMS: COMPANY SNAPSHOT
FIGURE 33 AVENTSECURITY: COMPANY SNAPSHOT
FIGURE 34 XEEDER: COMPANY SNAPSHOT
FIGURE 35 HAVEN: COMPANY SNAPSHOT
FIGURE 36 PANASONIC: COMPANY SNAPSHOT
FIGURE 37 YALE: COMPANY SNAPSHOT
DOWNLOAD FREE SAMPLE REPORT
License Type
SPEAK WITH OUR ANALYST
Want to know more about the report or any specific requirement?
WANT TO CUSTOMIZE THE REPORT?
Our Clients Speak
We asked them to research ‘ Equipment market’ all over the world, and their whole arrangement was helpful to us. thehealthanalytics.com insightful analysis and reports contributed to our current analysis and in creating a future strategy. Besides, the te
Yosuke Mitsui
Senior Associate Construction Equipment Sales & Marketing
We asked them to research ‘Equipment market’ all over the world, and their whole arrangement was helpful to us. thehealthanalytics.com insightful analysis and reports contributed to our current analysis and in creating a future strategy. Besides, the te


