

Base Year Value ()
x.x %
x.x %
CAGR ()
x.x %
x.x %
Forecast Year Value ()
x.x %
x.x %
Historical Data Period
Largest Region
Forecast Period
Mercato dell'allumina per tipo (allumina ad alta purezza 4N (HPA), allumina ad alta purezza 5N (HPA), allumina ad alta purezza 6N (HPA)), tecnologia (idrolisi, lisciviazione con acido cloridrico), applicazione (lampadine a LED, substrato semiconduttore, batterie agli ioni di litio, lenti ottiche, dispositivi biomedici, altri) e regione (Nord America, Europa, Asia Pacifico, Sud America, Medio Oriente e Africa), tendenze globali e previsioni dal 2023 al 2029
Instant access to hundreds of data points and trends
- Market estimates from 2014-2029
- Competitive analysis, industry segmentation, financial benchmarks
- Incorporates SWOT, Porter's Five Forces and risk management frameworks
- PDF report or online database with Word, Excel and PowerPoint export options
- 100% money back guarantee
Panoramica del mercato dell'allumina
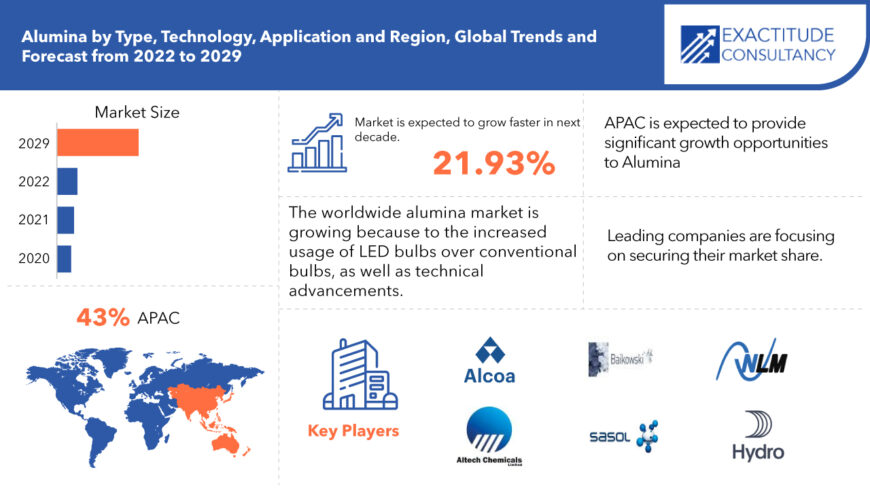
Il mercato globale dell'allumina ammonta a 1,56 miliardi di dollari nel 2020 e si prevede che crescerà fino a 9,06 miliardi di dollari entro il 2029, con un tasso di crescita annuale composto (CAGR) del 21,93%.
L'ossido di alluminio, o allumina, è una sostanza chimica cristallina bianca ricavata principalmente dal minerale bauxite. È impiegata in una varietà di applicazioni tecniche, come materiali anticorrosione, componenti resistenti all'usura e all'abrasione e il settore elettronico. L'allumina è un prodotto conveniente con caratteristiche di qualità come elevata durevolezza, luminosità, bassa radiazione termica e stabilità alle alte temperature.
Il mercato mondiale dell'allumina sta crescendo grazie al maggiore utilizzo di lampadine a LED rispetto a quelle convenzionali, nonché ai progressi tecnici. Nelle economie in crescita come Cina e India, la domanda di luci a LED è piuttosto forte. Per ridurre il consumo energetico del paese, i governi di queste nazioni hanno esortato i cittadini ad adottare un'illuminazione a risparmio energetico. Inoltre, entro la fine del 2018, il governo indiano aveva distribuito 210 milioni di lampadine a LED in tutto il paese e aveva avviato contratti per progetti di conversione dell'illuminazione stradale a LED. Inoltre, per soddisfare i criteri di offerta per reddito, capacità produttiva e capacità di fabbricazione, gli offerenti multinazionali stanno formando joint venture con aziende di illuminazione locali.
| ATTRIBUTO | DETTAGLI |
| Periodo di studio | 2022-2029 |
| Anno base | 2022 |
| Anno stimato | 2023 |
| Anno previsto | 2023-2029 |
| Periodo storico | 2018-2022 |
| Unità | Valore (milioni di USD) |
| Segmentazione | Per tipo, per tecnologia, per applicazione, per regione |
| Per tipo |
|
| Per tecnologia |
|
| Per applicazione |
|
| Per regione |
|
La crescente domanda di HPA in tutto il mondo, insieme al sostegno del governo, ha portato a un aumento dell'adozione di LED, spingendo in avanti il mercato globale di HPA. L'allumina con una purezza di 4N è utilizzata anche nella produzione di batterie agli ioni di litio. I produttori di automobili si stanno concentrando sulla produzione di veicoli elettrici (EV) a seguito delle normative ambientali imposte dai governi di diversi paesi sviluppati e in via di sviluppo, tra cui Stati Uniti, Germania, Cina e India, per ridurre l'inquinamento e la dipendenza da fonti di carburante convenzionali. È probabile che la necessità di batterie agli ioni di litio per auto elettriche aumenti di conseguenza. È probabile che i produttori di batterie agli ioni di litio aumentino la loro necessità di allumina ad alta purezza a causa di questo problema.
Tuttavia, l'aumento dei prezzi dell'HPA e le rigide limitazioni governative sull'estrazione di "fango rosso" potrebbero limitare la crescita del mercato mondiale dell'allumina ad alta purezza. La crescente domanda di allumina ad alta purezza da parte di economie in crescita come Cina e India, dovuta a un aumento della domanda di lampadine a LED e a un settore medico in rapida espansione, dovrebbe fornire prospettive redditizie per la crescita del mercato dell'allumina ad alta purezza nel prossimo futuro.
[caption id="allegato_12450" align="aligncenter" width="870"]
Frequently Asked Questions
What is the worth of global Alumina market?
The Alumina market size had crossed USD 1.56 Billion in 2022.
Which is the largest regional market for Alumina market?
The Largest Regional market for Alumina market is APAC having a market share of 43%.
What is the CAGR of Alumina market?
The global Alumina market registered a CAGR of 21.93% from 2023 to 2029.
Which are the top companies to hold the market share in Alumina market?
Key players profiled in the report include are Sasol Ltd., Sumitomo Chemical Co. Ltd, Nippon Light Mryal Holdings Company Ltd., Alocoa Corporation, and Altech Chemicals.
What is the study period in this market?
The study period for Alumina market is from 2022-2029
Alumina Market Segment Analysis
The Alumina market is segmented by type, Technology and Application
On the basis of Type, global Alumina market is segmented into, 4N high purity alumina (HPA), 5N high purity alumina (HPA), 6N high purity alumina (HPA). The 4N high purity alumina sector had a huge portion of the alumina market. LED bulbs and electrical displays are the most common uses for 4N HPA. Leading businesses in this market are investing more in R&D to customize products to meet the needs of certain application sectors. During the forecast period, the market for 4N HPA is likely to be driven by government backing, which will lead to more LED use and lower costs than other forms of HPA.
On the basis of Technology, global Alumina market is segmented into, Hydrolysis, Hydrochloric Acid Leaching. The hydrolysis sector accounted for a significant portion of the high purity alumina market. Alumina refineries all over the world have boosted their output to fulfil the rising demand for primary aluminum. Since a result, demand for hydrolysis technology to extract alumina has increased dramatically, as this technology also aids in the recovery of acid, which can be reused, lowering operating costs. Additionally, it aids in the personalization of HPA products for end customers. These factors are expected to boost demand for hydrolysis technology to extract alumina, resulting in the worldwide high purity alumina market expanding.
[caption id="attachment_12451" align="aligncenter" width="680"]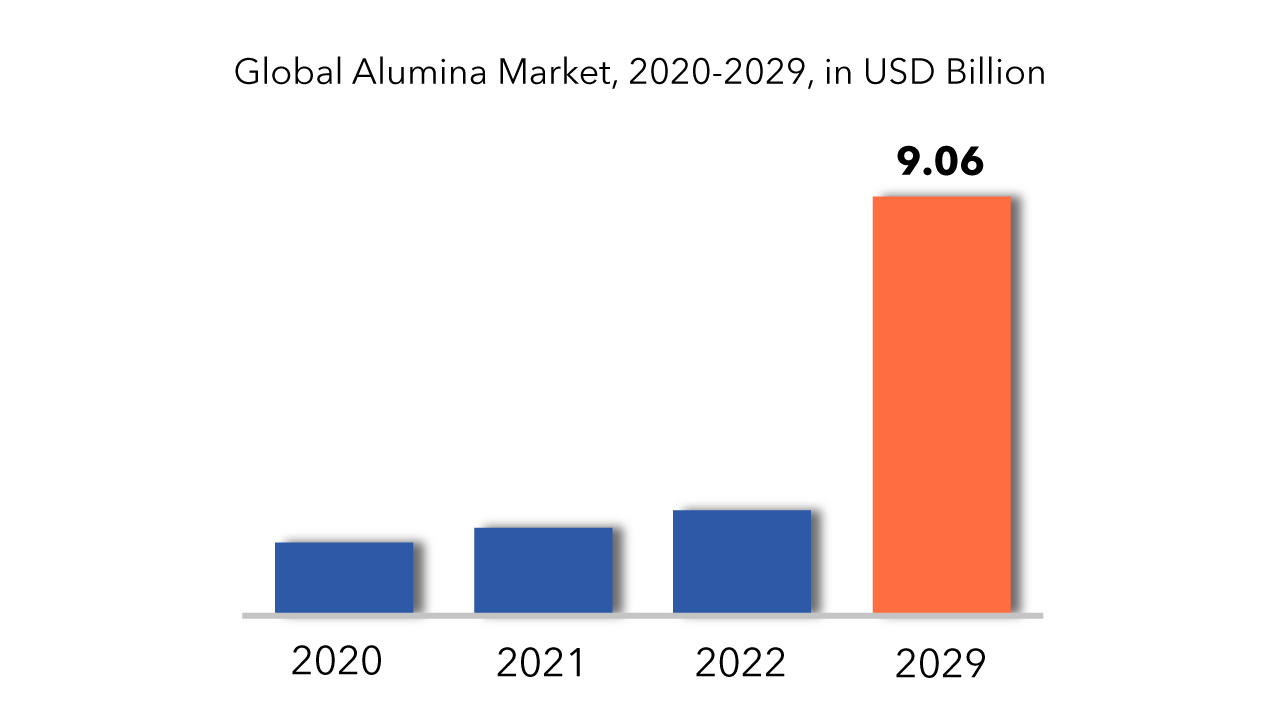
On the basis of Application, global Alumina market is segmented into, LED Bulbs, Semiconductor Substrate, Li-ion Batteries, Optical Lenses, Bio Medical Devices, Others. The LED bulb industry accounts for a significant portion of the high purity alumina market. In compared to traditional incandescent bulbs, demand for LED bulbs has increased dramatically over the world. The deployment of energy-efficient lighting around the globe is fueled by the implementation of severe standards. Furthermore, a government campaign to encourage people to adopt LED lights to save energy is expected to raise demand for LED bulbs. Furthermore, multinational firms are developing joint ventures with local lighting companies in order to expand production capacity and manufacturing capabilities in order to fulfil the country's rising demand for LED bulbs. Increased demand for HPA throughout the world, along with government backing, has resulted in a rise in LED adoption, propelling the global HPA market forward.
Alumina Market Players
The Key Players in Alumina Market are Sasol Ltd., Sumitomo Chemical Co. Ltd, Nippon Light Mryal Holdings Company Ltd., Alcoa Corporation, and Altech Chemicals.
To increase their market position, these businesses have implemented a variety of growth tactics. These companies are using expansion, new Technology development, mergers and acquisitions, and cooperation as important growth strategies to improve their Technology range and geographical presence in order to fulfil the rising demand for Alumina from emerging nations.
Industry Development:- In January 2019, Vedanta Limited, a mining company based in India and a major alumina market player, planned to increase its capital expenditure to $250–$300 million in order to raise the production capacity of its Lanjigarh alumina refinery in Odisha. The refinery expansion is aimed at reducing Vedanta's dependence on imported alumina and also lead to decreased aluminum production costs.
Who Should Buy? Or Key Stakeholders
- Industry and consulting firms
- State and national regulatory authorities
- Investors
- Suppliers and Distributors
- Research Institutes
- Others
Alumina Market Regional Analysis
Geographically, Alumina market is segmented into North America, Europe, Asia Pacific, and Rest of the world.
- North America: includes the US, Canada, Mexico
- Europe: includes UK, Germany, France, Italy, Spain, Russia, and Rest of Europe
- Asia Pacific: includes China, Japan, South Korea, India, Australia, ASEAN and Rest of APAC
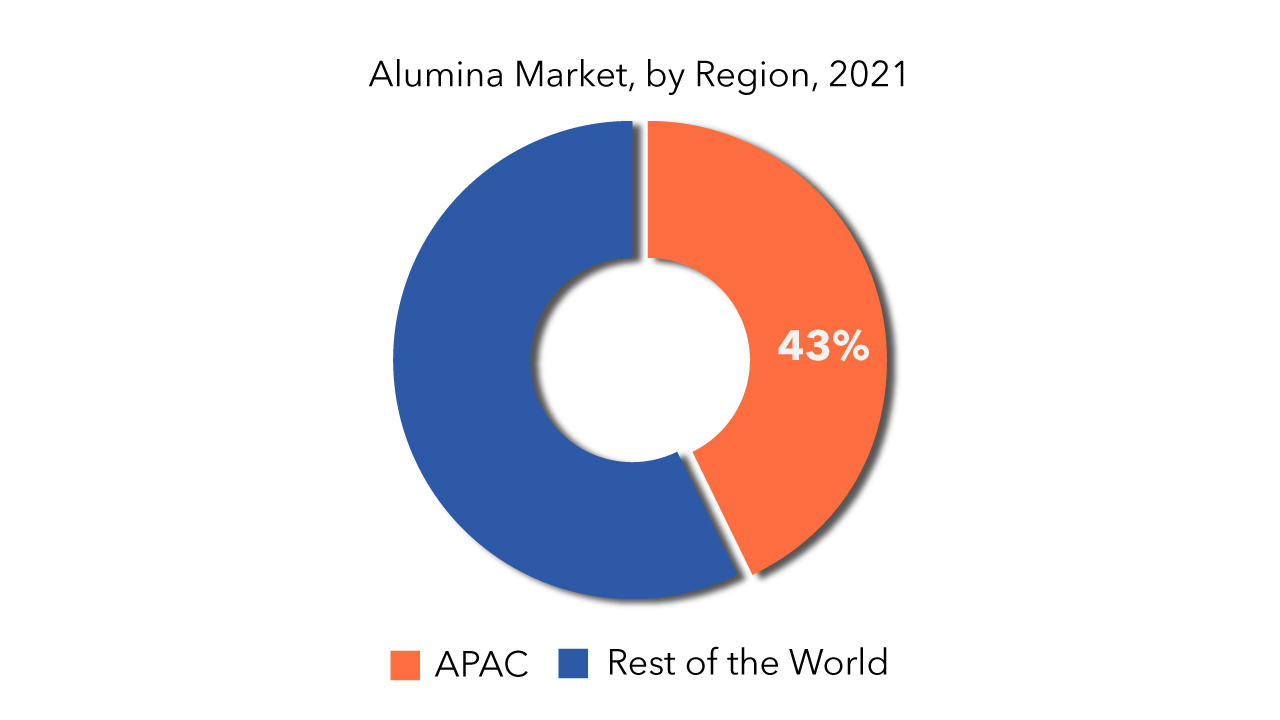
Due to the rise of economies such as China and India, Asia-Pacific accounted for a significant portion of the market. The presence of established HPA companies in the region, as well as increased demand for HPA from the automotive and electronics sectors, are projected to boost HPA demand in the region. Furthermore, the government's strict controls on the manufacturing, import, and sale of incandescent lights have fueled the expansion of the smart lighting business, which makes LED bulbs, increasing demand for HPA across the area.
Key Market Segments: Alumina Market
Alumina Market by Type, 2022-2029, (USD Millions)- 4n High Purity Alumina (Hpa)
- 5n High Purity Alumina (Hpa)
- 6n High Purity Alumina (Hpa)
- Hydrolysis
- Hydrochloric Acid Leaching
- Led Bulbs
- Semiconductor Substrate
- Li-Ion Batteries
- Optical Lenses
- Bio Medical Devices
- Others
- North America
- Europe
- Apac
- Mea
- Latin America
[video width="1920" height="1080" mp4="https://gwsdigital.com/exactitudeconsultancy/wp-content/uploads/2023/01/Alumina-Market.mp4" poster="https://gwsdigital.com/exactitudeconsultancy/wp-content/uploads/2022/02/exactitude-1-3.jpg"][/video]
Key Question Answered
- What is the current market size of this high growth market?
- What is the overall growth rate?
- What are the key growth areas, Applications, end uses and types?
- Key reasons for growth
- Challenges for growth
- What technological developments are happening in this area?
- Introduzione
- Definizione di mercato
- Segmentazione del mercato
- Cronologie della ricerca
- Presupposti e limitazioni
- Metodologia di ricerca
- Estrazione dei dati
- Ricerca secondaria
- Ricerca primaria
- Consigli degli esperti in materia
- Controlli di qualità
- Revisione finale
- Triangolazione dei dati
- Approccio dal basso verso l'alto
- Approccio dall'alto verso il basso
- Flusso di ricerca
- Fonti dei dati
- Estrazione dei dati
- Sintesi
- Panoramica del mercato
- Prospettive del mercato globale dell'allumina
- Fattori trainanti del mercato
- Limitazioni di mercato
- Opportunità di mercato
- Impatto del Covid-19 sul mercato globale dell'allumina
- Prospettive del mercato globale dell'allumina
- Mercato globale dell'allumina per tipo, (milioni di USD)
- Allumina ad alta purezza 4N (HPA)
- Allumina ad alta purezza 5N (HPA)
- Allumina ad alta purezza 6N (HPA)
- Mercato globale dell'allumina per tecnologia (milioni di USD )
- Idrolisi
- Lisciviazione con acido cloridrico
- Mercato globale dell'allumina per applicazione (milioni di USD)
- Lampadine a led
- Substrato semiconduttore
- Batterie agli ioni di litio
- Lenti ottiche
- Dispositivi biomedici
- Altri
- Mercato globale dell'allumina per regione (milioni di USD)
- Introduzione
- Asia-Pacifico
- Cina
- India
- Giappone
- Corea del Sud
- Australia
- Asia sud-orientale
- Resto dell'Asia-Pacifico
- America del Nord
- Stati Uniti
- Canada
- Messico
- Europa
- Germania
- Regno Unito
- Francia
- Italia
- Spagna
- Russia
- Resto d'Europa
- Sud America
- Brasile
- Argentina
- Colombia
- Resto del Sud America
- Medio Oriente e Africa
- Emirati Arabi Uniti
- Arabia Saudita
- Sudafrica
- Resto del Medio Oriente e Africa
- Profili aziendali* (panoramica aziendale, istantanea aziendale, tipologie offerte, sviluppi recenti)
- Società Alcoa
- Altech Chemicals Ltd.
- Baikovskij sas
- Hebei Pengda Advanced Materials Technology Co., Ltd
- Nippon light metal holdings company, ltd
- Norsk Hydro ASA
- Sasol srl
- Sumitomo Chemical Co., Ltd.
- Xuancheng jingrui nuovo materiale co., ltd
*L'elenco delle aziende è indicativo
ELENCO DELLE TABELLE
TABLE 1 GLOBAL ALUMINA MARKET BY TYPE (USD MILLIONS) 2020-2029
TABLE 2 GLOBAL ALUMINA MARKET BY TECHNOLOGY (USD MILLIONS) 2020-2029
TABLE 3 GLOBAL ALUMINA MARKET BY APPLICATION (USD MILLIONS) 2020-2029
TABLE 4 GLOBAL ALUMINA MARKET BY REGION (USD MILLIONS) 2020-2029
TABLE 5 US ALUMINA MARKET BY TYPE (USD MILLIONS) 2020-2029
TABLE 6 US ALUMINA MARKET BY TECHNOLOGY (USD MILLIONS) 2020-2029
TABLE 7 US ALUMINA MARKET BY APPLICATION (USD MILLIONS) 2020-2029
TABLE 8 CANADA ALUMINA MARKET BY TYPE (USD MILLIONS) 2020-2029
TABLE 9 CANADA ALUMINA MARKET BY TECHNOLOGY (USD MILLIONS) 2020-2029
TABLE 10 CANADA ALUMINA MARKET BY APPLICATION (USD MILLIONS) 2020-2029
TABLE 11 MEXICO ALUMINA MARKET BY TYPE (USD MILLIONS) 2020-2029
TABLE 12 MEXICO ALUMINA MARKET BY TECHNOLOGY (USD MILLIONS) 2020-2029
TABLE 13 MEXICO ALUMINA MARKET BY APPLICATION (USD MILLIONS) 2020-2029
TABLE 14 BRAZIL ALUMINA MARKET BY TYPE (USD MILLIONS) 2020-2029
TABLE 15 BRAZIL ALUMINA MARKET BY TECHNOLOGY (USD MILLIONS) 2020-2029
TABLE 16 BRAZIL ALUMINA MARKET BY APPLICATION (USD MILLIONS) 2020-2029
TABLE 17 ARGENTINA ALUMINA MARKET BY TYPE (USD MILLIONS) 2020-2029
TABLE 18 ARGENTINA ALUMINA MARKET BY TECHNOLOGY (USD MILLIONS) 2020-2029
TABLE 19 ARGENTINA ALUMINA MARKET BY APPLICATION (USD MILLIONS) 2020-2029
TABLE 20 COLOMBIA ALUMINA MARKET BY TYPE (USD MILLIONS) 2020-2029
TABLE 21 COLOMBIA ALUMINA MARKET BY TECHNOLOGY (USD MILLIONS) 2020-2029
TABLE 22 COLOMBIA ALUMINA MARKET BY APPLICATION (USD MILLIONS) 2020-2029
TABLE 23 REST OF SOUTH AMERICA ALUMINA MARKET BY TYPE (USD MILLIONS) 2020-2029
TABLE 24 REST OF SOUTH AMERICA ALUMINA MARKET BY TECHNOLOGY (USD MILLIONS) 2020-2029
TABLE 25 REST OF SOUTH AMERICA ALUMINA MARKET BY APPLICATION (USD MILLIONS) 2020-2029
TABLE 26 INDIA ALUMINA MARKET BY TYPE (USD MILLIONS) 2020-2029
TABLE 27 INDIA ALUMINA MARKET BY TECHNOLOGY (USD MILLIONS) 2020-2029
TABLE 28 INDIA ALUMINA MARKET BY APPLICATION (USD MILLIONS) 2020-2029
TABLE 29 CHINA ALUMINA MARKET BY TYPE (USD MILLIONS) 2020-2029
TABLE 30 CHINA ALUMINA MARKET BY TECHNOLOGY (USD MILLIONS) 2020-2029
TABLE 31 CHINA ALUMINA MARKET BY APPLICATION (USD MILLIONS) 2020-2029
TABLE 32 JAPAN ALUMINA MARKET BY TYPE (USD MILLIONS) 2020-2029
TABLE 33 JAPAN ALUMINA MARKET BY TECHNOLOGY (USD MILLIONS) 2020-2029
TABLE 34 JAPAN ALUMINA MARKET BY APPLICATION (USD MILLIONS) 2020-2029
TABLE 35 SOUTH KOREA ALUMINA MARKET BY TYPE (USD MILLIONS) 2020-2029
TABLE 36 SOUTH KOREA ALUMINA MARKET BY TECHNOLOGY (USD MILLIONS) 2020-2029
TABLE 37 SOUTH KOREA ALUMINA MARKET BY APPLICATION (USD MILLIONS) 2020-2029
TABLE 38 AUSTRALIA ALUMINA MARKET BY TYPE (USD MILLIONS) 2020-2029
TABLE 39 AUSTRALIA ALUMINA MARKET BY TECHNOLOGY (USD MILLIONS) 2020-2029
TABLE 40 AUSTRALIA ALUMINA MARKET BY APPLICATION (USD MILLIONS) 2020-2029
TABLE 41 SOUTH-EAST ASIA ALUMINA MARKET BY TYPE (USD MILLIONS) 2020-2029
TABLE 42 SOUTH-EAST ASIA ALUMINA MARKET BY TECHNOLOGY (USD MILLIONS) 2020-2029
TABLE 43 SOUTH-EAST ASIA ALUMINA MARKET BY APPLICATION (USD MILLIONS) 2020-2029
TABLE 44 REST OF ASIA PACIFIC ALUMINA MARKET BY TYPE (USD MILLIONS) 2020-2029
TABLE 45 REST OF ASIA PACIFIC ALUMINA MARKET BY TECHNOLOGY (USD MILLIONS) 2020-2029
TABLE 46 REST OF ASIA PACIFIC ALUMINA MARKET BY APPLICATION (USD MILLIONS) 2020-2029
TABLE 47 GERMANY ALUMINA MARKET BY TYPE (USD MILLIONS) 2020-2029
TABLE 48 GERMANY ALUMINA MARKET BY TECHNOLOGY (USD MILLIONS) 2020-2029
TABLE 49 GERMANY ALUMINA MARKET BY APPLICATION (USD MILLIONS) 2020-2029
TABLE 50 UK ALUMINA MARKET BY TYPE (USD MILLIONS) 2020-2029
TABLE 51 UK ALUMINA MARKET BY TECHNOLOGY (USD MILLIONS) 2020-2029
TABLE 52 UK ALUMINA MARKET BY APPLICATION (USD MILLIONS) 2020-2029
TABLE 53 FRANCE ALUMINA MARKET BY TYPE (USD MILLIONS) 2020-2029
TABLE 54 FRANCE ALUMINA MARKET BY TECHNOLOGY (USD MILLIONS) 2020-2029
TABLE 55 FRANCE ALUMINA MARKET BY APPLICATION (USD MILLIONS) 2020-2029
TABLE 56 ITALY ALUMINA MARKET BY TYPE (USD MILLIONS) 2020-2029
TABLE 57 ITALY ALUMINA MARKET BY TECHNOLOGY (USD MILLIONS) 2020-2029
TABLE 58 ITALY ALUMINA MARKET BY APPLICATION (USD MILLIONS) 2020-2029
TABLE 59 SPAIN ALUMINA MARKET BY TYPE (USD MILLIONS) 2020-2029
TABLE 60 SPAIN ALUMINA MARKET BY TECHNOLOGY (USD MILLIONS) 2020-2029
TABLE 61 SPAIN ALUMINA MARKET BY APPLICATION (USD MILLIONS) 2020-2029
TABLE 62 RUSSIA ALUMINA MARKET BY TYPE (USD MILLIONS) 2020-2029
TABLE 63 RUSSIA ALUMINA MARKET BY TECHNOLOGY (USD MILLIONS) 2020-2029
TABLE 64 RUSSIA ALUMINA MARKET BY APPLICATION (USD MILLIONS) 2020-2029
TABLE 65 REST OF EUROPE ALUMINA MARKET BY TYPE (USD MILLIONS) 2020-2029
TABLE 66 REST OF EUROPE ALUMINA MARKET BY TECHNOLOGY (USD MILLIONS) 2020-2029
TABLE 67 REST OF EUROPE ALUMINA MARKET BY APPLICATION (USD MILLIONS) 2020-2029
TABLE 68 UAE ALUMINA MARKET BY TYPE (USD MILLIONS) 2020-2029
TABLE 69 UAE ALUMINA MARKET BY TECHNOLOGY (USD MILLIONS) 2020-2029
TABLE 70 UAE ALUMINA MARKET BY APPLICATION (USD MILLIONS) 2020-2029
TABLE 71 SAUDI ARABIA ALUMINA MARKET BY TYPE (USD MILLIONS) 2020-2029
TABLE 72 SAUDI ARABIA ALUMINA MARKET BY TECHNOLOGY (USD MILLIONS) 2020-2029
TABLE 73 SAUDI ARABIA ALUMINA MARKET BY APPLICATION (USD MILLIONS) 2020-2029
TABLE 74 SOUTH AFRICA ALUMINA MARKET BY TYPE (USD MILLIONS) 2020-2029
TABLE 75 SOUTH AFRICA ALUMINA MARKET BY TECHNOLOGY (USD MILLIONS) 2020-2029
TABLE 76 SOUTH AFRICA ALUMINA MARKET BY APPLICATION (USD MILLIONS) 2020-2029
TABLE 77 REST OF MIDDLE EAST AND AFRICA ALUMINA MARKET BY TYPE (USD MILLIONS) 2020-2029
TABLE 78 REST OF MIDDLE EAST AND AFRICA ALUMINA MARKET BY TECHNOLOGY (USD MILLIONS) 2020-2029
TABLE 79 REST OF MIDDLE EAST AND AFRICA ALUMINA MARKET BY APPLICATION (USD MILLIONS) 2020-2029
LIST OF FIGURES
FIGURE 1 MARKET DYNAMICS
FIGURE 2 MARKET SEGMENTATION
FIGURE 3 REPORT TIMELINES: YEARS CONSIDERED
FIGURE 4 DATA TRIANGULATION
FIGURE 5 BOTTOM-UP APPROACH
FIGURE 6 TOP-DOWN APPROACH
FIGURE 7 RESEARCH FLOW
FIGURE 8 GLOBAL ALUMINA MARKET BY TYPE, USD MILLION, 2020-2029
FIGURE 9 GLOBAL ALUMINA MARKET BY TECHNOLOGY, USD MILLION, 2020-2029
FIGURE 10 GLOBAL ALUMINA MARKET BY REGION, USD MILLION, 2020-2029
FIGURE 11 PORTER’S FIVE FORCES TECHNOLOGYL
FIGURE 12 GLOBAL ALUMINA MARKET BY TYPE, USD MILLION, 2020-2029
FIGURE 13 GLOBAL ALUMINA MARKET BY TECHNOLOGY, USD MILLION, 2020-2029
FIGURE 14 GLOBAL ALUMINA MARKET BY REGION, USD MILLION, 2020-2029
FIGURE 15 ALUMINA MARKET BY REGION 2020
FIGURE 16 MARKET SHARE ANALYSIS
FIGURE 17 ALCOA CORPORATION COMPANY SNAPSHOT
FIGURE 18 ALTECH CHEMICALS LTD COMPANY SNAPSHOT
FIGURE 19 BAIKOWSKI SAS COMPANY SNAPSHOT
FIGURE 20 HEBEI PENGDA ADVANCED MATERIALS TECHNOLOGY CO., LTD COMPANY SNAPSHOT
FIGURE 21 NIPPON LIGHT METAL HOLDINGS COMPANY, LTD COMPANY SNAPSHOT
FIGURE 22 NORSK HYDRO ASA COMPANY SNAPSHOT
FIGURE 23 SASOL LTD COMPANY SNAPSHOT
FIGURE 24 SUMITOMO CHEMICAL CO., LTD COMPANY SNAPSHOT
FIGURE 25 XUANCHENG JINGRUI NEW MATERIAL CO., LTD COMPANY SNAPSHOT
DOWNLOAD FREE SAMPLE REPORT
License Type
SPEAK WITH OUR ANALYST
Want to know more about the report or any specific requirement?
WANT TO CUSTOMIZE THE REPORT?
Our Clients Speak
We asked them to research ‘ Equipment market’ all over the world, and their whole arrangement was helpful to us. thehealthanalytics.com insightful analysis and reports contributed to our current analysis and in creating a future strategy. Besides, the te
Yosuke Mitsui
Senior Associate Construction Equipment Sales & Marketing
We asked them to research ‘Equipment market’ all over the world, and their whole arrangement was helpful to us. thehealthanalytics.com insightful analysis and reports contributed to our current analysis and in creating a future strategy. Besides, the te


