

Base Year Value ()
x.x %
x.x %
CAGR ()
x.x %
x.x %
Forecast Year Value ()
x.x %
x.x %
Historical Data Period
Largest Region
Forecast Period
Mercato dei caricabatterie ad alta potenza CC per potenza in uscita (da 10 KW a 100 KW, inferiore a 10 KW e superiore a 100 KW), per applicazione (industriale, automobilistica ed elettronica di consumo) e regione, tendenze globali e previsioni dal 2023 al 2029
Instant access to hundreds of data points and trends
- Market estimates from 2014-2029
- Competitive analysis, industry segmentation, financial benchmarks
- Incorporates SWOT, Porter's Five Forces and risk management frameworks
- PDF report or online database with Word, Excel and PowerPoint export options
- 100% money back guarantee
Panoramica del mercato dei caricabatterie ad alta potenza CC
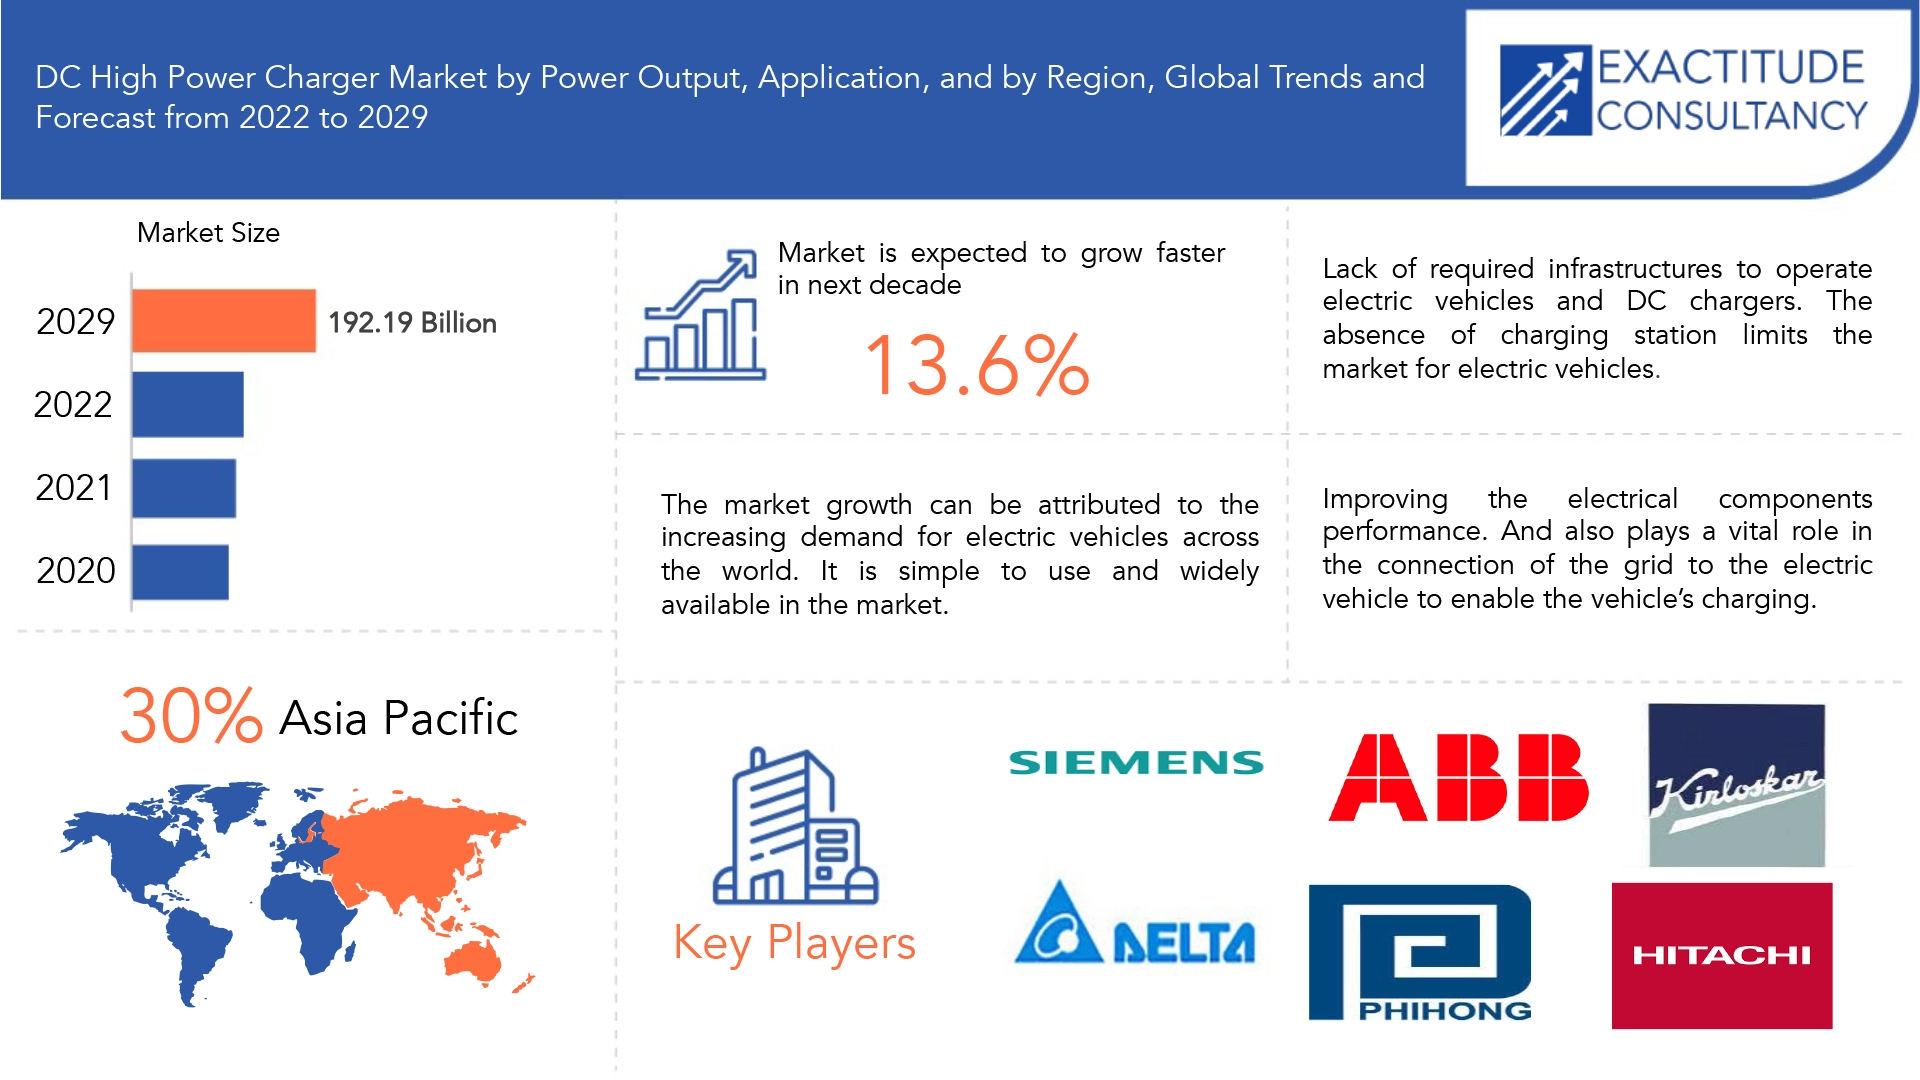
Si prevede che il mercato dei caricabatterie ad alta potenza DC crescerà al 13,6% di CAGR dal 2023 al 2029. Si prevede che raggiungerà oltre 192,19 miliardi di USD entro il 2029 dai 61 miliardi di USD del 2022.
"DC" si riferisce a "corrente continua", il tipo di alimentazione utilizzata dalle batterie. Le stazioni di ricarica di livello 2 utilizzano "AC" o "corrente alternativa", che troverai facilmente nelle normali prese domestiche. I veicoli elettrici hanno caricabatterie di bordo all'interno dell'auto che convertono l'alimentazione CA in CC per la batteria. Ciò significa che può alimentare direttamente la batteria dell'auto e non ha bisogno del caricabatterie di bordo per convertirla. I caricabatterie CC sono più grandi, più veloci e rappresentano un'entusiasmante innovazione quando si tratta di veicoli elettrici.
A questo scopo, l'EV incorpora un caricabatterie integrato. I caricabatterie CC forniscono alimentazione CC. Le batterie CC sono impiegate in applicazioni automobilistiche e industriali oltre a caricare le batterie per i gadget elettrici. Trasformano il segnale di ingresso in un segnale di uscita CC. I caricabatterie CC sono il tipo di caricabatterie preferito per la maggior parte delle apparecchiature elettroniche. Uno dei principali vantaggi del caricabatterie CC è che è molto facile da distribuire. Ma l'assenza di stazioni di ricarica limita il mercato dei veicoli elettrici . Una nazione ha bisogno di un numero sostanziale di stazioni di ricarica. Ci sono opportunità nel migliorare le prestazioni dei componenti elettrici. E svolge anche un ruolo fondamentale nella connessione della rete al veicolo elettrico per consentire la ricarica del veicolo.
| ATTRIBUTO | DETTAGLI |
| Periodo di studio | 2023-2029 |
| Anno base | 2022 |
| Anno stimato | 2023 |
| Anno previsto | 2023-2029 |
| Periodo storico | 2018-2022 |
| Unità | Valore (MILIARDI DI USD), (MIGLIAIA DI UNITÀ). |
| Segmentazione | Per potenza in uscita, per applicazione, per regione |
| Per potenza in uscita |
|
| Per applicazione |
|
| Per regione |
|
L'infrastruttura per la ricarica dei veicoli elettrici si è evoluta per tenere il passo con il crescente numero di marchi, modelli e tipi di automobili con pacchi batteria sempre più grandi. Ora ci sono più alternative per le sedi delle flotte, le attività commerciali e l'uso pubblico.
Telefoni cellulari, laptop, tablet e altri dispositivi elettronici indossabili sono tra i dispositivi elettronici portatili che vengono rapidamente caricati tramite caricabatterie CC. Con l'aumento della domanda di questi gadget portatili, si prevede che i ricavi generati dal mercato mondiale dei caricabatterie CC aumenteranno in modo significativo. Smartphone, computer, tablet, veicoli elettrici e macchinari commerciali necessitano tutti di cariche CC. I caricabatterie CC per veicoli elettrici sono un'ultima innovazione nel settore automobilistico. I caricabatterie CC per veicoli elettrici hanno reso possibile coprire una distanza di 350 km e oltre con una singola carica.
Uno dei maggiori rischi per l'economia mondiale odierna è la continua diffusione del COVID-19, che sta causando difficoltà finanziarie a persone, aziende e comunità ovunque. La "nuova normalità" ha reso difficile gestire le attività quotidiane, il lavoro di routine, le esigenze e le forniture, il che ha portato a progetti ritardati e occasioni perse. La "nuova normalità" include anche il lavoro da casa e l'isolamento sociale. L'epidemia di COVID-19 sta avendo un effetto sulla società e sull'economia globale. Gli effetti di questa pandemia si stanno diffondendo quotidianamente e stanno anche avendo un effetto sulla catena di fornitura. Il mercato azionario sta diventando poco chiaro, le aziende stanno perdendo fiducia, la catena di fornitura è ostacolata e l'ansia dei consumatori sta aumentando.
[caption id="allegato_13922" align="aligncenter" width="1920"]
Frequently Asked Questions
• What is the worth of DC High Power Charger Market?
The DC High Power Charger Market is expected to grow at 13.6% CAGR from 2023 to 2029. It is expected to reach above USD 192.19 Billion by 2029 from USD 61 Billion in 2022.
• What is the size of the Asia Pacific in DC High Power Charger Market?
Asia Pacific held more than 30% of the DC High Power Charger Market revenue share in 2022 and will witness expansion in the forecast period.
• What are some of the DC High Power Charger market's driving forces?
Increased sales of electric vehicles and an increase in the number of portable and wearable electronic devices are notable factors increasing the growth of the DC charger market. There is a significant demand for electronic products including smartphones, smartwatches, and headphones. Furthermore, the need for DC chargers is being fueled by the growing use of electric vehicles. The development of quick DC chargers that can quickly charge electric vehicles is what is driving the expansion of the global industry. In addition, the ongoing demand for DC chargers in industrial applications is anticipated to create development prospects for the market for DC fast chargers in the upcoming years.
• Which are the top companies to hold the market share in DC High Power Charger Market?
The Fiber Glass Market key players include ABB Group, Siemens AG, Delta Electronics, Inc., Phihong Technology Co. Ltd., Kirloskar Electric Co. Ltd., Hitachi, Ltd., Legrand S.A., Helios Power Solutions, AEG Power Solutions B.V., and Statron AG.
• Which is the largest regional market for DC high Power Charger Market?
The DC chargers market's greatest revenue share in 2022 belonged to Asia-Pacific. The high growth rate of this market segment is primarily attributable to increased government initiatives to instal DC chargers in nations like China and Japan, rising investments in the construction of infrastructure for DC fast-charging stations, and the faster charging speeds of DC fast chargers when compared to other chargers.
DC High Power Charger Market Segment Analysis
The DC high power charger market is segmented based on Power Output, Application and Region, Global trends and forecast.
By Power Output (10 KW to 100 KW, Less Than 10 KW, and More Than 100 KW), by Application (Industrial, Automotive, Consumer Electronics and others) and Region, Global trends and forecast.
The DC charger market is divided into three categories based on power output: less than 10 KW, 10 KW to 100 KW, and more than 10 KW. The 10 KW market category accounted for a sizeable portion of the DC charger industry's sales in 2021. The increased use of consumer electronics with small batteries, such as smartphones and laptops, is responsible for the segment's increased growth. The demand for faster charging to cut down on wait times is growing as people's lifestyles become more chaotic and busy.
The DC charger market is segmented into three categories, including Automotive, Consumer Electronics, and Industrial. Consumer electronics recorded a sizable sales proportion of the DC charger market in 2021. Due to the fact that more market participants worldwide are putting more of an emphasis on satisfying consumers' need for better charging alternatives, the segment's growth is accelerating quite quickly.
[caption id="attachment_13927" align="aligncenter" width="1920"]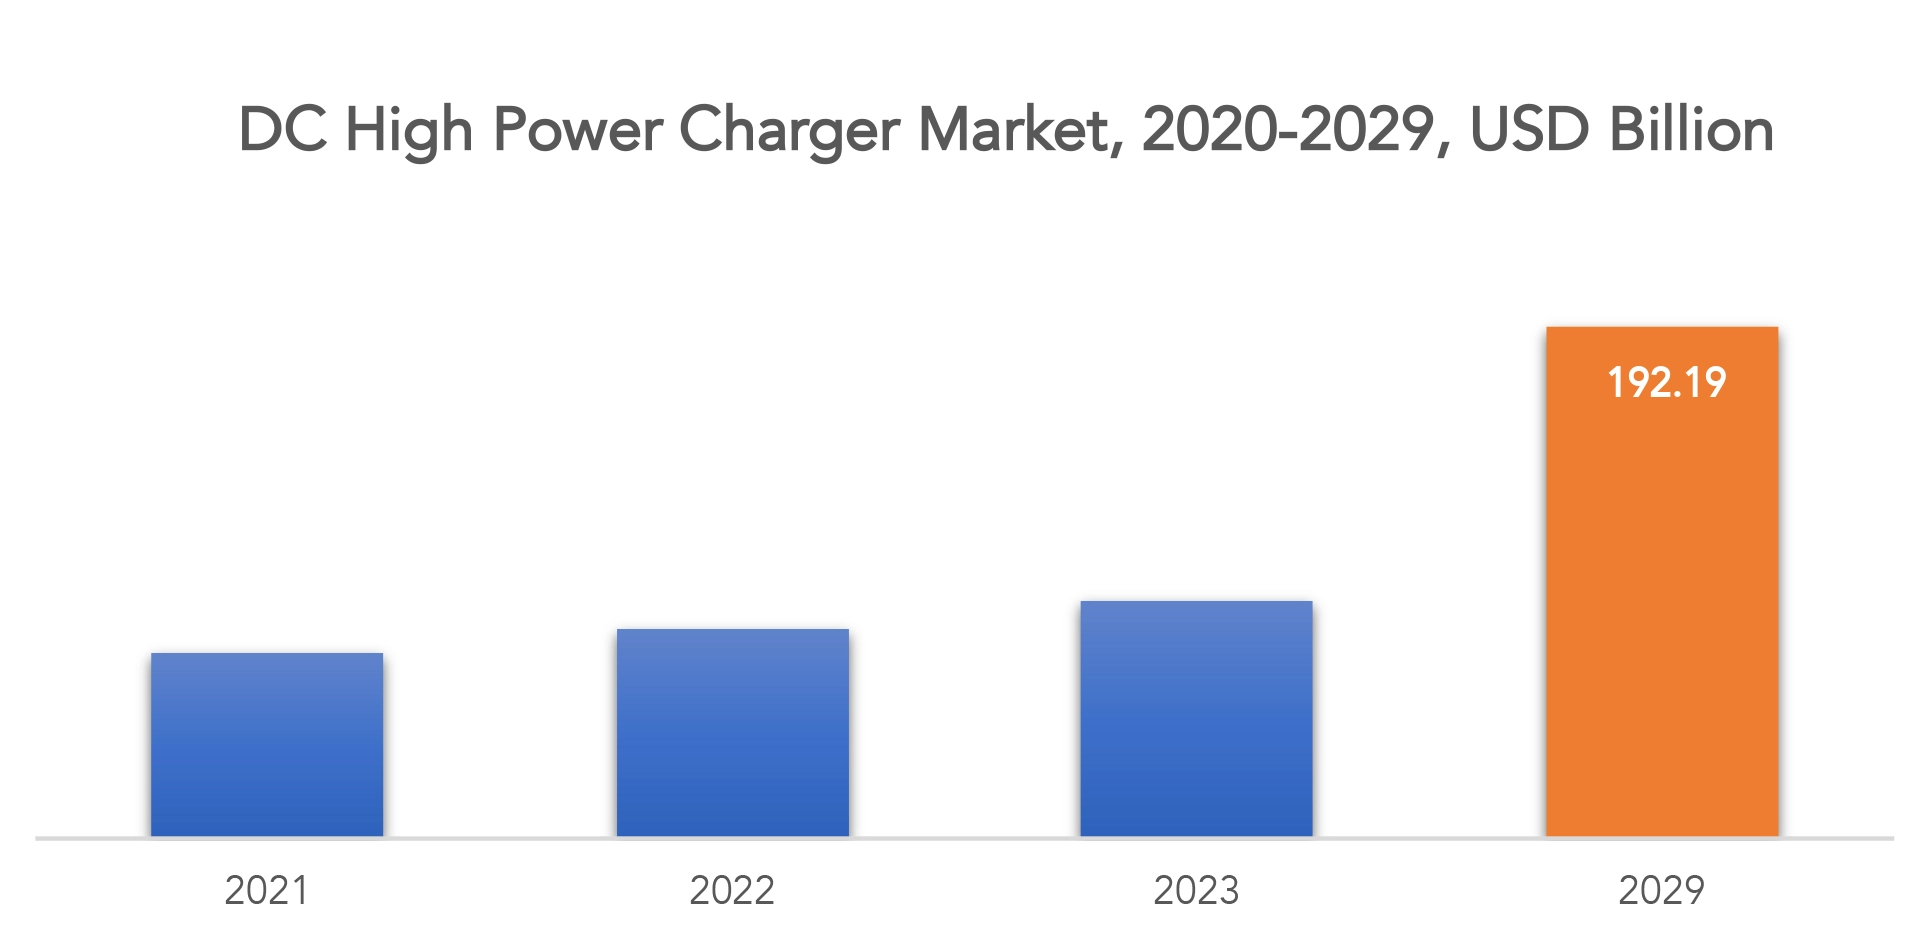
DC High Power Charger Market Players
The market research report covers the analysis of market players. Key companies profiled in the report include ABB Group, Siemens AG, Delta Electronics, Inc., Phihong Technology Co. Ltd., Kirloskar Electric Co. Ltd., Hitachi, Ltd., Legrand S.A., Helios Power Solutions, AEG Power Solutions B.V., and Statron AG.
Aug-2022: Delta Electronics came into an agreement with EVgo, the Largest EV Fast Charging Network in America. Under this agreement, Delta would provide its 1,000 ultra-fast chargers to EVgo in order to reduce the supply chain risk and streamline fast charging deployment targets within the US.
Jul-2022: Siemens partnered with ConnectDER, a plug-and-play grid integration solution provider. Following this partnership, the company aimed to offer Plug-in Home EV Charging Solution. This solution would allow EV owners to charge their vehicles EVs by connecting chargers directly via the meter socket.
Apr-2022: ABB teamed up with Shell, a multinational oil and gas company. Following this collaboration, the companies would offer high-quality and flexible charging solutions to owners of electric vehicles across the world.
Who Should Buy? Or Key Stakeholders
- Manufacturers of Electric Vehicle Charging Stations Component.
- Technology/system providers of Electric Vehicle Charging Stations
- Automobile Companies.
- Government and regional agencies and research organizations
- Investment research firms
- Others
DC High Power Charger Market Regional Analysis
The DC High Power Charger Market by region includes North America, Asia-Pacific (APAC), Europe, South America, and Middle East & Africa (MEA).
- North America: includes the US, Canada, Mexico
- Asia Pacific: includes China, Japan, South Korea, India, Australia, ASEAN and Rest of APAC
- Europe: includes UK, Germany, France, Italy, Spain, Russia, and Rest of Europe
- South America: includes Brazil, Argentina and Rest of South America
- Middle East & Africa: includes Turkey, UAE, Saudi Arabia, South Africa, and Rest of MEA
The DC Chargers Market is examined regionally throughout LAMEA, Asia-Pacific, Europe, and North America. The DC chargers market's greatest revenue share in 2021 belonged to Asia-Pacific. The high growth rate of this market segment is primarily attributable to increased government initiatives to instal DC chargers in nations like China and Japan, rising investments in the construction of infrastructure for DC fast-charging stations, and the faster charging speeds of DC fast chargers when compared to other chargers. DC chargers deliver DC electricity. In addition to being used to charge batteries for electronic devices, DC batteries are also used in automotive and industrial applications.
[caption id="attachment_13928" align="aligncenter" width="1920"]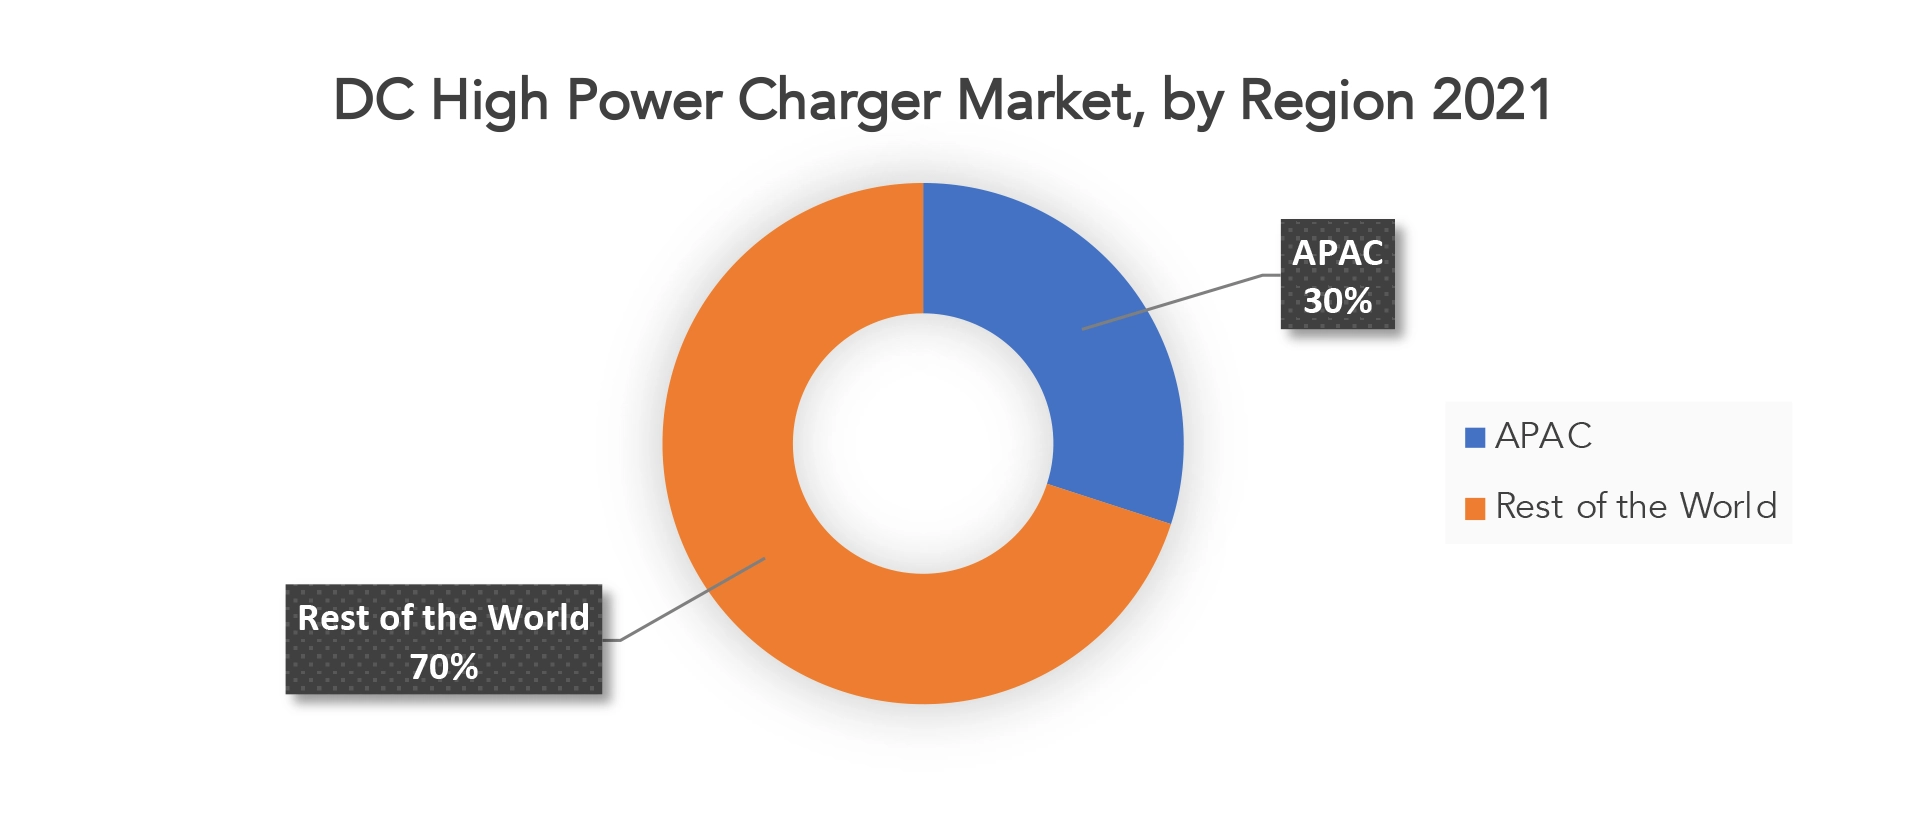
Key Market Segments: DC High Power Charger Market
DC High Power Charger Market By Power Output, 2023-2029, (USD Billion), (Thousand Units).- 10 Kw To 100 Kw
- Less Than 10 Kw
- More Than 100 Kw
- Industrial
- Automotive
- Consumer Electronics
- North America
- Asia Pacific
- Europe
- South America
- Middle East and Africa
Key Question Answered
- What is the current size of the DC High Power Charge Market?
- What are the key factors influencing the growth of DC High power Charger Market?
- What are the major applications for DC charger?
- Who are the major key players in the DC High Power Charge Market?
- Which region will provide more business opportunities for DC High Power Charger Market in future?
- Which segment holds the maximum share of the DC High Power Charge Market?
- Introduzione
- Definizione di mercato
- Segmentazione del mercato
- Cronologie della ricerca
- Presupposti e limitazioni
- Metodologia di ricerca
- Estrazione dei dati
- Ricerca secondaria
- Ricerca primaria
- Consigli degli esperti in materia
- Controlli di qualità
- Revisione finale
- Triangolazione dei dati
- Approccio dal basso verso l'alto
- Approccio dall'alto verso il basso
- Flusso di ricerca
- Fonti dei dati
- Estrazione dei dati
- Sintesi
- Panoramica del mercato
- Prospettive del mercato globale dei caricabatterie DC ad alta potenza
- Fattori trainanti del mercato
- Limitazioni di mercato
- Opportunità di mercato
- Impatto del Covid-19 sul mercato dei caricabatterie ad alta potenza CC
- Modello delle cinque forze di Porter
- Minaccia da parte dei nuovi entranti
- Minaccia da sostituti
- Potere contrattuale dei fornitori
- Potere contrattuale dei clienti
- Grado di concorrenza
- Analisi della catena del valore del settore
- Prospettive del mercato globale dei caricabatterie DC ad alta potenza
- Mercato globale dei caricabatterie ad alta potenza CC per potenza in uscita, 2023-2029, (miliardi di USD, migliaia di unità)
- Da 10 KW a 100 KW
- Meno di 10 KW
- Più di 100 KW
- Mercato globale dei caricabatterie ad alta potenza CC per applicazione, 2023-2029, (miliardi di USD, migliaia di unità)
- Industriale
- Automobilistico
- Elettronica di consumo
- Mercato globale dei caricabatterie ad alta potenza CC per regione, 2023-2029, (miliardi di USD, migliaia di unità)
- America del Nord
- NOI
- Canada
- Messico
- Sud America
- Brasile
- Argentina
- Colombia
- Resto del Sud America
- Europa
- Germania
- Regno Unito
- Francia
- Italia
- Spagna
- Russia
- Resto d'Europa
- Asia Pacifico
- India
- Cina
- Giappone
- Corea del Sud
- Australia
- Asia sud-orientale
- Resto dell'Asia Pacifica
- Medio Oriente e Africa
- Emirati Arabi Uniti
- Arabia Saudita
- Sudafrica
- Resto del Medio Oriente e Africa
- America del Nord
- Profili aziendali*
(Panoramica aziendale, istantanea aziendale, prodotti offerti, sviluppi recenti)
- Gruppo ABB
- Delta Electronics, Inc.
- Società per azioni Phihong Technology Co. Ltd.
- Kirloskar Electric Co. Ltd.
- Hitachi
- Legrand S.A.
- Helios Power Solutions
- AEG Power Solutions B.V.
- Statron Ltd.
- Siemens AG
*The Company List Is Indicative
LIST OF TABLES
TABLE 1 GLOBAL DC HIGH POWER CHARGER MARKET BY POWER OUTPUT (USD BILLION) 2020-2029
TABLE 2 GLOBAL DC HIGH POWER CHARGER MARKET BY POWER OUTPUT (THOUSAND UNITS) 2020-2029
TABLE 3 GLOBAL DC HIGH POWER CHARGER MARKET BY APPLICATION (USD BILLION) 2020-2029
TABLE 4 GLOBAL DC HIGH POWER CHARGER MARKET BY APPLICATION (THOUSAND UNITS) 2020-2029
TABLE 5 GLOBAL DC HIGH POWER CHARGER MARKET BY REGION (USD BILLION) 2020-2029
TABLE 6 GLOBAL DC HIGH POWER CHARGER MARKET BY REGION (THOUSAND UNITS) 2020-2029
TABLE 7 NORTH AMERICA DC HIGH POWER CHARGER MARKET BY COUNTRY (USD BILLION) 2020-2029
TABLE 8 NORTH AMERICA DC HIGH POWER CHARGER MARKET BY COUNTRY (THOUSAND UNITS) 2020-2029
TABLE 9 NORTH AMERICA DC HIGH POWER CHARGER MARKET BY POWER OUTPUT (USD BILLION) 2020-2029
TABLE 10 NORTH AMERICA DC HIGH POWER CHARGER MARKET BY POWER OUTPUT (THOUSAND UNITS) 2020-2029
TABLE 11 NORTH AMERICA DC HIGH POWER CHARGER MARKET BY APPLICATION (USD BILLION) 2020-2029
TABLE 12 NORTH AMERICA DC HIGH POWER CHARGER MARKET BY APPLICATION (THOUSAND UNITS) 2020-2029
TABLE 13 US DC HIGH POWER CHARGER MARKET BY POWER OUTPUT (USD BILLION) 2020-2029
TABLE 14 US DC HIGH POWER CHARGER MARKET BY POWER OUTPUT (THOUSAND UNITS) 2020-2029
TABLE 15 US DC HIGH POWER CHARGER MARKET BY APPLICATION (USD BILLION) 2020-2029
TABLE 16 US DC HIGH POWER CHARGER MARKET BY APPLICATION (THOUSAND UNITS) 2020-2029
TABLE 17 CANADA DC HIGH POWER CHARGER MARKET BY POWER OUTPUT (USD BILLION) 2020-2029
TABLE 18 CANADA DC HIGH POWER CHARGER MARKET BY POWER OUTPUT (THOUSAND UNITS) 2020-2029
TABLE 19 CANADA DC HIGH POWER CHARGER MARKET BY APPLICATION (USD BILLION) 2020-2029
TABLE 20 CANADA DC HIGH POWER CHARGER MARKET BY APPLICATION (THOUSAND UNITS) 2020-2029
TABLE 21 MEXICO DC HIGH POWER CHARGER MARKET BY POWER OUTPUT (USD BILLION) 2020-2029
TABLE 22 MEXICO DC HIGH POWER CHARGER MARKET BY POWER OUTPUT (THOUSAND UNITS) 2020-2029
TABLE 23 MEXICO DC HIGH POWER CHARGER MARKET BY APPLICATION (USD BILLION) 2020-2029
TABLE 24 MEXICO DC HIGH POWER CHARGER MARKET BY APPLICATION (THOUSAND UNITS) 2020-2029
TABLE 25 SOUTH AMERICA DC HIGH POWER CHARGER MARKET BY COUNTRY (USD BILLION) 2020-2029
TABLE 26 SOUTH AMERICA DC HIGH POWER CHARGER MARKET BY COUNTRY (THOUSAND UNITS) 2020-2029
TABLE 27 SOUTH AMERICA DC HIGH POWER CHARGER MARKET BY POWER OUTPUT (USD BILLION) 2020-2029
TABLE 28 SOUTH AMERICA DC HIGH POWER CHARGER MARKET BY POWER OUTPUT (THOUSAND UNITS) 2020-2029
TABLE 29 SOUTH AMERICA DC HIGH POWER CHARGER MARKET BY APPLICATION (USD BILLION) 2020-2029
TABLE 30 SOUTH AMERICA DC HIGH POWER CHARGER MARKET BY APPLICATION (THOUSAND UNITS) 2020-2029
TABLE 31 BRAZIL DC HIGH POWER CHARGER MARKET BY POWER OUTPUT (USD BILLION) 2020-2029
TABLE 32 BRAZIL DC HIGH POWER CHARGER MARKET BY POWER OUTPUT (THOUSAND UNITS) 2020-2029
TABLE 33 BRAZIL DC HIGH POWER CHARGER MARKET BY APPLICATION (USD BILLION) 2020-2029
TABLE 34 BRAZIL DC HIGH POWER CHARGER MARKET BY APPLICATION (THOUSAND UNITS) 2020-2029
TABLE 35 ARGENTINA DC HIGH POWER CHARGER MARKET BY POWER OUTPUT (USD BILLION) 2020-2029
TABLE 36 ARGENTINA DC HIGH POWER CHARGER MARKET BY POWER OUTPUT (THOUSAND UNITS) 2020-2029
TABLE 37 ARGENTINA DC HIGH POWER CHARGER MARKET BY APPLICATION (USD BILLION) 2020-2029
TABLE 38 ARGENTINA DC HIGH POWER CHARGER MARKET BY APPLICATION (THOUSAND UNITS) 2020-2029
TABLE 39 COLOMBIA DC HIGH POWER CHARGER MARKET BY POWER OUTPUT (USD BILLION) 2020-2029
TABLE 40 COLOMBIA DC HIGH POWER CHARGER MARKET BY POWER OUTPUT (THOUSAND UNITS) 2020-2029
TABLE 41 COLOMBIA DC HIGH POWER CHARGER MARKET BY APPLICATION (USD BILLION) 2020-2029
TABLE 42 COLOMBIA DC HIGH POWER CHARGER MARKET BY APPLICATION (THOUSAND UNITS) 2020-2029
TABLE 43 REST OF SOUTH AMERICA DC HIGH POWER CHARGER MARKET BY POWER OUTPUT (USD BILLION) 2020-2029
TABLE 44 REST OF SOUTH AMERICA DC HIGH POWER CHARGER MARKET BY POWER OUTPUT (THOUSAND UNITS) 2020-2029
TABLE 45 REST OF SOUTH AMERICA DC HIGH POWER CHARGER MARKET BY APPLICATION (USD BILLION) 2020-2029
TABLE 46 REST OF SOUTH AMERICA DC HIGH POWER CHARGER MARKET BY APPLICATION (THOUSAND UNITS) 2020-2029
TABLE 47 ASIA-PACIFIC DC HIGH POWER CHARGER MARKET BY COUNTRY (USD BILLION) 2020-2029
TABLE 48 ASIA-PACIFIC DC HIGH POWER CHARGER MARKET BY COUNTRY (THOUSAND UNITS) 2020-2029
TABLE 49 ASIA-PACIFIC DC HIGH POWER CHARGER MARKET BY POWER OUTPUT (USD BILLION) 2020-2029
TABLE 50 ASIA-PACIFIC DC HIGH POWER CHARGER MARKET BY POWER OUTPUT (THOUSAND UNITS) 2020-2029
TABLE 51 ASIA-PACIFIC DC HIGH POWER CHARGER MARKET BY APPLICATION (USD BILLION) 2020-2029
TABLE 52 ASIA-PACIFIC DC HIGH POWER CHARGER MARKET BY APPLICATION (THOUSAND UNITS) 2020-2029
TABLE 53 INDIA DC HIGH POWER CHARGER MARKET BY POWER OUTPUT (USD BILLION) 2020-2029
TABLE 54 INDIA DC HIGH POWER CHARGER MARKET BY POWER OUTPUT (THOUSAND UNITS) 2020-2029
TABLE 55 INDIA DC HIGH POWER CHARGER MARKET BY APPLICATION (USD BILLION) 2020-2029
TABLE 56 INDIA DC HIGH POWER CHARGER MARKET BY APPLICATION (THOUSAND UNITS) 2020-2029
TABLE 57 CHINA DC HIGH POWER CHARGER MARKET BY POWER OUTPUT (USD BILLION) 2020-2029
TABLE 58 CHINA DC HIGH POWER CHARGER MARKET BY POWER OUTPUT (THOUSAND UNITS) 2020-2029
TABLE 59 CHINA DC HIGH POWER CHARGER MARKET BY APPLICATION (USD BILLION) 2020-2029
TABLE 60 CHINA DC HIGH POWER CHARGER MARKET BY APPLICATION (THOUSAND UNITS) 2020-2029
TABLE 61 JAPAN DC HIGH POWER CHARGER MARKET BY POWER OUTPUT (USD BILLION) 2020-2029
TABLE 62 JAPAN DC HIGH POWER CHARGER MARKET BY POWER OUTPUT (THOUSAND UNITS) 2020-2029
TABLE 63 JAPAN DC HIGH POWER CHARGER MARKET BY APPLICATION (USD BILLION) 2020-2029
TABLE 64 JAPAN DC HIGH POWER CHARGER MARKET BY APPLICATION (THOUSAND UNITS) 2020-2029
TABLE 65 SOUTH KOREA DC HIGH POWER CHARGER MARKET BY POWER OUTPUT (USD BILLION) 2020-2029
TABLE 66 SOUTH KOREA DC HIGH POWER CHARGER MARKET BY POWER OUTPUT (THOUSAND UNITS) 2020-2029
TABLE 67 SOUTH KOREA DC HIGH POWER CHARGER MARKET BY APPLICATION (USD BILLION) 2020-2029
TABLE 68 SOUTH KOREA DC HIGH POWER CHARGER MARKET BY APPLICATION (THOUSAND UNITS) 2020-2029
TABLE 69 AUSTRALIA DC HIGH POWER CHARGER MARKET BY POWER OUTPUT (USD BILLION) 2020-2029
TABLE 70 AUSTRALIA DC HIGH POWER CHARGER MARKET BY POWER OUTPUT (THOUSAND UNITS) 2020-2029
TABLE 71 AUSTRALIA DC HIGH POWER CHARGER MARKET BY APPLICATION (USD BILLION) 2020-2029
TABLE 72 AUSTRALIA DC HIGH POWER CHARGER MARKET BY APPLICATION (THOUSAND UNITS) 2020-2029
TABLE 73 SOUTH-EAST ASIA DC HIGH POWER CHARGER MARKET BY POWER OUTPUT (USD BILLION) 2020-2029
TABLE 74 SOUTH-EAST ASIA DC HIGH POWER CHARGER MARKET BY POWER OUTPUT (THOUSAND UNITS) 2020-2029
TABLE 75 SOUTH-EAST ASIA DC HIGH POWER CHARGER MARKET BY APPLICATION (USD BILLION) 2020-2029
TABLE 76 SOUTH-EAST ASIA DC HIGH POWER CHARGER MARKET BY APPLICATION (THOUSAND UNITS) 2020-2029
TABLE 77 REST OF ASIA PACIFIC DC HIGH POWER CHARGER MARKET BY POWER OUTPUT (USD BILLION) 2020-2029
TABLE 78 REST OF ASIA PACIFIC DC HIGH POWER CHARGER MARKET BY POWER OUTPUT (THOUSAND UNITS) 2020-2029
TABLE 79 REST OF ASIA PACIFIC DC HIGH POWER CHARGER MARKET BY APPLICATION (USD BILLION) 2020-2029
TABLE 80 REST OF ASIA PACIFIC DC HIGH POWER CHARGER MARKET BY APPLICATION (THOUSAND UNITS) 2020-2029
TABLE 81 EUROPE DC HIGH POWER CHARGER MARKET BY COUNTRY (USD BILLION) 2020-2029
TABLE 82 EUROPE DC HIGH POWER CHARGER MARKET BY COUNTRY (THOUSAND UNITS) 2020-2029
TABLE 83 ASIA-PACIFIC DC HIGH POWER CHARGER MARKET BY POWER OUTPUT (USD BILLION) 2020-2029
TABLE 84 ASIA-PACIFIC DC HIGH POWER CHARGER MARKET BY POWER OUTPUT (THOUSAND UNITS) 2020-2029
TABLE 85 ASIA-PACIFIC DC HIGH POWER CHARGER MARKET BY APPLICATION (USD BILLION) 2020-2029
TABLE 86 ASIA-PACIFIC DC HIGH POWER CHARGER MARKET BY APPLICATION (THOUSAND UNITS) 2020-2029
TABLE 87 GERMANY DC HIGH POWER CHARGER MARKET BY POWER OUTPUT (USD BILLION) 2020-2029
TABLE 88 GERMANY DC HIGH POWER CHARGER MARKET BY POWER OUTPUT (THOUSAND UNITS) 2020-2029
TABLE 89 GERMANY DC HIGH POWER CHARGER MARKET BY APPLICATION (USD BILLION) 2020-2029
TABLE 90 GERMANY DC HIGH POWER CHARGER MARKET BY APPLICATION (THOUSAND UNITS) 2020-2029
TABLE 91 UK DC HIGH POWER CHARGER MARKET BY POWER OUTPUT (USD BILLION) 2020-2029
TABLE 92 UK DC HIGH POWER CHARGER MARKET BY POWER OUTPUT (THOUSAND UNITS) 2020-2029
TABLE 93 UK DC HIGH POWER CHARGER MARKET BY APPLICATION (USD BILLION) 2020-2029
TABLE 94 UK DC HIGH POWER CHARGER MARKET BY APPLICATION (THOUSAND UNITS) 2020-2029
TABLE 95 FRANCE DC HIGH POWER CHARGER MARKET BY POWER OUTPUT (USD BILLION) 2020-2029
TABLE 96 FRANCE DC HIGH POWER CHARGER MARKET BY POWER OUTPUT (THOUSAND UNITS) 2020-2029
TABLE 97 FRANCE DC HIGH POWER CHARGER MARKET BY APPLICATION (USD BILLION) 2020-2029
TABLE 98 FRANCE DC HIGH POWER CHARGER MARKET BY APPLICATION (THOUSAND UNITS) 2020-2029
TABLE 99 ITALY DC HIGH POWER CHARGER MARKET BY POWER OUTPUT (USD BILLION) 2020-2029
TABLE 100 ITALY DC HIGH POWER CHARGER MARKET BY POWER OUTPUT (THOUSAND UNITS) 2020-2029
TABLE 101 ITALY DC HIGH POWER CHARGER MARKET BY APPLICATION (USD BILLION) 2020-2029
TABLE 102 ITALY DC HIGH POWER CHARGER MARKET BY APPLICATION (THOUSAND UNITS) 2020-2029
TABLE 103 SPAIN DC HIGH POWER CHARGER MARKET BY POWER OUTPUT (USD BILLION) 2020-2029
TABLE 104 SPAIN DC HIGH POWER CHARGER MARKET BY POWER OUTPUT (THOUSAND UNITS) 2020-2029
TABLE 105 SPAIN DC HIGH POWER CHARGER MARKET BY APPLICATION (USD BILLION) 2020-2029
TABLE 106 SPAIN DC HIGH POWER CHARGER MARKET BY APPLICATION (THOUSAND UNITS) 2020-2029
TABLE 107 RUSSIA DC HIGH POWER CHARGER MARKET BY POWER OUTPUT (USD BILLION) 2020-2029
TABLE 108 RUSSIA DC HIGH POWER CHARGER MARKET BY POWER OUTPUT (THOUSAND UNITS) 2020-2029
TABLE 109 RUSSIA DC HIGH POWER CHARGER MARKET BY APPLICATION (USD BILLION) 2020-2029
TABLE 110 RUSSIA DC HIGH POWER CHARGER MARKET BY APPLICATION (THOUSAND UNITS) 2020-2029
TABLE 111 REST OF EUROPE DC HIGH POWER CHARGER MARKET BY POWER OUTPUT (USD BILLION) 2020-2029
TABLE 112 REST OF EUROPE DC HIGH POWER CHARGER MARKET BY POWER OUTPUT (THOUSAND UNITS) 2020-2029
TABLE 113 REST OF EUROPE DC HIGH POWER CHARGER MARKET BY APPLICATION (USD BILLION) 2020-2029
TABLE 114 REST OF EUROPE DC HIGH POWER CHARGER MARKET BY APPLICATION (THOUSAND UNITS) 2020-2029
TABLE 115 MIDDLE EAST AND AFRICA DC HIGH POWER CHARGER MARKET BY COUNTRY (USD BILLION) 2020-2029
TABLE 116 MIDDLE EAST AND AFRICA DC HIGH POWER CHARGER MARKET BY COUNTRY (THOUSAND UNITS) 2020-2029
TABLE 117 MIDDLE EAST AND AFRICA DC HIGH POWER CHARGER MARKET BY POWER OUTPUT (USD BILLION) 2020-2029
TABLE 118 MIDDLE EAST AND AFRICA DC HIGH POWER CHARGER MARKET BY POWER OUTPUT (THOUSAND UNITS) 2020-2029
TABLE 119 MIDDLE EAST AND AFRICA DC HIGH POWER CHARGER MARKET BY APPLICATION (USD BILLION) 2020-2029
TABLE 120 MIDDLE EAST AND AFRICA DC HIGH POWER CHARGER MARKET BY APPLICATION (THOUSAND UNITS) 2020-2029
TABLE 121 UAE DC HIGH POWER CHARGER MARKET BY POWER OUTPUT (USD BILLION) 2020-2029
TABLE 122 UAE DC HIGH POWER CHARGER MARKET BY POWER OUTPUT (THOUSAND UNITS) 2020-2029
TABLE 123 UAE DC HIGH POWER CHARGER MARKET BY APPLICATION (USD BILLION) 2020-2029
TABLE 124 UAE DC HIGH POWER CHARGER MARKET BY APPLICATION (THOUSAND UNITS) 2020-2029
TABLE 125 SAUDI ARABIA DC HIGH POWER CHARGER MARKET BY POWER OUTPUT (USD BILLION) 2020-2029
TABLE 126 SAUDI ARABIA DC HIGH POWER CHARGER MARKET BY POWER OUTPUT (THOUSAND UNITS) 2020-2029
TABLE 127 SAUDI ARABIA DC HIGH POWER CHARGER MARKET BY APPLICATION (USD BILLION) 2020-2029
TABLE 128 SAUDI ARABIA DC HIGH POWER CHARGER MARKET BY APPLICATION (THOUSAND UNITS) 2020-2029
TABLE 129 SOUTH AFRICA DC HIGH POWER CHARGER MARKET BY POWER OUTPUT (USD BILLION) 2020-2029
TABLE 130 SOUTH AFRICA DC HIGH POWER CHARGER MARKET BY POWER OUTPUT (THOUSAND UNITS) 2020-2029
TABLE 131 SOUTH AFRICA DC HIGH POWER CHARGER MARKET BY APPLICATION (USD BILLION) 2020-2029
TABLE 132 SOUTH AFRICA DC HIGH POWER CHARGER MARKET BY APPLICATION (THOUSAND UNITS) 2020-2029
TABLE 133 REST OF MIDDLE EAST AND AFRICA DC HIGH POWER CHARGER MARKET BY POWER OUTPUT (USD BILLION) 2020-2029
TABLE 134 REST OF MIDDLE EAST AND AFRICA DC HIGH POWER CHARGER MARKET BY POWER OUTPUT (THOUSAND UNITS) 2020-2029
TABLE 135 REST OF MIDDLE EAST AND AFRICA DC HIGH POWER CHARGER MARKET BY APPLICATION (USD BILLION) 2020-2029
TABLE 136 REST OF MIDDLE EAST AND AFRICA DC HIGH POWER CHARGER MARKET BY APPLICATION (THOUSAND UNITS) 2020-2029
LIST OF FIGURES
FIGURE 1 MARKET DYNAMICS
FIGURE 2 MARKET SEGMENTATION
FIGURE 3 REPORT TIMELINES: YEARS CONSIDERED
FIGURE 4 DATA TRIANGULATION
FIGURE 5 BOTTOM-UP APPROACH
FIGURE 6 TOP-DOWN APPROACH
FIGURE 7 RESEARCH FLOW
FIGURE 8 GLOBAL DC HIGH POWER CHARGER MARKET BY POWER OUTPUT, USD BILLION, 2020- 2029
FIGURE 9 GLOBAL DC HIGH POWER CHARGER MARKET BY APPLICATION, USD BILLION, 2020-2029
FIGURE 10 GLOBAL DC HIGH POWER CHARGER MARKET BY REGION, USD BILLION, 2020-2029
FIGURE 11 PORTER’S FIVE FORCES MODEL
FIGURE 12 GLOBAL DC HIGH POWER CHARGER MARKET BY POWER OUTPUT, USD BILLION, 2021
FIGURE 13 GLOBAL DC HIGH POWER CHARGER MARKET BY APPLICATION, USD BILLION, 2021
FIGURE 14 GLOBAL DC HIGH POWER CHARGER MARKET BY REGION, USD BILLION, 2021
FIGURE 15 MARKET SHARE ANALYSIS
FIGURE 16 ABB GROUP: COMPANY SNAPSHOT
FIGURE 17 DELTA ELECTRONICS: COMPANY SNAPSHOT
FIGURE 18 PHIHONG TECHNOLOGY CO. LTD.: COMPANY SNAPSHOT
FIGURE 19 KIRLOSKAR ELECTRIC CO. LTD.: COMPANY SNAPSHOT
FIGURE 20 HITACHI: COMPANY SNAPSHOT
FIGURE 21 LEGRAND S.A.: COMPANY SNAPSHOT
FIGURE 22 HELIOS POWER SOLUTIONS: COMPANY SNAPSHOT
FIGURE 23 AEG POWER SOLUTIONS B.V.: COMPANY SNAPSHOT
FIGURE 24 STATRON LTD.: COMPANY SNAPSHOT
FIGURE 25 SIEMENS AG: COMPANY SNAPSHOT
DOWNLOAD FREE SAMPLE REPORT
License Type
SPEAK WITH OUR ANALYST
Want to know more about the report or any specific requirement?
WANT TO CUSTOMIZE THE REPORT?
Our Clients Speak
We asked them to research ‘ Equipment market’ all over the world, and their whole arrangement was helpful to us. thehealthanalytics.com insightful analysis and reports contributed to our current analysis and in creating a future strategy. Besides, the te
Yosuke Mitsui
Senior Associate Construction Equipment Sales & Marketing
We asked them to research ‘Equipment market’ all over the world, and their whole arrangement was helpful to us. thehealthanalytics.com insightful analysis and reports contributed to our current analysis and in creating a future strategy. Besides, the te


