

Base Year Value ()
x.x %
x.x %
CAGR ()
x.x %
x.x %
Forecast Year Value ()
x.x %
x.x %
Historical Data Period
Largest Region
Forecast Period
Mercato degli additivi per fertilizzanti per tipo (agenti antiagglomeranti, antipolvere, agenti essiccanti, agenti di granulazione), per forma (granulare, polvere) per applicazione (urea, nitrato di ammonio, fosfato monoammonico, solfato di ammonio) e regione, tendenze globali e previsioni dal 2023 al 2029
Instant access to hundreds of data points and trends
- Market estimates from 2014-2029
- Competitive analysis, industry segmentation, financial benchmarks
- Incorporates SWOT, Porter's Five Forces and risk management frameworks
- PDF report or online database with Word, Excel and PowerPoint export options
- 100% money back guarantee
Panoramica del mercato degli additivi per fertilizzanti
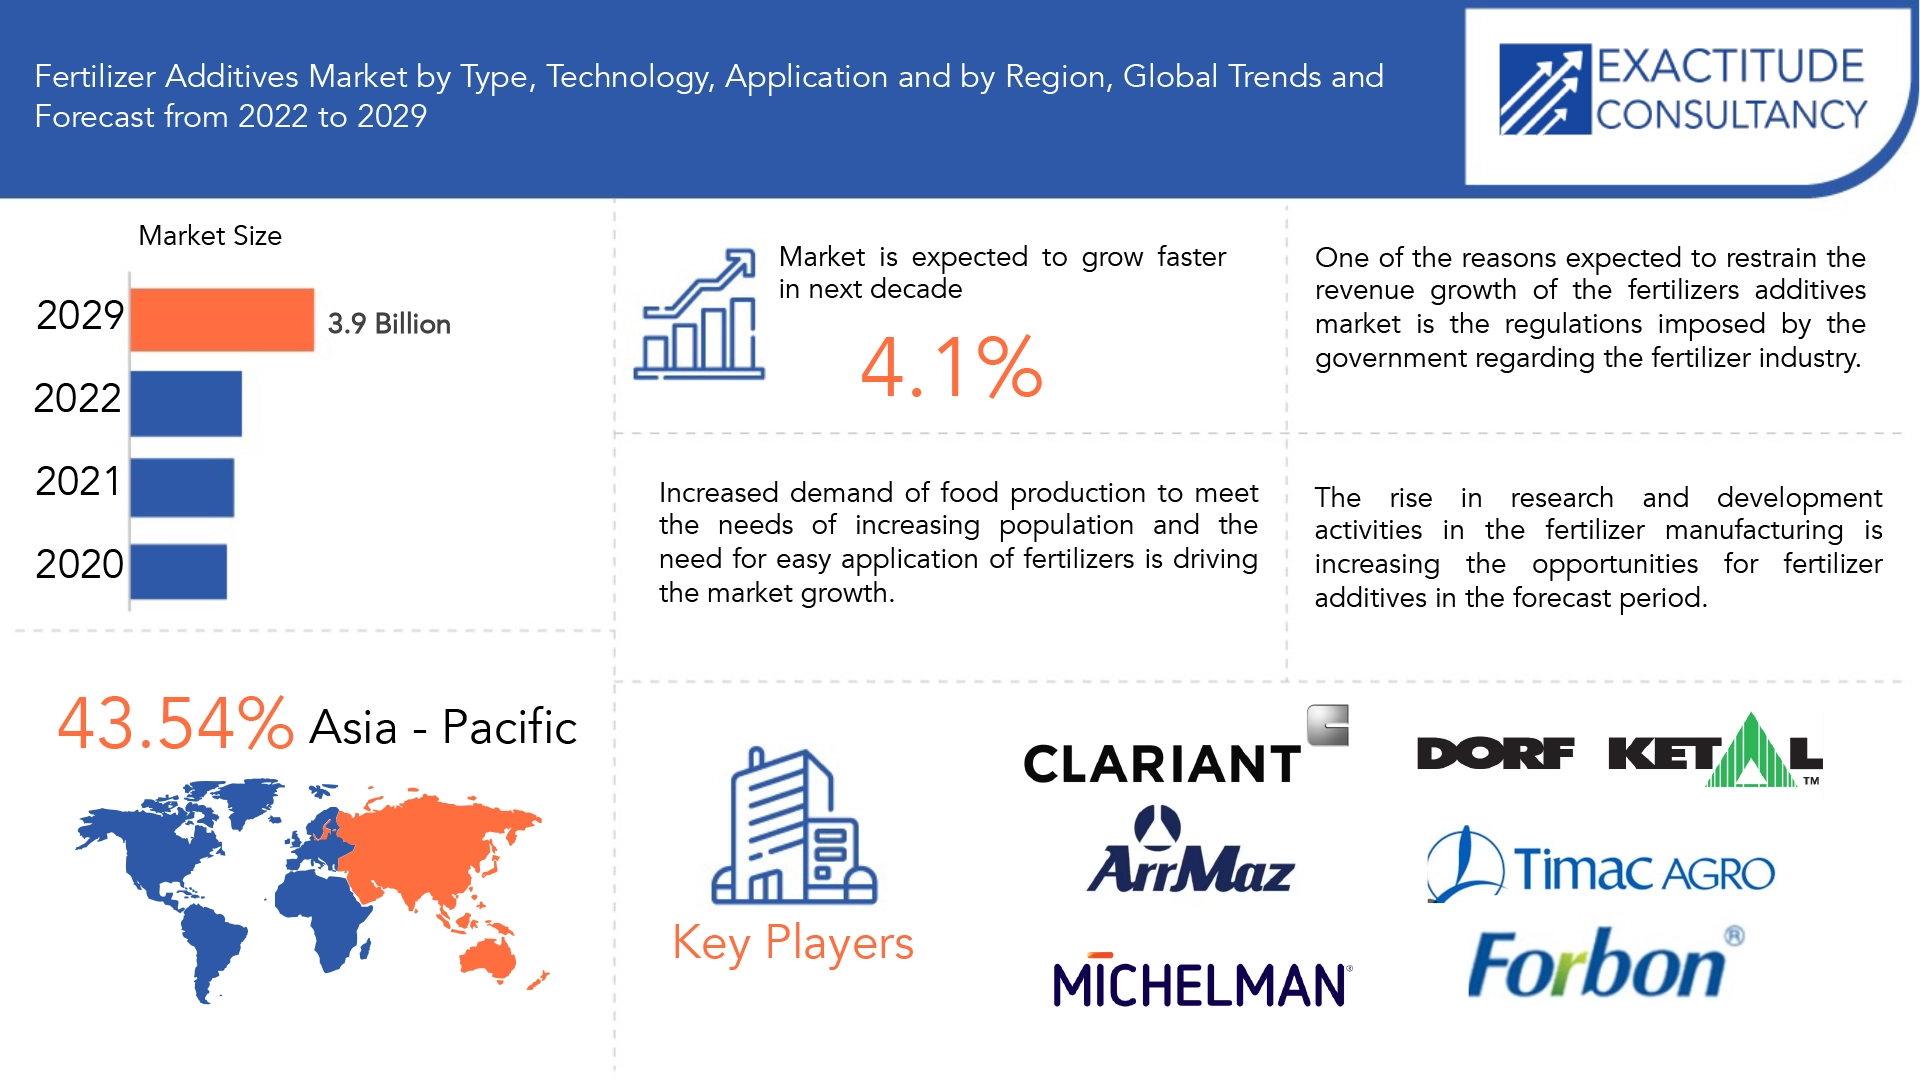
Si prevede che il mercato degli additivi per fertilizzanti crescerà al 4,1% di CAGR dal 2022 al 2029. Si prevede che raggiungerà oltre 3,9 miliardi di USD entro il 2029 dai 2,6 miliardi di USD del 2020.
La qualità e la stabilità dei fertilizzanti sono migliorate da materiali o sostanze come gli additivi per fertilizzanti. La granularità è mantenuta e la perdita di nutrienti come azoto, fosforo, potassio e zolfo è evitata. Questi additivi aiutano anche a prevenire la formazione di grumi e polvere nei fertilizzanti. Durante la stagione delle piogge, i fertilizzanti tendono spesso a formare grumi. Questi sono anche prevenuti dall'uso di additivi.
Gli additivi per fertilizzanti migliorano l'economia dei costi dei fertilizzanti . Sono utilizzati per migliorare, ridurre i tempi di fermo, l'utilizzo della capacità e aumentare il recupero degli input di nutrienti. Il livello nutrizionale dei fertilizzanti viene migliorato utilizzando additivi. Immobilizzazione, denitrificazione, lisciviazione e volatilizzazione causano la perdita di alcuni contenuti di fertilizzanti come azoto , zolfo e fosforo. L'azoto è un componente molto importante per la crescita di una pianta e quindi molti additivi vengono utilizzati per preservarlo.
| ATTRIBUTO | DETTAGLI |
| Periodo di studio | 2020-2029 |
| Anno base | 2021 |
| Anno stimato | 2022 |
| Anno previsto | 2022-2029 |
| Periodo storico | 2018-2020 |
| Unità | Valore (milioni di USD), (chilotonnellate) |
| Segmentazione | per tipo, per forma, per applicazione, per regione |
| Per tipo |
|
| Per modulo |
|
| Per applicazione |
|
| Per regione |
|
I fertilizzanti vengono mescolati con gli additivi e quindi gli ioni di azoto vengono fatti rimanere nel terreno per un periodo più lungo. Nella maggior parte dei casi vengono aggiunti durante l'uso del fertilizzante nel terreno o vengono aggiunti anche durante il processo di produzione.
Alcuni tipi di additivi per fertilizzanti sono agenti idrofobici, agenti antiagglomeranti, agenti antischiuma, agenti depolveranti, inibitori di corrosione, ecc. Durante la digestione della roccia fosfatica con acido solforico vengono utilizzati agenti antischiuma per controllare la schiuma . Gli additivi per fertilizzanti antiagglomeranti vengono utilizzati per preservare la superficie dei fertilizzanti. Gli agenti depolveranti aiutano a ridurre la polvere generata dai fertilizzanti secchi durante la produzione, l'imballaggio, il trasporto, lo stoccaggio e il consumo.
Pertanto, gli additivi fertilizzanti svolgono un ruolo cruciale nel preservare nel terreno i nutrienti necessari alla crescita delle piante.
La popolazione mondiale sta aumentando a un ritmo più elevato. Si prevede che raggiungerà gli 8 miliardi entro il 2029. Pertanto, ciò influirà sulla domanda di cibo nei prossimi anni. Aumenterà del 70% nei prossimi 30 anni. Pertanto, c'è bisogno di aumentare la produzione alimentare. I fertilizzanti svolgono un ruolo importante nella produzione alimentare. Dal 30% al 40% della produzione alimentare mondiale è dovuta all'uso di fertilizzanti. Pertanto, poiché c'è una domanda di fertilizzanti, c'è un'elevata domanda di additivi per fertilizzanti. Questo è uno dei fattori trainanti per la crescita del mercato.
Durante l'uso dei fertilizzanti, se vengono aggiunti additivi per fertilizzanti, la loro applicazione è semplificata. Inoltre, a volte la formazione di grumi e incrostazioni nei fertilizzanti può causare la perdita di prodotto. Pertanto, la crescente facilità di applicazione e gestione dei fertilizzanti dovuta all'aggiunta di additivi per fertilizzanti sta guidando la crescita del mercato.
Nel settore dei fertilizzanti ci sono molte rigide normative governative che rappresentano un fattore limitante nella crescita del mercato degli additivi per fertilizzanti. L'uso di fertilizzanti può talvolta avere un effetto dannoso sulla salute umana e anche diminuire la fertilità naturale del suolo. Pertanto, le normative possono ostacolare la crescita del mercato.
C'è un aumento delle attività di ricerca e sviluppo nella produzione di fertilizzanti. Ciò sta creando molte opportunità per i principali attori del mercato. Le innovazioni tecnologiche sono utilizzate nella produzione di additivi per fertilizzanti.
Il Covid-19 ha avuto un impatto significativo sui settori dell'agricoltura, come nella produzione, nella fabbricazione di fertilizzanti e in altre attività di input agricoli. La maggior parte dei paesi nella regione Asia-Pacifico sono economie basate sull'agricoltura, quindi la diminuzione delle attività ha avuto un effetto significativo sulle aziende e sugli agricoltori.
Il costo delle materie prime limita la produzione di additivi per fertilizzanti. Questo è uno dei motivi che ostacolano la crescita del mercato.
[caption id="allegato_14104" align="alignnone" width="1920"]
Frequently Asked Questions
• What is the worth of Fertilizer Additives market?
The Fertilizer Additives market size was 2.6 USD Billion in the year 2020 and expected to grow at a rate of 4.1 CAGR to 3.9 USD Billion in 2029.
• What is the size of the North America Fertilizer Additives industry?
North America held more than 35% of the Fertilizer Additives market revenue share in 2021 and will witness expansion in the forecast period.
• What are some of the market's driving forces?
Factors such as high demand for food production due to increasing population and growing demand for easy application of fertilizers are some of the drivers of fertilizer additives market.
• Which are the top companies to hold the market share in Fertilizer Additives market?
The Fertilizer Additives market key players include Clariant AG, Arkema S.A, Dorf Ketal, ArrMaz, Timac Agro USA, Michelman, inc., Hubei Forbon Technology Co Ltd, Fertibon Products Pvt Ltd, Chemipol SA, Neelam Aqua & Speciality Chem (P) Ltd
• What is the leading application of Fertilizer Additives market?
Based on application, market is segmented into urea, ammonium nitrate, ammonium phosphate, ammonium sulphate and others. The urea segment accounted for the highest market share and held a share of 52.36 % in the year 2020. The most commonly used fertilizer across the globe is urea. It contains 46% nitrogen. Thus, it requires fertilizer additives to preserve its nitrogen content.
• Which is the largest regional market for Fertilizer Additives market?
The fertilizer additives market was dominated by Asia Pacific region and accounted for the market share of 43.54 % in the year 2020. Most of the economies of the nations in the Asia Pacific region are based mainly on agriculture. There has been a robust growth of these economies such as China, India and Southeast Asian. This is driving the growth of the market. The primary sector in these countries is the agriculture sector which determines the nation’s GDP.
Fertilizer Additives Market Segment Analysis
The fertilizer additives market is segmented based on type, application and region, global trends and forecast.By type, the market is bifurcated into anti-caking agents, dust suppressors, drying agents, by form into granular, powder and others, by application into urea, ammonium nitrate, monoammonium phosphate, manufacturing and region.
In terms of type, the Anti-caking Agents segment had a powerful influence on the market with respect to revenue in 2021 The anticaking agent segment led the global fertilizer additives market and held a market share of 38.69%. The caking of fertilizers is reduced by using anticaking agents. It also prevents formation of lumps and makes it easier to use the fertilizer. It eases the fertilizers packaging, transport and consumption.
[caption id="attachment_14105" align="aligncenter" width="1920"]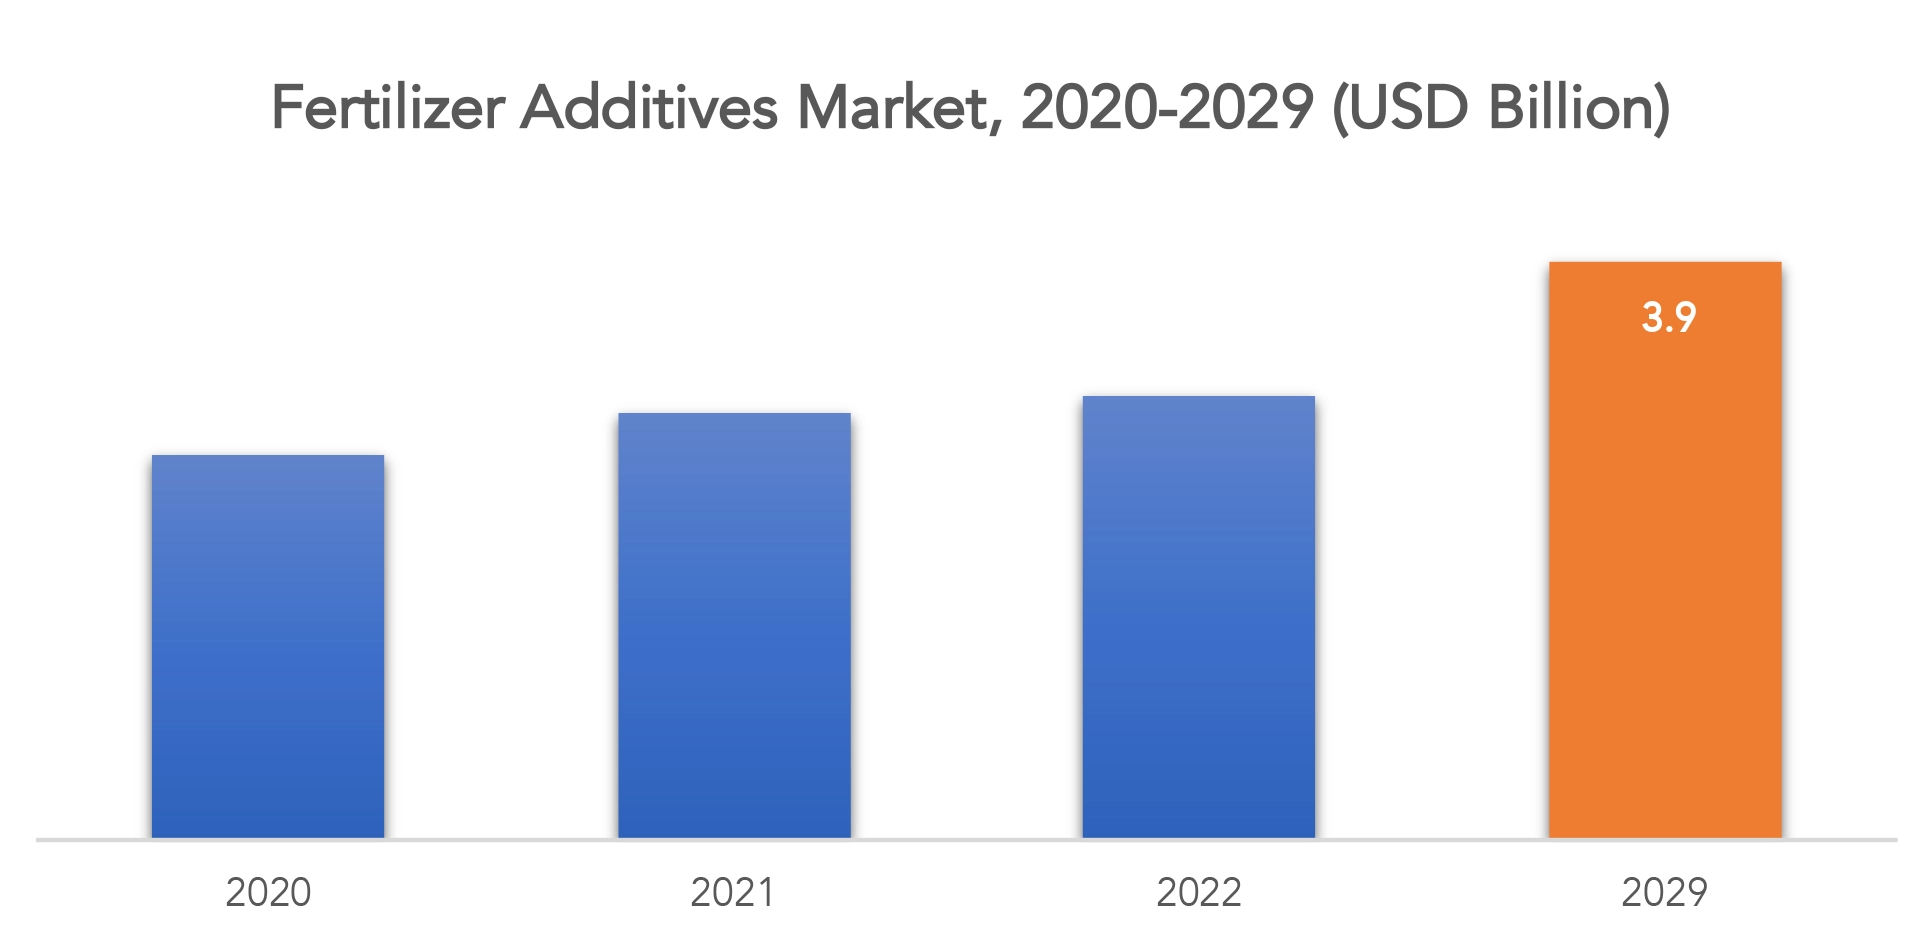
On the basis of form, it is segmented into granular, powder and others. The major market share is accounted by granular form. It grows at highest CAGR of 4.9 %. Granular form is low cost, easier for storage and have a better control of nutrient release.
Based on application, market is segmented into urea, ammonium nitrate, ammonium phosphate, ammonium sulphate and others. The urea segment accounted for the highest market share and held a share of 52.36 % in the year 2021 The most commonly used fertilizer across the globe is urea. It contains 46% nitrogen. Thus, it requires fertilizer additives to preserve its nitrogen content.
Fertilizer Additives Market Players
The Fertilizer Additives market key players include Clariant AG, Arkema S.A, Dorf Ketal, ArrMaz, Timac Agro USA, Michelman, inc., Hubei Forbon Technology Co Ltd, Fertibon Products Pvt Ltd, Chemipol SA, Neelam Aqua & Speciality Chem (P) Ltd. Recent Development: In December 2021, Timac Agro USA acquired rainbow plant food. Through this acquisition, the company is focusing on expanding its patented granular technologies along with using fertilizer additives. Michelam Inc., a key player in the fertilizer additive market is focusing on offering nature-friendly products. Thus, the company’s NurtureYield*K fertilizer additives is easily dissolved in water and works as a great fertilizer additive agent.Who Should Buy? Or Key stakeholders
- Fertilizer Additives Suppliers
- Raw Materials Manufacturers
- Research Organizations
- Investors
- Regulatory Authorities
- Others
Fertilizer Additives Market Regional Analysis
The Fertilizer Additives market by region includes North America, Asia-Pacific (APAC), Europe, South America, and Middle East & Africa (MEA).
- North America: includes the US, Canada, Mexico
- Asia Pacific: includes China, Japan, South Korea, India, Australia, ASEAN and Rest of APAC
- Europe: includes UK, Germany, France, Italy, Spain, Russia, and Rest of Europe
- South America: includes Brazil, Argentina and Rest of South America
- Middle East & Africa: includes Turkey, UAE, Saudi Arabia, South Africa, and Rest of MEA
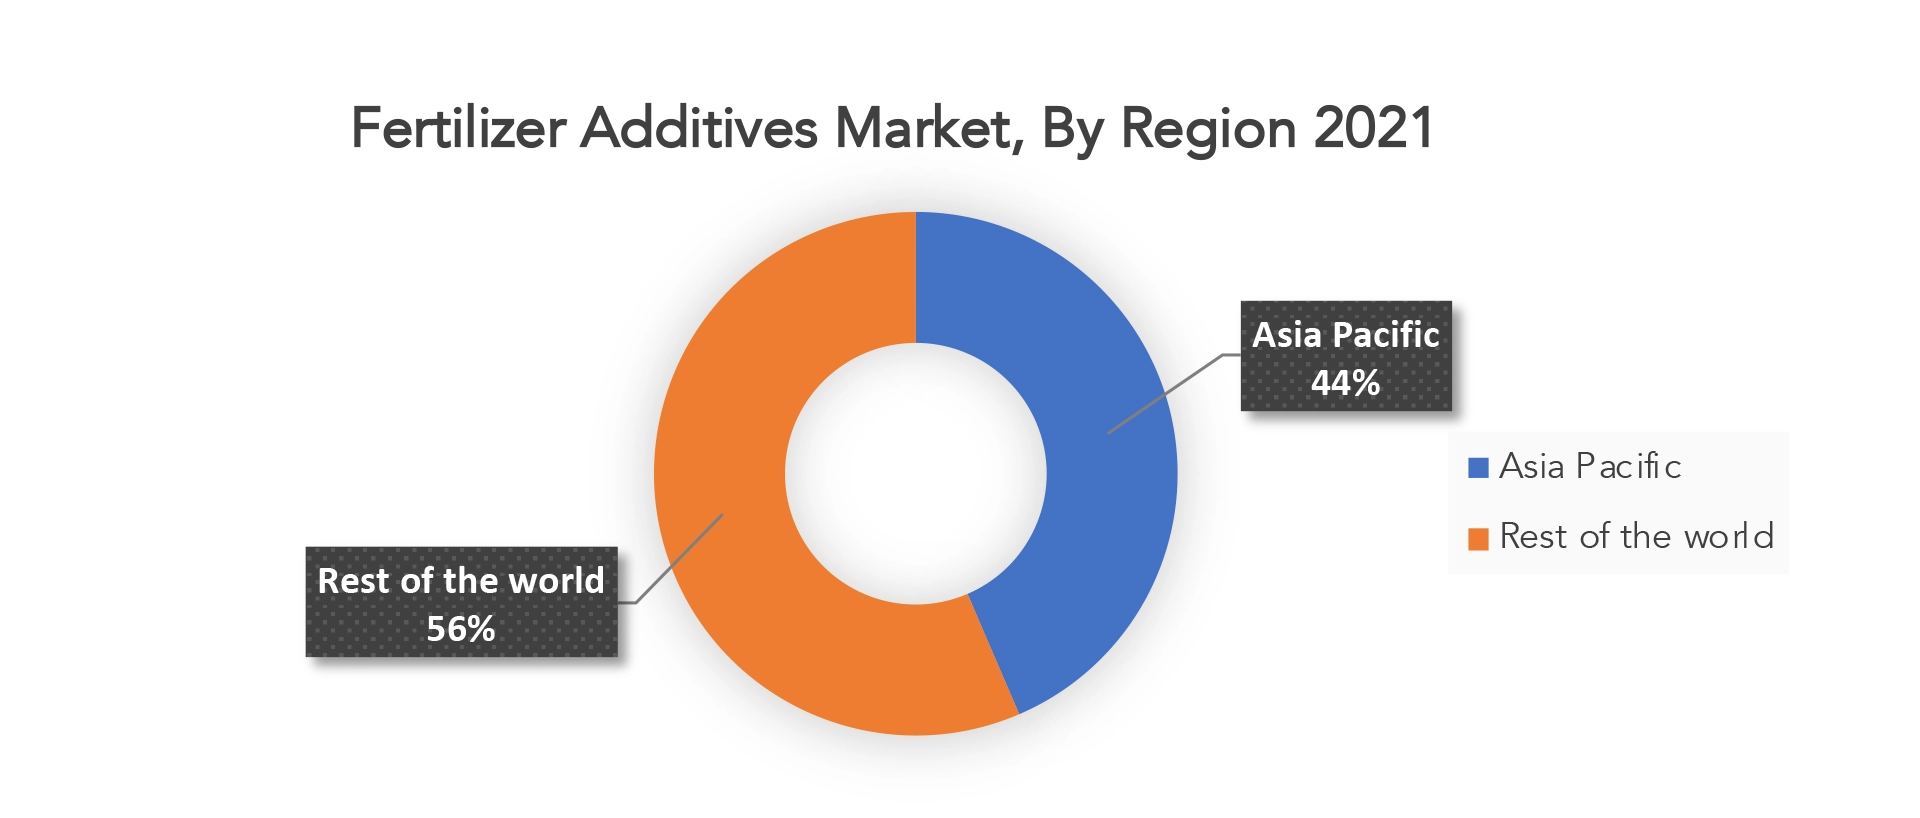
The fertilizer additives market was dominated by Asia Pacific region and accounted for the market share of 43.54 % in the year 2020.
Most of the economies of the nations in the Asia Pacific region are based mainly on agriculture. There has been a robust growth of these economies such as China, India and Southeast Asian. This is driving the growth of the market. The primary sector in these countries is the agriculture sector which determines the nation’s GDP.
In India fertilizer additives have high demand since the agriculture industry is worth USD 370 billion. It is one of the country’s most important industries. Government is taking initiatives for expanding agriculture industry thus creating different prospects for fertilizer additives growth.
A significant share in the fertilizer additives market was also held by North America. United States and Mexico have a more diverse agriculture sector. For crops such as corn, soybeans United States is one of the top global exporters. Thus, these countries show a fastest market growth in the forecast period.
Key Market Segments: Fertilizer Additives Market
Fertilizer Additives Market by Type, 2020-2029, (USD Billion), (Kilotons)- Anti-Caking Agents
- Dust Supressors
- Drying Agents
- Granulation Agents
- Granular
- Powder
- Urea
- Ammonium Nitrate
- Monoammonium Phosphate
- Ammonium Sulphate
- North America
- Asia Pacific
- Europe
- Latin America
- Middle East And Africa
Key Question Answered
- What is the current size of the fertilizer additives market?
- What are the key factors influencing the growth of Fertilizer Additives?
- What are the major applications for Fertilizer Additives?
- Who are the major key players in the Fertilizer Additives market?
- Which region will provide more business opportunities Fertilizer Additives in future?
- Which segment holds the maximum share of the Fertilizer Additives market?
- Introduzione
- Definizione di mercato
- Segmentazione del mercato
- Cronologie della ricerca
- Presupposti e limitazioni
- Metodologia di ricerca
- Estrazione dei dati
- Ricerca secondaria
- Ricerca primaria
- Consigli degli esperti in materia
- Controlli di qualità
- Revisione finale
- Triangolazione dei dati
- Approccio dal basso verso l'alto
- Approccio dall'alto verso il basso
- Flusso di ricerca
- Fonti dei dati
- Estrazione dei dati
- Sintesi
- Market Overview
- Global fertilizer additives market outlook
- Market Drivers
- Market Restraints
- Market Opportunities
- Impact of Covid-19 on fertilizer additives market
- Porter’s five forces model
- Threat from new entrants
- Threat from substitutes
- Bargaining power of suppliers
- Bargaining power of customers
- Degree of competition
- Industry value chain Analysis
- Global fertilizer additives market outlook
- Global Fertilizer Additives Market By Type, (USD Billion, Kilotons)
- Anti-caking agents
- DUST SUPRESSORS
- Drying agents
- Granulation agents
- Global Fertilizer Additives Market By Form, (USD Billion, Kilotons)
- Granular
- Powder
- Global Fertilizer Additives Market By Application, (USD Billion, Kilotons)
- Urea
- Ammonium nitrate
- Monoammonium Phosphate
- Ammonium Sulphate
- Global Fertilizer Additives Market By Region, (USD Billion, Kilotons)
- North America
- US
- Canada
- Mexico
- South America
- Brazil
- Argentina
- Colombia
- Rest Of South America
- Europe
- Germany
- UK
- France
- Italy
- Spain
- Russia
- Rest Of Europe
- Asia Pacific
- India
- China
- Japan
- South Korea
- Australia
- South-East Asia
- Rest Of Asia Pacific
- Middle East and Africa
- UAE
- Saudi Arabia
- South Africa
- Rest Of Middle East and Africa
- North America
- Company Profiles*
(Business Overview, Company Snapshot, Products Offered, Recent Developments)
- Clariant AG
- Arkema S.A
- Dorf Ketal
- ArrMaz
- Timac Agro USA
- Michelman inc.
- Hubei Forbon Technology Co Ltd
- Fertibon Products Pvt Ltd
- Chemipol SA
- Neelam Aqua & Speciality Chem (P) Ltd
*The Company List Is Indicative
LIST OF TABLES
TABLE 1 GLOBAL FERTILIZER ADDITIVES MARKET BY TYPE (USD BILLION), 2020-2029
TABLE 2 GLOBAL FERTILIZER ADDITIVES MARKET BY TYPE (KILOTONS), 2020-2029
TABLE 3 GLOBAL FERTILIZER ADDITIVES MARKET BY FORM (USD BILLION), 2020-2029
TABLE 4 GLOBAL FERTILIZER ADDITIVES MARKET BY FORM (KILOTONS), 2020-2029
TABLE 5 GLOBAL FERTILIZER ADDITIVES MARKET BY APPLICATION (USD BILLION), 2020-2029
TABLE 6 GLOBAL FERTILIZER ADDITIVES MARKET BY APPLICATION (KILOTONS), 2020-2029
TABLE 7 GLOBAL FERTILIZER ADDITIVES MARKET BY REGION (USD BILLION), 2020-2029
TABLE 8 GLOBAL FERTILIZER ADDITIVES MARKET BY REGION (KILOTONS), 2020-2029
TABLE 9 NORTH AMERICA FERTILIZER ADDITIVES MARKET BY TYPE (USD BILLION), 2020-2029
TABLE 10 NORTH AMERICA FERTILIZER ADDITIVES MARKET BY TYPE (KILOTONS), 2020-2029
TABLE 11 NORTH AMERICA FERTILIZER ADDITIVES MARKET BY FORM (USD BILLION), 2020-2029
TABLE 12 NORTH AMERICA FERTILIZER ADDITIVES MARKET BY FORM (KILOTONS), 2020-2029
TABLE 13 NORTH AMERICA FERTILIZER ADDITIVES MARKET BY APPLICATION (USD BILLION), 2020-2029
TABLE 14 NORTH AMERICA FERTILIZER ADDITIVES MARKET BY APPLICATION (KILOTONS), 2020-2029
TABLE 15 NORTH AMERICA FERTILIZER ADDITIVES MARKET BY COUNTRY (USD BILLION), 2020-2029
TABLE 16 NORTH AMERICA FERTILIZER ADDITIVES MARKET BY COUNTRY (KILOTONS), 2020-2029
TABLE 17 US FERTILIZER ADDITIVES MARKET BY TYPE (USD BILLION), 2020-2029
TABLE 18 US FERTILIZER ADDITIVES MARKET BY TYPE (KILOTONS), 2020-2029
TABLE 19 US FERTILIZER ADDITIVES MARKET BY FORM (USD BILLION), 2020-2029
TABLE 20 US FERTILIZER ADDITIVES MARKET BY FORM (KILOTONS), 2020-2029
TABLE 21 US FERTILIZER ADDITIVES MARKET BY APPLICATION (USD BILLION), 2020-2029
TABLE 22 US FERTILIZER ADDITIVES MARKET BY APPLICATION (KILOTONS), 2020-2029
TABLE 23 CANADA FERTILIZER ADDITIVES MARKET BY TYPE (BILLION), 2020-2029
TABLE 24 CANADA FERTILIZER ADDITIVES MARKET BY TYPE (KILOTONS), 2020-2029
TABLE 25 CANADA FERTILIZER ADDITIVES MARKET BY FORM (USD BILLION), 2020-2029
TABLE 26 CANADA FERTILIZER ADDITIVES MARKET BY FORM (KILOTONS), 2020-2029
TABLE 27 CANADA FERTILIZER ADDITIVES MARKET BY APPLICATION (USD BILLION), 2020-2029
TABLE 28 CANADA FERTILIZER ADDITIVES MARKET BY APPLICATION (KILOTONS), 2020-2029
TABLE 29 MEXICO FERTILIZER ADDITIVES MARKET BY TYPE (USD BILLION), 2020-2029
TABLE 30 MEXICO FERTILIZER ADDITIVES MARKET BY TYPE (KILOTONS), 2020-2029
TABLE 31 MEXICO FERTILIZER ADDITIVES MARKET BY FORM (USD BILLION), 2020-2029
TABLE 32 MEXICO FERTILIZER ADDITIVES MARKET BY FORM (KILOTONS), 2020-2029
TABLE 33 MEXICO FERTILIZER ADDITIVES MARKET BY APPLICATION (USD BILLION), 2020-2029
TABLE 34 MEXICO FERTILIZER ADDITIVES MARKET BY APPLICATION (KILOTONS), 2020-2029
TABLE 35 SOUTH AMERICA FERTILIZER ADDITIVES MARKET BY TYPE (USD BILLION), 2020-2029
TABLE 36 SOUTH AMERICA FERTILIZER ADDITIVES MARKET BY TYPE (KILOTONS), 2020-2029
TABLE 37 SOUTH AMERICA FERTILIZER ADDITIVES MARKET BY FORM (USD BILLION), 2020-2029
TABLE 38 SOUTH AMERICA FERTILIZER ADDITIVES MARKET BY FORM (KILOTONS), 2020-2029
TABLE 39 SOUTH AMERICA FERTILIZER ADDITIVES MARKET BY APPLICATION (USD BILLION), 2020-2029
TABLE 40 SOUTH AMERICA FERTILIZER ADDITIVES MARKET BY APPLICATION (KILOTONS), 2020-2029
TABLE 41 BRAZIL FERTILIZER ADDITIVES MARKET BY TYPE (USD BILLION), 2020-2029
TABLE 42 BRAZIL FERTILIZER ADDITIVES MARKET BY TYPE (KILOTONS), 2020-2029
TABLE 43 BRAZIL FERTILIZER ADDITIVES MARKET BY FORM (USD BILLION), 2020-2029
TABLE 44 BRAZIL FERTILIZER ADDITIVES MARKET BY FORM (KILOTONS), 2020-2029
TABLE 45 BRAZIL FERTILIZER ADDITIVES MARKET BY APPLICATION (USD BILLION), 2020-2029
TABLE 46 BRAZIL FERTILIZER ADDITIVES MARKET BY APPLICATION (KILOTONS), 2020-2029
TABLE 47 ARGENTINA FERTILIZER ADDITIVES MARKET BY TYPE (USD BILLION), 2020-2029
TABLE 48 ARGENTINA FERTILIZER ADDITIVES MARKET BY TYPE (KILOTONS), 2020-2029
TABLE 49 ARGENTINA FERTILIZER ADDITIVES MARKET BY FORM (USD BILLION), 2020-2029
TABLE 50 ARGENTINA FERTILIZER ADDITIVES MARKET BY FORM (KILOTONS), 2020-2029
TABLE 51 ARGENTINA FERTILIZER ADDITIVES MARKET BY APPLICATION (USD BILLION), 2020-2029
TABLE 52 ARGENTINA FERTILIZER ADDITIVES MARKET BY APPLICATION (KILOTONS), 2020-2029
TABLE 53 COLOMBIA FERTILIZER ADDITIVES MARKET BY TYPE (USD BILLION), 2020-2029
TABLE 54 COLOMBIA FERTILIZER ADDITIVES MARKET BY TYPE (KILOTONS), 2020-2029
TABLE 55 COLOMBIA FERTILIZER ADDITIVES MARKET BY FORM (USD BILLION), 2020-2029
TABLE 56 COLOMBIA FERTILIZER ADDITIVES MARKET BY FORM (KILOTONS), 2020-2029
TABLE 57 COLOMBIA FERTILIZER ADDITIVES MARKET BY APPLICATION (USD BILLION), 2020-2029
TABLE 58 COLOMBIA FERTILIZER ADDITIVES MARKET BY APPLICATION (KILOTONS), 2020-2029
TABLE 59 REST OF SOUTH AMERICA FERTILIZER ADDITIVES MARKET BY TYPE (USD BILLION), 2020-2029
TABLE 60 REST OF SOUTH AMERICA FERTILIZER ADDITIVES MARKET BY TYPE (KILOTONS), 2020-2029
TABLE 61 REST OF SOUTH AMERICA FERTILIZER ADDITIVES MARKET BY FORM (USD BILLION), 2020-2029
TABLE 62 REST OF SOUTH AMERICA FERTILIZER ADDITIVES MARKET BY FORM (KILOTONS), 2020-2029
TABLE 63 REST OF SOUTH AMERICA FERTILIZER ADDITIVES MARKET BY APPLICATION (USD BILLION), 2020-2029
TABLE 64 REST OF SOUTH AMERICA FERTILIZER ADDITIVES MARKET BY APPLICATION (KILOTONS), 2020-2029
TABLE 65 ASIA-PACIFIC FERTILIZER ADDITIVES MARKET BY TYPE (USD BILLION), 2020-2029
TABLE 66 ASIA-PACIFIC FERTILIZER ADDITIVES MARKET BY TYPE (KILOTONS), 2020-2029
TABLE 67 ASIA-PACIFIC FERTILIZER ADDITIVES MARKET BY FORM (USD BILLION), 2020-2029
TABLE 68 ASIA-PACIFIC FERTILIZER ADDITIVES MARKET BY FORM (KILOTONS), 2020-2029
TABLE 69 ASIA-PACIFIC FERTILIZER ADDITIVES MARKET BY APPLICATION (USD BILLION), 2020-2029
TABLE 70 ASIA-PACIFIC FERTILIZER ADDITIVES MARKET BY APPLICATION (KILOTONS), 2020-2029
TABLE 71 ASIA-PACIFIC FERTILIZER ADDITIVES MARKET BY COUNTRY (USD BILLION), 2020-2029
TABLE 72 ASIA-PACIFIC FERTILIZER ADDITIVES MARKET BY COUNTRY (KILOTONS), 2020-2029
TABLE 73 INDIA FERTILIZER ADDITIVES MARKET BY TYPE (USD BILLION), 2020-2029
TABLE 74 INDIA FERTILIZER ADDITIVES MARKET BY TYPE (KILOTONS), 2020-2029
TABLE 75 INDIA FERTILIZER ADDITIVES MARKET BY FORM (USD BILLION), 2020-2029
TABLE 76 INDIA FERTILIZER ADDITIVES MARKET BY FORM (KILOTONS), 2020-2029
TABLE 77 INDIA FERTILIZER ADDITIVES MARKET BY APPLICATION (USD BILLION), 2020-2029
TABLE 78 INDIA FERTILIZER ADDITIVES MARKET BY APPLICATION (KILOTONS), 2020-2029
TABLE 79 CHINA FERTILIZER ADDITIVES MARKET BY TYPE (USD BILLION), 2020-2029
TABLE 80 CHINA FERTILIZER ADDITIVES MARKET BY TYPE (KILOTONS), 2020-2029
TABLE 81 CHINA FERTILIZER ADDITIVES MARKET BY FORM (USD BILLION), 2020-2029
TABLE 82 CHINA FERTILIZER ADDITIVES MARKET BY FORM (KILOTONS), 2020-2029
TABLE 83 CHINA FERTILIZER ADDITIVES MARKET BY APPLICATION (USD BILLION), 2020-2029
TABLE 84 CHINA FERTILIZER ADDITIVES MARKET BY APPLICATION (KILOTONS), 2020-2029
TABLE 85 JAPAN FERTILIZER ADDITIVES MARKET BY TYPE (USD BILLION), 2020-2029
TABLE 86 JAPAN FERTILIZER ADDITIVES MARKET BY TYPE (KILOTONS), 2020-2029
TABLE 87 JAPAN FERTILIZER ADDITIVES MARKET BY FORM (USD BILLION), 2020-2029
TABLE 88 JAPAN FERTILIZER ADDITIVES MARKET BY FORM (KILOTONS), 2020-2029
TABLE 89 JAPAN FERTILIZER ADDITIVES MARKET BY APPLICATION (USD BILLION), 2020-2029
TABLE 90 JAPAN FERTILIZER ADDITIVES MARKET BY APPLICATION (KILOTONS), 2020-2029
TABLE 91 SOUTH KOREA FERTILIZER ADDITIVES MARKET BY TYPE (USD BILLION), 2020-2029
TABLE 92 SOUTH KOREA FERTILIZER ADDITIVES MARKET BY TYPE (KILOTONS), 2020-2029
TABLE 93 SOUTH KOREA FERTILIZER ADDITIVES MARKET BY FORM (USD BILLION), 2020-2029
TABLE 94 SOUTH KOREA FERTILIZER ADDITIVES MARKET BY FORM (KILOTONS), 2020-2029
TABLE 95 SOUTH KOREA FERTILIZER ADDITIVES MARKET BY APPLICATION (USD BILLION), 2020-2029
TABLE 96 SOUTH KOREA FERTILIZER ADDITIVES MARKET BY APPLICATION (KILOTONS), 2020-2029
TABLE 97 AUSTRALIA FERTILIZER ADDITIVES MARKET BY TYPE (USD BILLION), 2020-2029
TABLE 98 AUSTRALIA FERTILIZER ADDITIVESBY TYPE (KILOTONS), 2020-2029
TABLE 99 AUSTRALIA FERTILIZER ADDITIVES MARKET BY FORM (USD BILLION), 2020-2029
TABLE 100 AUSTRALIA FERTILIZER ADDITIVES MARKET BY FORM (KILOTONS), 2020-2029
TABLE 101 AUSTRALIA FERTILIZER ADDITIVES MARKET BY APPLICATION (USD BILLION), 2020-2029
TABLE 102 AUSTRALIA FERTILIZER ADDITIVES MARKET BY APPLICATION (KILOTONS), 2020-2029
TABLE 103 SOUTH EAST ASIA FERTILIZER ADDITIVES MARKET BY TYPE (USD BILLION), 2020-2029
TABLE 104 SOUTH EAST ASIA FERTILIZER ADDITIVESBY TYPE (KILOTONS), 2020-2029
TABLE 105 SOUTH EAST ASIA FERTILIZER ADDITIVES MARKET BY FORM (USD BILLION), 2020-2029
TABLE 106 SOUTH EAST ASIA FERTILIZER ADDITIVES MARKET BY FORM (KILOTONS), 2020-2029
TABLE 107 SOUTH EAST ASIA FERTILIZER ADDITIVES MARKET BY APPLICATION (USD BILLION), 2020-2029
TABLE 108 SOUTH EAST ASIA FERTILIZER ADDITIVES MARKET BY APPLICATION (KILOTONS), 2020-2029
TABLE 109 REST OF ASIA PACIFIC FERTILIZER ADDITIVES MARKET BY TYPE (USD BILLION), 2020-2029
TABLE 110 REST OF ASIA PACIFIC FERTILIZER ADDITIVESBY TYPE (KILOTONS), 2020-2029
TABLE 111 REST OF ASIA PACIFIC FERTILIZER ADDITIVES MARKET BY FORM (USD BILLION), 2020-2029
TABLE 112 REST OF ASIA PACIFIC FERTILIZER ADDITIVES MARKET BY FORM (KILOTONS), 2020-2029
TABLE 113 REST OF ASIA PACIFIC FERTILIZER ADDITIVES MARKET BY APPLICATION (USD BILLION), 2020-2029
TABLE 114 REST OF ASIA PACIFIC FERTILIZER ADDITIVES MARKET BY APPLICATION (KILOTONS), 2020-2029
TABLE 115 EUROPE FERTILIZER ADDITIVES MARKET BY TYPE (USD BILLION), 2020-2029
TABLE 116 EUROPE FERTILIZER ADDITIVES MARKET BY TYPE (KILOTONS), 2020-2029
TABLE 117 EUROPE FERTILIZER ADDITIVES MARKET BY FORM (USD BILLION), 2020-2029
TABLE 118 EUROPE FERTILIZER ADDITIVES MARKET BY FORM (KILOTONS), 2020-2029
TABLE 119 EUROPE FERTILIZER ADDITIVES MARKET BY APPLICATION (USD BILLION), 2020-2029
TABLE 120 EUROPE FERTILIZER ADDITIVES MARKET BY APPLICATION (KILOTONS), 2020-2029
TABLE 121 EUROPE FERTILIZER ADDITIVES MARKET BY COUNTRY (USD BILLION), 2020-2029
TABLE 122 EUROPE FERTILIZER ADDITIVES MARKET BY COUNTRY (KILOTONS), 2020-2029
TABLE 123 GERMANY FERTILIZER ADDITIVES MARKET BY TYPE (USD BILLION), 2020-2029
TABLE 124 GERMANY FERTILIZER ADDITIVES MARKET BY TYPE (KILOTONS), 2020-2029
TABLE 125 GERMANY FERTILIZER ADDITIVES MARKET BY FORM (USD BILLION), 2020-2029
TABLE 126 GERMANY FERTILIZER ADDITIVES MARKET BY FORM (KILOTONS), 2020-2029
TABLE 127 GERMANY FERTILIZER ADDITIVES MARKET BY APPLICATION (USD BILLION), 2020-2029
TABLE 128 GERMANY FERTILIZER ADDITIVES MARKET BY APPLICATION (KILOTONS), 2020-2029
TABLE 129 UK FERTILIZER ADDITIVES MARKET BY TYPE (USD BILLION), 2020-2029
TABLE 130 UK FERTILIZER ADDITIVES MARKET BY TYPE (KILOTONS), 2020-2029
TABLE 131 UK FERTILIZER ADDITIVES MARKET BY FORM (USD BILLION), 2020-2029
TABLE 132 UK FERTILIZER ADDITIVES MARKET BY FORM (KILOTONS), 2020-2029
TABLE 133 UK FERTILIZER ADDITIVES MARKET BY APPLICATION (USD BILLION), 2020-2029
TABLE 134 UK FERTILIZER ADDITIVES MARKET BY APPLICATION (KILOTONS), 2020-2029
TABLE 135 FRANCE FERTILIZER ADDITIVES MARKET BY TYPE (USD BILLION), 2020-2029
TABLE 136 FRANCE FERTILIZER ADDITIVES MARKET BY TYPE (KILOTONS), 2020-2029
TABLE 137 FRANCE FERTILIZER ADDITIVES MARKET BY FORM (USD BILLION), 2020-2029
TABLE 138 FRANCE FERTILIZER ADDITIVES MARKET BY FORM (KILOTONS), 2020-2029
TABLE 139 FRANCE FERTILIZER ADDITIVES MARKET BY APPLICATION (USD BILLION), 2020-2029
TABLE 140 FRANCE FERTILIZER ADDITIVES MARKET BY APPLICATION (KILOTONS), 2020-2029
TABLE 141 ITALY FERTILIZER ADDITIVES MARKET BY TYPE (USD BILLION), 2020-2029
TABLE 142 ITALY FERTILIZER ADDITIVES MARKET BY TYPE (KILOTONS), 2020-2029
TABLE 143 ITALY FERTILIZER ADDITIVES MARKET BY FORM (USD BILLION), 2020-2029
TABLE 144 ITALY FERTILIZER ADDITIVES MARKET BY FORM (KILOTONS), 2020-2029
TABLE 145 ITALY FERTILIZER ADDITIVES MARKET BY APPLICATION (USD BILLION), 2020-2029
TABLE 146 ITALY FERTILIZER ADDITIVES MARKET BY APPLICATION (KILOTONS), 2020-2029
TABLE 147 SPAIN FERTILIZER ADDITIVES MARKET BY TYPE (USD BILLION), 2020-2029
TABLE 148 SPAIN FERTILIZER ADDITIVES MARKET BY TYPE (KILOTONS), 2020-2029
TABLE 149 SPAIN FERTILIZER ADDITIVES MARKET BY FORM (USD BILLION), 2020-2029
TABLE 150 SPAIN FERTILIZER ADDITIVES MARKET BY FORM (KILOTONS), 2020-2029
TABLE 151 SPAIN FERTILIZER ADDITIVES MARKET BY APPLICATION (USD BILLION), 2020-2029
TABLE 152 SPAIN FERTILIZER ADDITIVES MARKET BY APPLICATION (KILOTONS), 2020-2029
TABLE 153 RUSSIA FERTILIZER ADDITIVES MARKET BY TYPE (USD BILLION), 2020-2029
TABLE 154 RUSSIA FERTILIZER ADDITIVES MARKET BY TYPE (KILOTONS), 2020-2029
TABLE 155 RUSSIA FERTILIZER ADDITIVES MARKET BY FORM (USD BILLION), 2020-2029
TABLE 156 RUSSIA FERTILIZER ADDITIVES MARKET BY FORM (KILOTONS), 2020-2029
TABLE 157 RUSSIA FERTILIZER ADDITIVES MARKET BY APPLICATION (USD BILLION), 2020-2029
TABLE 158 RUSSIA FERTILIZER ADDITIVES MARKET BY APPLICATION (KILOTONS), 2020-2029
TABLE 159 REST OF EUROPE FERTILIZER ADDITIVES MARKET BY TYPE (USD BILLION), 2020-2029
TABLE 160 REST OF EUROPE FERTILIZER ADDITIVES MARKET BY TYPE (KILOTONS), 2020-2029
TABLE 161 REST OF EUROPE FERTILIZER ADDITIVES MARKET BY FORM (USD BILLION), 2020-2029
TABLE 162 REST OF EUROPE FERTILIZER ADDITIVES MARKET BY FORM (KILOTONS), 2020-2029
TABLE 163 REST OF EUROPE FERTILIZER ADDITIVES MARKET BY APPLICATION (USD BILLION), 2020-2029
TABLE 164 REST OF EUROPE FERTILIZER ADDITIVES MARKET BY APPLICATION (KILOTONS), 2020-2029
TABLE 165 MIDDLE EAST AND AFRICA FERTILIZER ADDITIVES MARKET BY TYPE (USD BILLION), 2020-2029
TABLE 166 MIDDLE EAST AND AFRICA FERTILIZER ADDITIVES MARKET BY TYPE (KILOTONS), 2020-2029
TABLE 167 MIDDLE EAST AND AFRICA FERTILIZER ADDITIVES MARKET BY FORM (USD BILLION), 2020-2029
TABLE 168 MIDDLE EAST AND AFRICA FERTILIZER ADDITIVES MARKET BY FORM (KILOTONS), 2020-2029
TABLE 169 MIDDLE EAST AND AFRICA FERTILIZER ADDITIVES MARKET BY APPLICATION (USD BILLION), 2020-2029
TABLE 170 MIDDLE EAST AND AFRICA FERTILIZER ADDITIVES MARKET BY APPLICATION (KILOTONS), 2020-2029
TABLE 171 MIDDLE EAST AND AFRICA FERTILIZER ADDITIVES MARKET BY COUNTRY (USD BILLION), 2020-2029
TABLE 172 MIDDLE EAST AND AFRICA FERTILIZER ADDITIVES MARKET BY COUNTRY (KILOTONS), 2020-2029
TABLE 173 UAE FERTILIZER ADDITIVES MARKET BY TYPE (USD BILLION), 2020-2029
TABLE 174 UAE FERTILIZER ADDITIVES MARKET BY TYPE (KILOTONS), 2020-2029
TABLE 175 UAE FERTILIZER ADDITIVES MARKET BY FORM (USD BILLION), 2020-2029
TABLE 176 UAE FERTILIZER ADDITIVES MARKET BY FORM (KILOTONS), 2020-2029
TABLE 177 UAE FERTILIZER ADDITIVES MARKET BY APPLICATION (USD BILLION), 2020-2029
TABLE 178 UAE FERTILIZER ADDITIVES MARKET BY APPLICATION (KILOTONS), 2020-2029
TABLE 179 SAUDI ARABIA FERTILIZER ADDITIVES MARKET BY TYPE (USD BILLION), 2020-2029
TABLE 180 SAUDI ARABIA FERTILIZER ADDITIVES MARKET BY TYPE (KILOTONS), 2020-2029
TABLE 181 SAUDI ARABIA FERTILIZER ADDITIVES MARKET BY FORM (USD BILLION), 2020-2029
TABLE 182 SAUDI ARABIA FERTILIZER ADDITIVES MARKET BY FORM (KILOTONS), 2020-2029
TABLE 183 SAUDI ARABIA FERTILIZER ADDITIVES MARKET BY APPLICATION (USD BILLION), 2020-2029
TABLE 184 SAUDI ARABIA FERTILIZER ADDITIVES MARKET BY APPLICATION (KILOTONS), 2020-2029
TABLE 185 SOUTH AFRICA FERTILIZER ADDITIVES MARKET BY TYPE (USD BILLION), 2020-2029
TABLE 186 SOUTH AFRICA FERTILIZER ADDITIVES MARKET BY TYPE (KILOTONS), 2020-2029
TABLE 187 SOUTH AFRICA FERTILIZER ADDITIVES MARKET BY FORM (USD BILLION), 2020-2029
TABLE 188 SOUTH AFRICA FERTILIZER ADDITIVES MARKET BY FORM (KILOTONS), 2020-2029
TABLE 189 SOUTH AFRICA FERTILIZER ADDITIVES MARKET BY APPLICATION (USD BILLION), 2020-2029
TABLE 190 SOUTH AFRICA FERTILIZER ADDITIVES MARKET BY APPLICATION (KILOTONS), 2020-2029
TABLE 191 REST OF MIDDLE EAST AND AFRICA FERTILIZER ADDITIVES MARKET BY TYPE (USD BILLION), 2020-2029
TABLE 192 REST OF MIDDLE EAST AND AFRICA FERTILIZER ADDITIVES MARKET BY TYPE (KILOTONS), 2020-2029
TABLE 193 REST OF MIDDLE EAST AND AFRICA FERTILIZER ADDITIVES MARKET BY FORM (USD BILLION), 2020-2029
TABLE 194 REST OF MIDDLE EAST AND AFRICA FERTILIZER ADDITIVES MARKET BY FORM (KILOTONS), 2020-2029
TABLE 195 REST OF MIDDLE EAST AND AFRICA FERTILIZER ADDITIVES MARKET BY APPLICATION (USD BILLION), 2020-2029
TABLE 196 REST OF MIDDLE EAST AND AFRICA FERTILIZER ADDITIVES MARKET BY APPLICATION (KILOTONS), 2020-2029
LIST OF FIGURES
FIGURE 1 MARKET DYNAMICS
FIGURE 2 MARKET SEGMENTATION
FIGURE 3 REPORT TIMELINES: YEARS CONSIDERED
FIGURE 4 DATA TRIANGULATION
FIGURE 5 BOTTOM-UP APPROACH
FIGURE 6 TOP-DOWN APPROACH
FIGURE 7 RESEARCH FLOW
FIGURE 8 GLOBAL FERTILIZER ADDITIVES BY TYPE, USD BILLION, 2020-2029
FIGURE 9 GLOBAL FERTILIZER ADDITIVES BY FORM, USD BILLION, 2020-2029
FIGURE 10 GLOBAL FERTILIZER ADDITIVES BY APPLICATION, USD BILLION, 2020-2029
FIGURE 11 GLOBAL FERTILIZER ADDITIVES BY REGION, USD BILLION, 2020-2029
FIGURE 12 PORTER’S FIVE FORCES MODEL
FIGURE 13 FERTILIZER ADDITIVES MARKET BY REGION 2021
FIGURE 14 FERTILIZER ADDITIVES MARKET BY FORM 2021
FIGURE 15 FERTILIZER ADDITIVES MARKET BY TYPE 2021
FIGURE 16 FERTILIZER ADDITIVES MARKET BY APPLICATION 2021
FIGURE 17 MARKET SHARE ANALYSIS
FIGURE 18 CLARIANT AG: COMPANY SNAPSHOT
FIGURE 19 ARKEMA S.A: COMPANY SNAPSHOT
FIGURE 20 DORF KETAL: COMPANY SNAPSHOT
FIGURE 21 ARRMAZ: COMPANY SNAPSHOT
FIGURE 22 TIMAC AGRO USA: COMPANY SNAPSHOT
FIGURE 23 MICHELMAN, INC.: COMPANY SNAPSHOT
FIGURE 24 HUBEI FORBON TECHNOLOGY CO LTD: COMPANY SNAPSHOT
FIGURE 25 FERTIBON PRODUCTS PVT LTD: COMPANY SNAPSHOT
FIGURE 26 CHEMIPOL SA: COMPANY SNAPSHOT
FIGURE 27 NEELAM AQUA & SPECIALITY CHEM (P) LTD: COMPANY SNAPSHOT
DOWNLOAD FREE SAMPLE REPORT
License Type
SPEAK WITH OUR ANALYST
Want to know more about the report or any specific requirement?
WANT TO CUSTOMIZE THE REPORT?
Our Clients Speak
We asked them to research ‘ Equipment market’ all over the world, and their whole arrangement was helpful to us. thehealthanalytics.com insightful analysis and reports contributed to our current analysis and in creating a future strategy. Besides, the te
Yosuke Mitsui
Senior Associate Construction Equipment Sales & Marketing
We asked them to research ‘Equipment market’ all over the world, and their whole arrangement was helpful to us. thehealthanalytics.com insightful analysis and reports contributed to our current analysis and in creating a future strategy. Besides, the te


