

Base Year Value ()
x.x %
x.x %
CAGR ()
x.x %
x.x %
Forecast Year Value ()
x.x %
x.x %
Historical Data Period
Largest Region
Forecast Period
Mercato dei nanocompositi per tipo (matrice polimerica, matrice metallica, matrice ceramica), per prodotto (nanotubi di carbonio, nanoargilla, metallo/ossido metallico), per applicazione (imballaggio, automotive, elettronica elettrica) e regione, tendenze globali e previsioni dal 2022 al 2029
Instant access to hundreds of data points and trends
- Market estimates from 2014-2029
- Competitive analysis, industry segmentation, financial benchmarks
- Incorporates SWOT, Porter's Five Forces and risk management frameworks
- PDF report or online database with Word, Excel and PowerPoint export options
- 100% money back guarantee
Panoramica del mercato dei nanocompositi
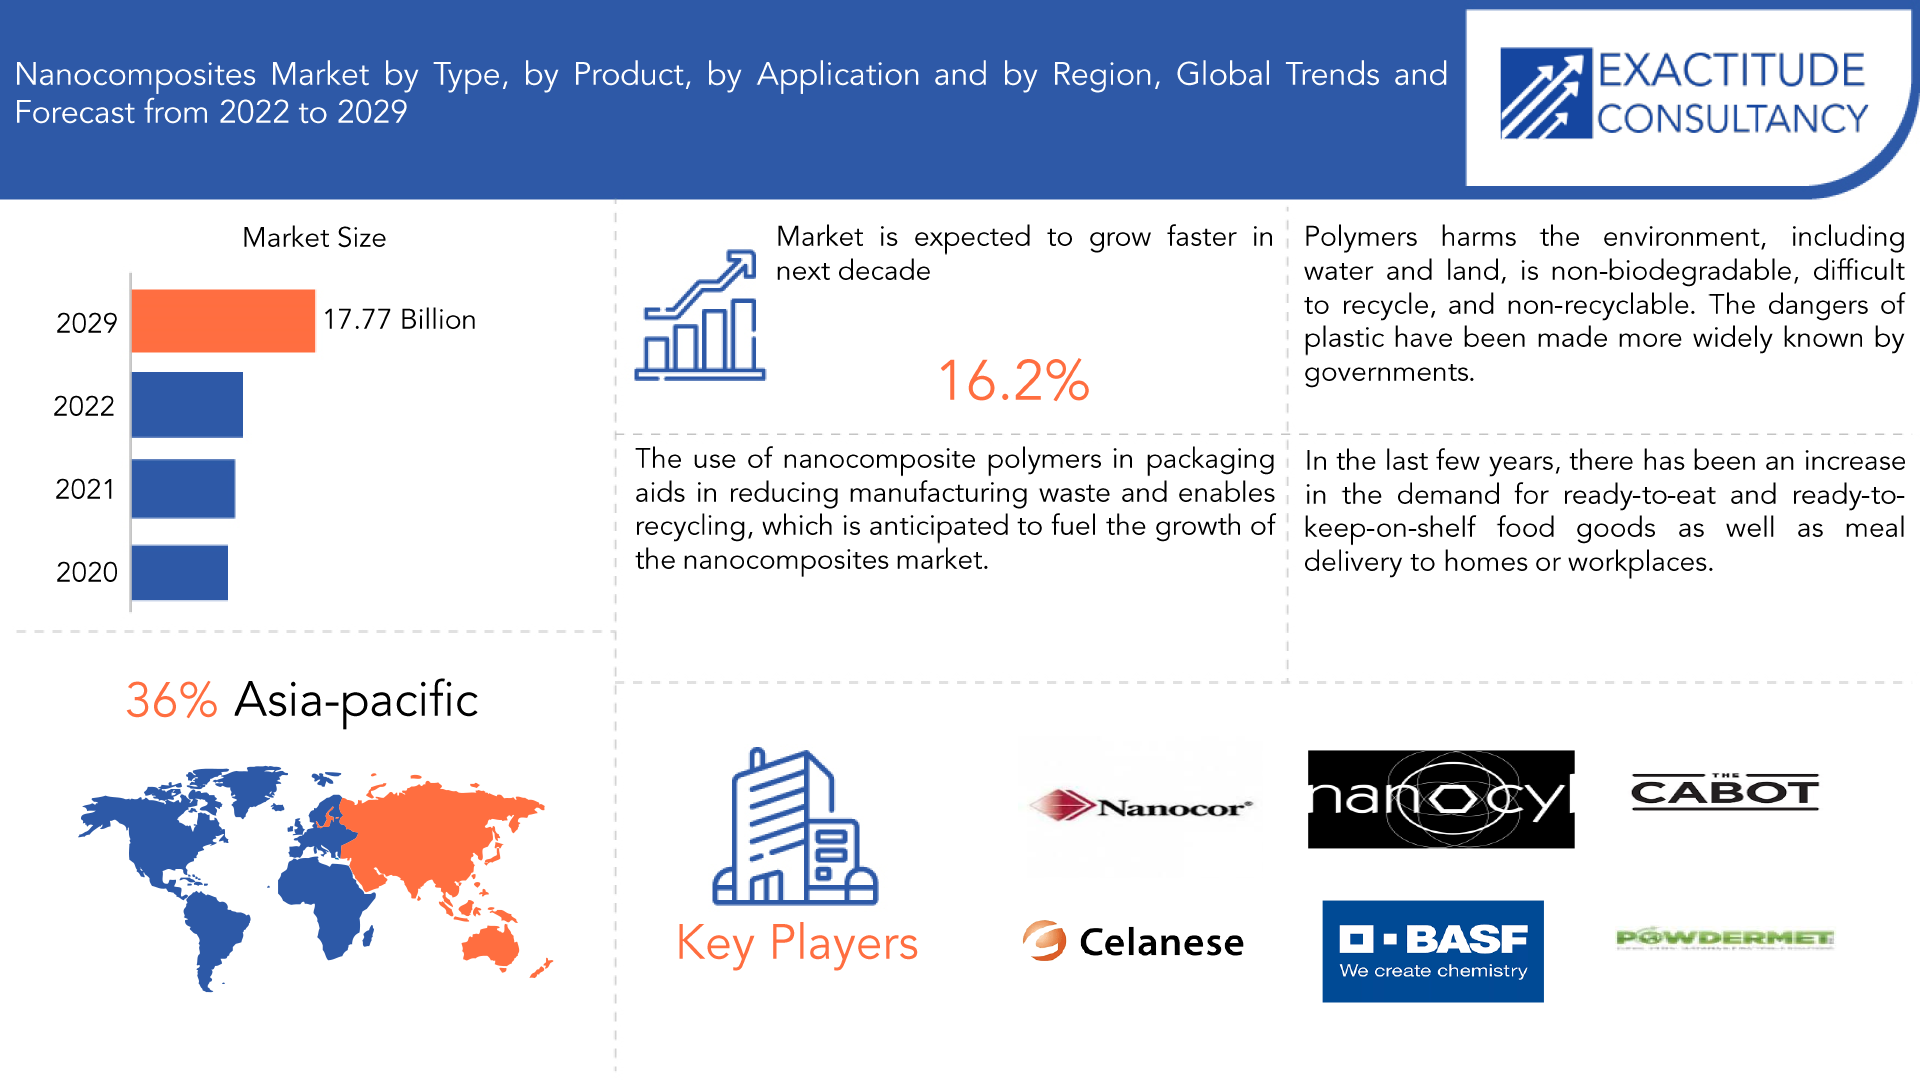
Si prevede che il mercato dei nanocompositi crescerà al 16,2% di CAGR dal 2022 al 2029. Si prevede che raggiungerà oltre 17,77 miliardi di USD entro il 2029 dai 4,6 miliardi di USD del 2020.
I compositi con una fase con una dimensione nell'intervallo nanometrico sono noti come nanocompositi. Sono realizzati mescolando materiali inorganici come ossidi, argille e polimeri in scala nanometrica con solidi inorganici come solidi inorganici. Le matrici polimeriche organiche con una dimensione nell'intervallo nanometrico sono i mattoni dei nanocompositi, che sono fatti di particelle inorganiche. Grazie ai suoi numerosi vantaggi, tra cui elevata resistenza alla trazione, caratteristiche ottiche e magnetiche migliorate, elevata resistenza alla corrosione ed elevata conduttività termica ed elettronica, i nanocompositi stanno diventando sempre più importanti negli ultimi anni. Inoltre, uno dei materiali più resistenti e duraturi sulla terra è il grafene. Anche la sua conduttività termica è molto elevata. Quindi, i nanocompositi grafene -polimero hanno dimostrato un potenziale significativo come materiali funzionali o strutturali del futuro. La creazione di beni nanocompositi utilizza in genere la tecnica della nanotecnologia. Combinando chimica, fisica, scienza dei materiali e biologia, la nanotecnologia mira a produrre nuovi materiali con caratteristiche uniche che possono essere utilizzati per produrre facilmente materiali ad alte prestazioni, elettronica e dispositivi biomedici . L'espansione del mercato è guidata dalla rapida adozione di nanocompositi da parte dell'industria del packaging. Funzionano come materiale di imballaggio alimentare attivo e intelligente e hanno diverse qualità, tra cui quelle meccaniche, termiche e biodegradabili. C'è molto interesse nel creare materiali di imballaggio con meno lavorazione e una maggiore durata di conservazione nel mercato attuale. Il mercato dei nanocompositi si sta espandendo a causa della crescente domanda da parte di numerose industrie di utilizzo finale, tra cui i settori automobilistico, aerospaziale, energetico ed edile. Le applicazioni biomediche sono utilizzate in procedure come l'ingegneria tissutale, le medicazioni per ferite, la terapia del cancro, la terapia con cellule staminali , le protesi cardiache e l'immobilizzazione enzimatica. Uno degli elementi principali che potrebbe avere un impatto negativo sui ricavi complessivi del mercato nei prossimi anni è l'elevato costo di produzione dei nanocompositi.
| ATTRIBUTO | DETTAGLI |
| Periodo di studio | 2020-2029 |
| Anno base | 2022 |
| Anno stimato | 2022 |
| Anno previsto | 2022-2029 |
| Periodo storico | 2018-2020 |
| Unità | Valore (miliardi di USD) (chilotoni) |
| Segmentazione | Per tipo, per prodotto, per applicazione, per regione |
| Per tipo |
|
| Per prodotto |
|
| Per applicazione |
|
| Per regione |
|
Nel periodo di previsione, si prevede che il mercato mondiale dei nanocompositi sarà guidato dal crescente utilizzo di pannelli compositi in alluminio leggero per l'isolamento nel settore edile. I nanocompositi sono sempre più impiegati nel settore degli imballaggi alimentari, in particolare nel confezionamento di formaggi, dolciumi, carni lavorate, alimenti bolliti in busta e cereali, tra gli altri alimenti, a causa della loro bassa permeabilità a gas, acqua e idrocarburi. Inoltre, l'uso di polimeri nanocompositi negli imballaggi aiuta a ridurre gli scarti di produzione e consente il riciclaggio, che si prevede alimenterà la crescita del mercato dei nanocompositi.
A causa delle rigide normative stabilite dai governi e dalle organizzazioni locali, l'attuale pandemia di COVID-19 ha avuto un impatto significativo sull'industria mondiale dei nanocompositi. La pandemia ha avuto un impatto negativo sulle operazioni di molte aziende, ma il settore degli imballaggi alimentari ha visto un forte aumento nell'uso di nanocompositi. A causa degli standard di distanziamento sociale, c'è stato un aumento significativo della necessità di prodotti alimentari confezionati e pacchi da asporto, il che ha aumentato la domanda di pellicole e cartoni per imballaggi in nanocompositi. Inoltre, l'uso dell'e-learning nelle scuole, nelle università e in altre istituzioni educative sta creando un'opportunità e aumentando la domanda di dispositivi elettronici touch screen come smartphone, laptop, display TV e altri gadget. Gli unici settori che non sono stati seriamente colpiti sono quelli che producono forniture mediche e articoli per il supporto vitale, tuttavia il settore dei nanocompositi ha subito perdite significative. A causa delle restrizioni di viaggio e di chiusura del governo, la crescita del mercato dei nanocompositi è stata soffocata. A causa di ragioni tra cui la chiusura globale delle catene di fornitura delle materie prime, la pandemia di COVID-19 ha avuto un impatto sulla crescita del settore dei nanocompositi. Le operazioni dei settori che hanno utilizzato materiali nanocompositi nel packaging, nella produzione e in altre aree sono state inoltre influenzate dalle restrizioni di viaggio messe in atto in tutto il mondo.
[caption id="allegato_16916" align="aligncenter" width="1920"]
Frequently Asked Questions
• What is the worth of Nanocomposites Market?
The Nanocomposites Market is expected to grow at 16.2% CAGR from 2022 to 2029. It is expected to reach above USD 17.77 Billion by 2029 from USD 4.6 Billion in 2020.
• What is the size of the Asia Pacific in Nanocomposites Market?
Asia Pacific held more than 36% of the Nanocomposites Market revenue share in 2021 and will witness expansion in the forecast period.
• What are some of the Nanocomposites Market's driving forces?
One of the industries that has seen a number of modern-era modifications in the past twenty years is packaging. Films, cartons, boxes, and other packaging materials are frequently made with nanocomposite. Due to its high quality, adaptability, flexibility, high tensile strength, and reduced price when compared to other packaging products, the product is widely used in the packaging industry. The market's expansion has been significantly impacted by rising packaging demand from the food and beverage industry. These products have superior thermal, mechanical, biodegradable, and microbial and other contaminating agent resistance qualities. The market will be driven by the use of intelligent and active food packaging technologies. The demand for ready-to-cook, pre-cooked, and other convenience food products has significantly increased as working women become more prevalent throughout the world.
• Which are the top companies to hold the Market share in Nanocomposites Market?
The Market research report covers the analysis of Market players. Key companies profiled in the report include Nanocor Inc., Arkema Inc, Powdermet Inc., RTP Company, Unidym Inc., Nanocyl SA, Gnanomat, BASF, Celanese Corporation, Cabot.
• Which is the largest regional Market for Nanocomposites Market?
The greatest revenue share was accounted for by Asia Pacific. The proliferation of producers in Southeast Asia will contribute to the expansion of the product's demand across a range of end-use sectors. The local market is expected to benefit from the growing use in the pharmaceutical, automotive, food and beverage, electronics and semiconductors, packaging, and other industries and continue its dominance. The use of carbon nanotubes in multiple transistors, sensors, ICs, atomic force microscope probes, and other electrical components, combined with their remarkable properties, will lead to a growth in demand in countries like India, Japan, China, and South Korea. The rapidly expanding electronic manufacturing sector in these countries, which may be related to the rising demand for electronic devices from end-user sectors, will be the region's market's primary driver.
Nanocomposites Market Segment Analysis
Nanocomposite’s market is segmented based on type, product, application and region.
Based on type, a significant portion of the market was made up of polymer matrix. The market for polymer product type will be fueled by favorable government laws for product usage in the packaging, aerospace, and automotive industries. Due to its mechanical strength, gas barrier qualities, flame retardancy, superior thermal conductivity, electrical conductivity, and rheology, the product contributes to the advancement of synthetic plastic materials. Moreover, it is gradually replacing heavy metals used in the aerospace and automobile industries. Due to qualities like fracture toughness, high temperature, corrosion resistance, wear, and high damage tolerance, it is extensively employed in the aerospace and defense industry. They offer improved space conditions and electromagnetic shielding for aircraft.
Based on product, a significant portion of the market was made up of carbon nanotubes. Due to their better heat and thermal conductivity, carbon nanotubes are being used more and more in the production of automotive parts. Over the projected period, segment development is likely to be aided by rising demand for carbon nanotubes in the automotive industry as a multifunctional coating material and in the production of vehicle parts. Due to its ability to lessen biofouling and corrosion resistance, it is also being utilized more and more as a coating material for boat and ship hulls.
Based on application, a significant portion of the market was made up of packaging. Graphene nanoparticles and carbon nanotubes are appealing materials for enhancing the mechanical characteristics, barrier performances, and functional features of biodegradable polymers in packaging applications. The market for packaging is being driven by the quick development of e-commerce services and the food and beverage industry, which in turn is driving the market for nanocomposites.
[caption id="attachment_16928" align="aligncenter" width="1920"]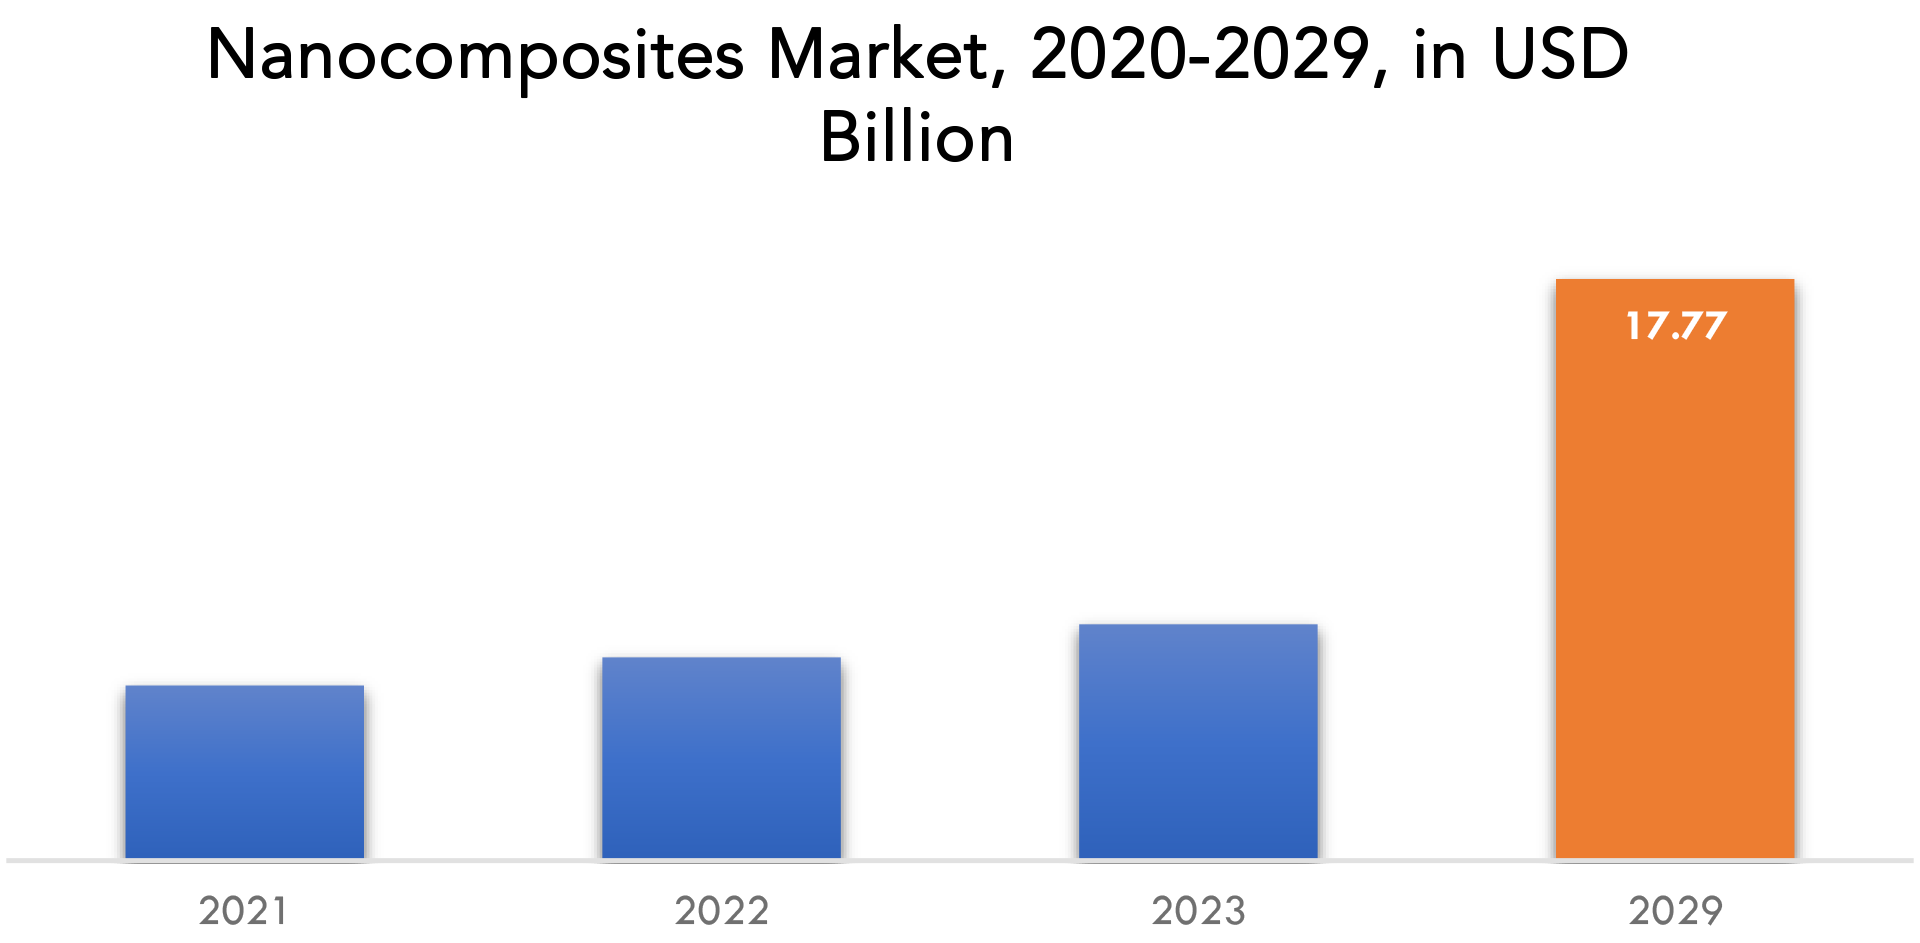
Nanocomposites Market Players
The Market research report covers the analysis of Market players. Key companies profiled in the report include Nanocor Inc., Arkema Inc, Powdermet Inc., RTP Company, Unidym Inc., Nanocyl SA, Gnanomat, BASF, Celanese Corporation, Cabot Recent Developments:- In October 2020, Gnanomat launched two graphene-based nanocomposites namely “Graphene-Manganese Oxide nanocomposite” and “Graphene-Zinc Oxide nanocomposite”. These products are used in pseudocapacitors, electrodes for energy storage devices, catalyst and others
- On November 01, 2022, an American technology and specialty materials company, Celanese, completed the acquisition of Mobility & Materials (M&M) business of DuPont, a US-based multinational chemical company.
Who Should Buy? Or Key stakeholders
- Government and research organizations
- Nanocomposites manufactures
- Potential investors
- Raw material suppliers
- Nationalized laboratories
Nanocomposites Market Regional Analysis
The Nanocomposites Market by region includes North America, Asia-Pacific (APAC), Europe, South America, and Middle East & Africa (MEA).
- North America: includes the US, Canada, Mexico
- Asia Pacific: includes China, Japan, South Korea, India, Australia, ASEAN and Rest of APAC
- Europe: includes UK, Germany, France, Italy, Spain, Russia, and Rest of Europe
- South America: includes Brazil, Argentina and Rest of South America
- Middle East & Africa: includes Turkey, UAE, Saudi Arabia, South Africa, and Rest of MEA
The greatest revenue share in 2021 over 36% was accounted for by Asia Pacific. The fact that there are numerous manufacturers in Southeast Asia will help to fuel the rising demand for the product across a variety of end-use industries. The expanding use in pharmaceutical, automotive, food and beverage, electronics and semiconductors, packaging, and other industries is projected to have a beneficial effect on the local market and maintain its dominance. Due to its amazing qualities, carbon nanotubes are employed in numerous transistors, sensors, ICs, atomic force microscope probes, and other electrical components, which will increase demand in nations like India, Japan, China, and South Korea. The region's market will be driven by the fast growing electronic manufacturing industry in these nations, which may be linked to the increasing demand for electronic devices from end-user industries.
[caption id="attachment_16929" align="aligncenter" width="1920"]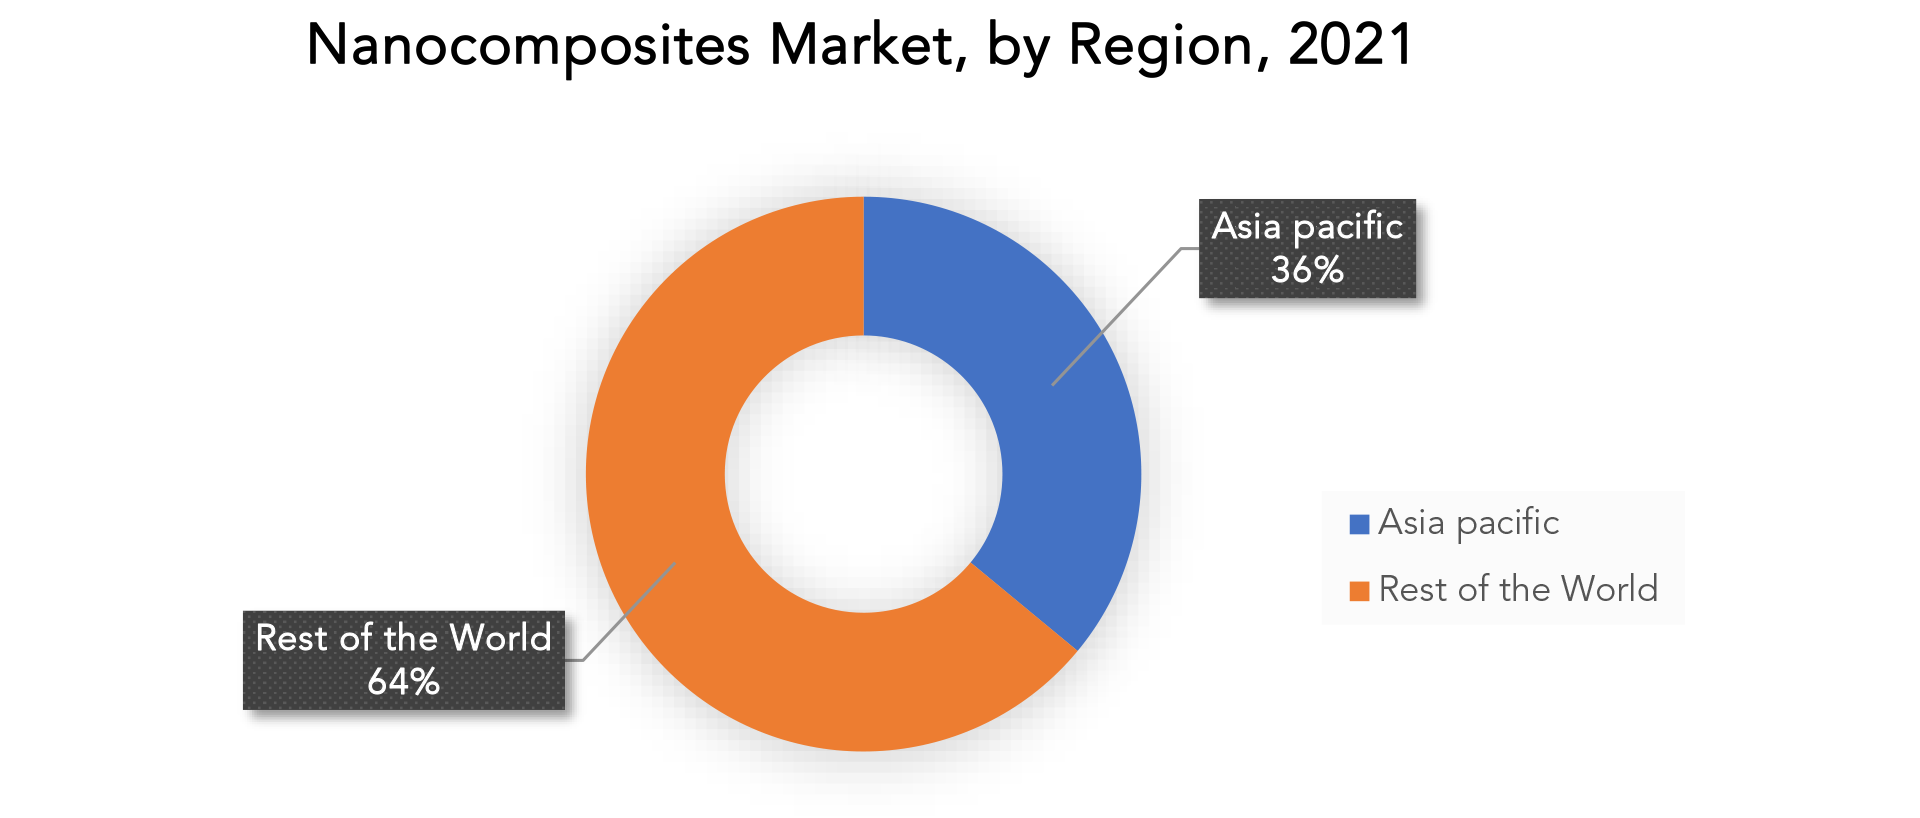
Key Market Segments: Nanocomposites Market
Nanocomposites Market By Type, 2020-2029, (USD Billion), (Kilotons)- Polymer Matrix
- Metral Matrix
- Ceramic Matrix
- Carbon Nanotube
- Nanoclay
- Metal/Metal Oxide
- Packaging
- Automotive
- Electronics Electrical
- North America
- Asia Pacific
- Europe
- South America
- Middle East And Africa
Exactitude Consultancy Services Key Objectives:
- Increasing sales and Market share
- Developing new technology
- Improving profitability
- Entering new markets
- Enhancing brand reputation
Key Question Answered
- What is the expected growth rate of the nanocomposites market over the next 7 years?
- Who are the major players in the nanocomposites market and what is their market share?
- What are the end-user industries driving demand for market and what is their outlook?
- What are the opportunities for growth in emerging markets such as asia-pacific, middle east, and africa?
- How is the economic environment affecting the nanocomposites market, including factors such as interest rates, inflation, and exchange rates?
- What is the expected impact of government policies and regulations on the nanocomposites market?
- What is the current and forecasted size and growth rate of the global nanocomposites market?
- What are the key drivers of growth in the nanocomposites market?
- Who are the major players in the market and what is their market share?
- What are the distribution channels and supply chain dynamics in the nanocomposites market?
- What are the technological advancements and innovations in the nanocomposites market and their impact on product development and growth?
- What are the regulatory considerations and their impact on the market?
- What are the challenges faced by players in the nanocomposites market and how are they addressing these challenges?
- What are the opportunities for growth and expansion in the nanocomposites market?
- What are the products offerings and specifications of leading players in the market?
- INTRODUZIONE
- DEFINIZIONE DI MERCATO
- SEGMENTAZIONE DEL MERCATO
- TEMPI DI RICERCA
- ASSUNZIONI E LIMITAZIONI
- METODOLOGIA DI RICERCA
- ESTRAZIONE DATI
- RICERCA SECONDARIA
- RICERCA PRIMARIA
- PARERI DEGLI ESPERTI IN MATERIA
- CONTROLLI DI QUALITÀ
- RECENSIONE FINALE
- TRIANGOLAZIONE DEI DATI
- APPROCCIO DAL BASSO VERSO L'ALTO
- APPROCCIO TOP-DOWN
- FLUSSO DI RICERCA
- FONTI DEI DATI
- ESTRAZIONE DATI
- SINTESI
- PANORAMICA DEL MERCATO
- GLOBAL NANOCOMPOSITES MARKET OUTLOOK
- MARKET DRIVERS
- MARKET RESTRAINTS
- MARKET OPPORTUNITIES
- IMPACT OF COVID-19 ON NANOCOMPOSITES MARKET
- PORTER’S FIVE FORCES MODEL
- THREAT FROM NEW ENTRANTS
- THREAT FROM SUBSTITUTES
- BARGAINING POWER OF SUPPLIERS
- BARGAINING POWER OF CUSTOMERS
- DEGREE OF COMPETITION
- INDUSTRY VALUE CHAIN ANALYSIS
- GLOBAL NANOCOMPOSITES MARKET OUTLOOK
- GLOBAL NANOCOMPOSITES MARKET BY TYPE, 2020-2029, (USD BILLION), (KILOTONS)
- POLYMER MATRIX
- METAL MATRIX
- CERAMIC MATRIX
- GLOBAL NANOCOMPOSITES MARKET BY PRODUCT, 2020-2029, (USD BILLION), (KILOTONS)
- CARBON NANOTUBE
- NANOCLAY
- METAL/METAL OXIDE
- GLOBAL NANOCOMPOSITES MARKET BY APPLICATION, 2020-2029, (USD BILLION), (KILOTONS)
- PACKAGING
- AUTOMOTIVE
- ELECTRONICS ELECTRICAL
- GLOBAL NANOCOMPOSITES MARKET BY REGION, 2020-2029, (USD BILLION), (KILOTONS)
- NORTH AMERICA
- US
- CANADA
- MEXICO
- SOUTH AMERICA
- BRAZIL
- ARGENTINA
- COLOMBIA
- REST OF SOUTH AMERICA
- EUROPE
- GERMANY
- UK
- FRANCE
- ITALY
- SPAIN
- RUSSIA
- REST OF EUROPE
- ASIA PACIFIC
- INDIA
- CHINA
- JAPAN
- SOUTH KOREA
- AUSTRALIA
- SOUTH-EAST ASIA
- REST OF ASIA PACIFIC
- MIDDLE EAST AND AFRICA
- UAE
- SAUDI ARABIA
- SOUTH AFRICA
- REST OF MIDDLE EAST AND AFRICA
- NORTH AMERICA
- COMPANY PROFILES* (BUSINESS OVERVIEW, COMPANY SNAPSHOT, PRODUCT OFFERED, RECENT DEVELOPMENTS)
- NANOCOR INC.,
- ARKEMA INC
- POWDERMET INC.,
- RTP COMPANY
- UNIDYM INC
- NANOCYL SA
- GNANOMAT
- BASF
- CELANESE CORPORATION
- CABOT *THE COMPANY LIST IS INDICATIVE
LIST OF TABLES
TABLE 1 GLOBAL NANOCOMPOSITES MARKET BY TYPE (USD BILLION) 2020-2029
TABLE 2 GLOBAL NANOCOMPOSITES MARKET BY TYPE (KILOTONS) 2020-2029
TABLE 3 GLOBAL NANOCOMPOSITES MARKET BY PRODUCT (USD BILLION) 2020-2029
TABLE 4 GLOBAL NANOCOMPOSITES MARKET BY PRODUCT (KILOTONS) 2020-2029
TABLE 5 GLOBAL NANOCOMPOSITES MARKET BY APPLICATION (USD BILLION) 2020-2029
TABLE 6 GLOBAL NANOCOMPOSITES MARKET BY APPLICATION (KILOTONS) 2020-2029
TABLE 7 GLOBAL NANOCOMPOSITES MARKET BY REGION (USD BILLION) 2020-2029
TABLE 8 GLOBAL NANOCOMPOSITES MARKET BY REGION (KILOTONS) 2020-2029
TABLE 9 NORTH AMERICA NANOCOMPOSITES MARKET BY COUNTRY (USD BILLION) 2020-2029
TABLE 10 NORTH AMERICA NANOCOMPOSITES MARKET BY COUNTRY (KILOTONS) 2020-2029
TABLE 11 NORTH AMERICA NANOCOMPOSITES MARKET BY TYPE (USD BILLION) 2020-2029
TABLE 12 NORTH AMERICA NANOCOMPOSITES MARKET BY TYPE (KILOTONS) 2020-2029
TABLE 13 NORTH AMERICA NANOCOMPOSITES MARKET BY PRODUCT (USD BILLION) 2020-2029
TABLE 14 NORTH AMERICA NANOCOMPOSITES MARKET BY PRODUCT (KILOTONS) 2020-2029
TABLE 15 NORTH AMERICA NANOCOMPOSITES MARKET BY APPLICATION (USD BILLION) 2020-2029
TABLE 16 NORTH AMERICA NANOCOMPOSITES MARKET BY APPLICATION (KILOTONS) 2020-2029
TABLE 17 US NANOCOMPOSITES MARKET BY TYPE (USD BILLION) 2020-2029
TABLE 18 US NANOCOMPOSITES MARKET BY TYPE (KILOTONS) 2020-2029
TABLE 19 US NANOCOMPOSITES MARKET BY PRODUCT (USD BILLION) 2020-2029
TABLE 20 US NANOCOMPOSITES MARKET BY PRODUCT (KILOTONS) 2020-2029
TABLE 21 US NANOCOMPOSITES MARKET BY APPLICATION (USD BILLION) 2020-2029
TABLE 22 US NANOCOMPOSITES MARKET BY APPLICATION (KILOTONS) 2020-2029
TABLE 23 CANADA NANOCOMPOSITES MARKET BY TYPE (USD BILLION) 2020-2029
TABLE 24 CANADA NANOCOMPOSITES MARKET BY TYPE (KILOTONS) 2020-2029
TABLE 25 CANADA NANOCOMPOSITES MARKET BY PRODUCT (USD BILLION) 2020-2029
TABLE 26 CANADA NANOCOMPOSITES MARKET BY PRODUCT (KILOTONS) 2020-2029
TABLE 27 CANADA NANOCOMPOSITES MARKET BY APPLICATION (USD BILLION) 2020-2029
TABLE 28 CANADA NANOCOMPOSITES MARKET BY APPLICATION (KILOTONS) 2020-2029
TABLE 29 MEXICO NANOCOMPOSITES MARKET BY TYPE (USD BILLION) 2020-2029
TABLE 30 MEXICO NANOCOMPOSITES MARKET BY TYPE (KILOTONS) 2020-2029
TABLE 31 MEXICO NANOCOMPOSITES MARKET BY PRODUCT (USD BILLION) 2020-2029
TABLE 32 MEXICO NANOCOMPOSITES MARKET BY PRODUCT (KILOTONS) 2020-2029
TABLE 33 MEXICO NANOCOMPOSITES MARKET BY APPLICATION (USD BILLION) 2020-2029
TABLE 34 MEXICO NANOCOMPOSITES MARKET BY APPLICATION (KILOTONS) 2020-2029
TABLE 35 SOUTH AMERICA NANOCOMPOSITES MARKET BY COUNTRY (USD BILLION) 2020-2029
TABLE 36 SOUTH AMERICA NANOCOMPOSITES MARKET BY COUNTRY (KILOTONS) 2020-2029
TABLE 37 SOUTH AMERICA NANOCOMPOSITES MARKET BY TYPE (USD BILLION) 2020-2029
TABLE 38 SOUTH AMERICA NANOCOMPOSITES MARKET BY TYPE (KILOTONS) 2020-2029
TABLE 39 SOUTH AMERICA NANOCOMPOSITES MARKET BY PRODUCT (USD BILLION) 2020-2029
TABLE 40 SOUTH AMERICA NANOCOMPOSITES MARKET BY PRODUCT (KILOTONS) 2020-2029
TABLE 41 SOUTH AMERICA NANOCOMPOSITES MARKET BY APPLICATION (USD BILLION) 2020-2029
TABLE 42 SOUTH AMERICA NANOCOMPOSITES MARKET BY APPLICATION (KILOTONS) 2020-2029
TABLE 43 BRAZIL NANOCOMPOSITES MARKET BY TYPE (USD BILLION) 2020-2029
TABLE 44 BRAZIL NANOCOMPOSITES MARKET BY TYPE (KILOTONS) 2020-2029
TABLE 45 BRAZIL NANOCOMPOSITES MARKET BY PRODUCT (USD BILLION) 2020-2029
TABLE 46 BRAZIL NANOCOMPOSITES MARKET BY PRODUCT (KILOTONS) 2020-2029
TABLE 47 BRAZIL NANOCOMPOSITES MARKET BY APPLICATION (USD BILLION) 2020-2029
TABLE 48 BRAZIL NANOCOMPOSITES MARKET BY APPLICATION (KILOTONS) 2020-2029
TABLE 49 ARGENTINA NANOCOMPOSITES MARKET BY TYPE (USD BILLION) 2020-2029
TABLE 50 ARGENTINA NANOCOMPOSITES MARKET BY TYPE (KILOTONS) 2020-2029
TABLE 51 ARGENTINA NANOCOMPOSITES MARKET BY PRODUCT (USD BILLION) 2020-2029
TABLE 52 ARGENTINA NANOCOMPOSITES MARKET BY PRODUCT (KILOTONS) 2020-2029
TABLE 53 ARGENTINA NANOCOMPOSITES MARKET BY APPLICATION (USD BILLION) 2020-2029
TABLE 54 ARGENTINA NANOCOMPOSITES MARKET BY APPLICATION (KILOTONS) 2020-2029
TABLE 55 COLOMBIA NANOCOMPOSITES MARKET BY TYPE (USD BILLION) 2020-2029
TABLE 56 COLOMBIA NANOCOMPOSITES MARKET BY TYPE (KILOTONS) 2020-2029
TABLE 57 COLOMBIA NANOCOMPOSITES MARKET BY PRODUCT (USD BILLION) 2020-2029
TABLE 58 COLOMBIA NANOCOMPOSITES MARKET BY PRODUCT (KILOTONS) 2020-2029
TABLE 59 COLOMBIA NANOCOMPOSITES MARKET BY APPLICATION (USD BILLION) 2020-2029
TABLE 60 COLOMBIA NANOCOMPOSITES MARKET BY APPLICATION (KILOTONS) 2020-2029
TABLE 61 REST OF SOUTH AMERICA NANOCOMPOSITES MARKET BY TYPE (USD BILLION) 2020-2029
TABLE 62 REST OF SOUTH AMERICA NANOCOMPOSITES MARKET BY TYPE (KILOTONS) 2020-2029
TABLE 63 REST OF SOUTH AMERICA NANOCOMPOSITES MARKET BY PRODUCT (USD BILLION) 2020-2029
TABLE 64 REST OF SOUTH AMERICA NANOCOMPOSITES MARKET BY PRODUCT (KILOTONS) 2020-2029
TABLE 65 REST OF SOUTH AMERICA NANOCOMPOSITES MARKET BY APPLICATION (USD BILLION) 2020-2029
TABLE 66 REST OF SOUTH AMERICA NANOCOMPOSITES MARKET BY APPLICATION (KILOTONS) 2020-2029
TABLE 67 ASIA-PACIFIC NANOCOMPOSITES MARKET BY COUNTRY (USD BILLION) 2020-2029
TABLE 68 ASIA-PACIFIC NANOCOMPOSITES MARKET BY COUNTRY (KILOTONS) 2020-2029
TABLE 69 ASIA-PACIFIC NANOCOMPOSITES MARKET BY TYPE (USD BILLION) 2020-2029
TABLE 70 ASIA-PACIFIC NANOCOMPOSITES MARKET BY TYPE (KILOTONS) 2020-2029
TABLE 71 ASIA-PACIFIC NANOCOMPOSITES MARKET BY PRODUCT (USD BILLION) 2020-2029
TABLE 72 ASIA-PACIFIC NANOCOMPOSITES MARKET BY PRODUCT (KILOTONS) 2020-2029
TABLE 73 ASIA-PACIFIC NANOCOMPOSITES MARKET BY APPLICATION (USD BILLION) 2020-2029
TABLE 74 ASIA-PACIFIC NANOCOMPOSITES MARKET BY APPLICATION (KILOTONS) 2020-2029
TABLE 75 INDIA NANOCOMPOSITES MARKET BY TYPE (USD BILLION) 2020-2029
TABLE 76 INDIA NANOCOMPOSITES MARKET BY TYPE (KILOTONS) 2020-2029
TABLE 77 INDIA NANOCOMPOSITES MARKET BY PRODUCT (USD BILLION) 2020-2029
TABLE 78 INDIA NANOCOMPOSITES MARKET BY PRODUCT (KILOTONS) 2020-2029
TABLE 79 INDIA NANOCOMPOSITES MARKET BY APPLICATION (USD BILLION) 2020-2029
TABLE 80 INDIA NANOCOMPOSITES MARKET BY APPLICATION (KILOTONS) 2020-2029
TABLE 81 CHINA NANOCOMPOSITES MARKET BY TYPE (USD BILLION) 2020-2029
TABLE 82 CHINA NANOCOMPOSITES MARKET BY TYPE (KILOTONS) 2020-2029
TABLE 83 CHINA NANOCOMPOSITES MARKET BY PRODUCT (USD BILLION) 2020-2029
TABLE 84 CHINA NANOCOMPOSITES MARKET BY PRODUCT (KILOTONS) 2020-2029
TABLE 85 CHINA NANOCOMPOSITES MARKET BY APPLICATION (USD BILLION) 2020-2029
TABLE 86 CHINA NANOCOMPOSITES MARKET BY APPLICATION (KILOTONS) 2020-2029
TABLE 87 JAPAN NANOCOMPOSITES MARKET BY TYPE (USD BILLION) 2020-2029
TABLE 88 JAPAN NANOCOMPOSITES MARKET BY TYPE (KILOTONS) 2020-2029
TABLE 89 JAPAN NANOCOMPOSITES MARKET BY PRODUCT (USD BILLION) 2020-2029
TABLE 90 JAPAN NANOCOMPOSITES MARKET BY PRODUCT (KILOTONS) 2020-2029
TABLE 91 JAPAN NANOCOMPOSITES MARKET BY APPLICATION (USD BILLION) 2020-2029
TABLE 92 JAPAN NANOCOMPOSITES MARKET BY APPLICATION (KILOTONS) 2020-2029
TABLE 93 SOUTH KOREA NANOCOMPOSITES MARKET BY TYPE (USD BILLION) 2020-2029
TABLE 94 SOUTH KOREA NANOCOMPOSITES MARKET BY TYPE (KILOTONS) 2020-2029
TABLE 95 SOUTH KOREA NANOCOMPOSITES MARKET BY PRODUCT (USD BILLION) 2020-2029
TABLE 96 SOUTH KOREA NANOCOMPOSITES MARKET BY PRODUCT (KILOTONS) 2020-2029
TABLE 97 SOUTH KOREA NANOCOMPOSITES MARKET BY APPLICATION (USD BILLION) 2020-2029
TABLE 98 SOUTH KOREA NANOCOMPOSITES MARKET BY APPLICATION (KILOTONS) 2020-2029
TABLE 99 AUSTRALIA NANOCOMPOSITES MARKET BY TYPE (USD BILLION) 2020-2029
TABLE 100 AUSTRALIA NANOCOMPOSITES MARKET BY TYPE (KILOTONS) 2020-2029
TABLE 101 AUSTRALIA NANOCOMPOSITES MARKET BY PRODUCT (USD BILLION) 2020-2029
TABLE 102 AUSTRALIA NANOCOMPOSITES MARKET BY PRODUCT (KILOTONS) 2020-2029
TABLE 103 AUSTRALIA NANOCOMPOSITES MARKET BY APPLICATION (USD BILLION) 2020-2029
TABLE 104 AUSTRALIA NANOCOMPOSITES MARKET BY APPLICATION (KILOTONS) 2020-2029
TABLE 105 SOUTH-EAST ASIA NANOCOMPOSITES MARKET BY TYPE (USD BILLION) 2020-2029
TABLE 106 SOUTH-EAST ASIA NANOCOMPOSITES MARKET BY TYPE (KILOTONS) 2020-2029
TABLE 107 SOUTH-EAST ASIA NANOCOMPOSITES MARKET BY PRODUCT (USD BILLION) 2020-2029
TABLE 108 SOUTH-EAST ASIA NANOCOMPOSITES MARKET BY PRODUCT (KILOTONS) 2020-2029
TABLE 109 SOUTH-EAST ASIA NANOCOMPOSITES MARKET BY APPLICATION (USD BILLION) 2020-2029
TABLE 110 SOUTH-EAST ASIA NANOCOMPOSITES MARKET BY APPLICATION (KILOTONS) 2020-2029
TABLE 111 REST OF ASIA PACIFIC NANOCOMPOSITES MARKET BY TYPE (USD BILLION) 2020-2029
TABLE 112 REST OF ASIA PACIFIC NANOCOMPOSITES MARKET BY TYPE (KILOTONS) 2020-2029
TABLE 113 REST OF ASIA PACIFIC NANOCOMPOSITES MARKET BY PRODUCT (USD BILLION) 2020-2029
TABLE 114 REST OF ASIA PACIFIC NANOCOMPOSITES MARKET BY PRODUCT (KILOTONS) 2020-2029
TABLE 115 REST OF ASIA PACIFIC NANOCOMPOSITES MARKET BY APPLICATION (USD BILLION) 2020-2029
TABLE 116 REST OF ASIA PACIFIC NANOCOMPOSITES MARKET BY APPLICATION (KILOTONS) 2020-2029
TABLE 117 EUROPE NANOCOMPOSITES MARKET BY COUNTRY (USD BILLION) 2020-2029
TABLE 118 EUROPE NANOCOMPOSITES MARKET BY COUNTRY (KILOTONS) 2020-2029
TABLE 119 ASIA-PACIFIC NANOCOMPOSITES MARKET BY TYPE (USD BILLION) 2020-2029
TABLE 120 ASIA-PACIFIC NANOCOMPOSITES MARKET BY TYPE (KILOTONS) 2020-2029
TABLE 121 ASIA-PACIFIC NANOCOMPOSITES MARKET BY PRODUCT (USD BILLION) 2020-2029
TABLE 122 ASIA-PACIFIC NANOCOMPOSITES MARKET BY PRODUCT (KILOTONS) 2020-2029
TABLE 123 ASIA-PACIFIC NANOCOMPOSITES MARKET BY APPLICATION (USD BILLION) 2020-2029
TABLE 124 ASIA-PACIFIC NANOCOMPOSITES MARKET BY APPLICATION (KILOTONS) 2020-2029
TABLE 125 GERMANY NANOCOMPOSITES MARKET BY TYPE (USD BILLION) 2020-2029
TABLE 126 GERMANY NANOCOMPOSITES MARKET BY TYPE (KILOTONS) 2020-2029
TABLE 127 GERMANY NANOCOMPOSITES MARKET BY PRODUCT (USD BILLION) 2020-2029
TABLE 128 GERMANY NANOCOMPOSITES MARKET BY PRODUCT (KILOTONS) 2020-2029
TABLE 129 GERMANY NANOCOMPOSITES MARKET BY APPLICATION (USD BILLION) 2020-2029
TABLE 130 GERMANY NANOCOMPOSITES MARKET BY APPLICATION (KILOTONS) 2020-2029
TABLE 131 UK NANOCOMPOSITES MARKET BY TYPE (USD BILLION) 2020-2029
TABLE 132 UK NANOCOMPOSITES MARKET BY TYPE (KILOTONS) 2020-2029
TABLE 133 UK NANOCOMPOSITES MARKET BY PRODUCT (USD BILLION) 2020-2029
TABLE 134 UK NANOCOMPOSITES MARKET BY PRODUCT (KILOTONS) 2020-2029
TABLE 135 UK NANOCOMPOSITES MARKET BY APPLICATION (USD BILLION) 2020-2029
TABLE 136 UK NANOCOMPOSITES MARKET BY APPLICATION (KILOTONS) 2020-2029
TABLE 137 FRANCE NANOCOMPOSITES MARKET BY TYPE (USD BILLION) 2020-2029
TABLE 138 FRANCE NANOCOMPOSITES MARKET BY TYPE (KILOTONS) 2020-2029
TABLE 139 FRANCE NANOCOMPOSITES MARKET BY PRODUCT (USD BILLION) 2020-2029
TABLE 140 FRANCE NANOCOMPOSITES MARKET BY PRODUCT (KILOTONS) 2020-2029
TABLE 141 FRANCE NANOCOMPOSITES MARKET BY APPLICATION (USD BILLION) 2020-2029
TABLE 142 FRANCE NANOCOMPOSITES MARKET BY APPLICATION (KILOTONS) 2020-2029
TABLE 143 ITALY NANOCOMPOSITES MARKET BY TYPE (USD BILLION) 2020-2029
TABLE 144 ITALY NANOCOMPOSITES MARKET BY TYPE (KILOTONS) 2020-2029
TABLE 145 ITALY NANOCOMPOSITES MARKET BY PRODUCT (USD BILLION) 2020-2029
TABLE 146 ITALY NANOCOMPOSITES MARKET BY PRODUCT (KILOTONS) 2020-2029
TABLE 147 ITALY NANOCOMPOSITES MARKET BY APPLICATION (USD BILLION) 2020-2029
TABLE 148 ITALY NANOCOMPOSITES MARKET BY APPLICATION (KILOTONS) 2020-2029
TABLE 149 SPAIN NANOCOMPOSITES MARKET BY TYPE (USD BILLION) 2020-2029
TABLE 150 SPAIN NANOCOMPOSITES MARKET BY TYPE (KILOTONS) 2020-2029
TABLE 151 SPAIN NANOCOMPOSITES MARKET BY PRODUCT (USD BILLION) 2020-2029
TABLE 152 SPAIN NANOCOMPOSITES MARKET BY PRODUCT (KILOTONS) 2020-2029
TABLE 153 SPAIN NANOCOMPOSITES MARKET BY APPLICATION (USD BILLION) 2020-2029
TABLE 154 SPAIN NANOCOMPOSITES MARKET BY APPLICATION (KILOTONS) 2020-2029
TABLE 155 RUSSIA NANOCOMPOSITES MARKET BY TYPE (USD BILLION) 2020-2029
TABLE 156 RUSSIA NANOCOMPOSITES MARKET BY TYPE (KILOTONS) 2020-2029
TABLE 157 RUSSIA NANOCOMPOSITES MARKET BY PRODUCT (USD BILLION) 2020-2029
TABLE 158 RUSSIA NANOCOMPOSITES MARKET BY PRODUCT (KILOTONS) 2020-2029
TABLE 159 RUSSIA NANOCOMPOSITES MARKET BY APPLICATION (USD BILLION) 2020-2029
TABLE 160 RUSSIA NANOCOMPOSITES MARKET BY APPLICATION (KILOTONS) 2020-2029
TABLE 161 REST OF EUROPE NANOCOMPOSITES MARKET BY TYPE (USD BILLION) 2020-2029
TABLE 162 REST OF EUROPE NANOCOMPOSITES MARKET BY TYPE (KILOTONS) 2020-2029
TABLE 163 REST OF EUROPE NANOCOMPOSITES MARKET BY PRODUCT (USD BILLION) 2020-2029
TABLE 164 REST OF EUROPE NANOCOMPOSITES MARKET BY PRODUCT (KILOTONS) 2020-2029
TABLE 165 REST OF EUROPE NANOCOMPOSITES MARKET BY APPLICATION (USD BILLION) 2020-2029
TABLE 166 REST OF EUROPE NANOCOMPOSITES MARKET BY APPLICATION (KILOTONS) 2020-2029
TABLE 167 MIDDLE EAST AND AFRICA NANOCOMPOSITES MARKET BY COUNTRY (USD BILLION) 2020-2029
TABLE 168 MIDDLE EAST AND AFRICA NANOCOMPOSITES MARKET BY COUNTRY (KILOTONS) 2020-2029
TABLE 169 MIDDLE EAST AND AFRICA NANOCOMPOSITES MARKET BY TYPE (USD BILLION) 2020-2029
TABLE 170 MIDDLE EAST AND AFRICA NANOCOMPOSITES MARKET BY TYPE (KILOTONS) 2020-2029
TABLE 171 MIDDLE EAST AND AFRICA NANOCOMPOSITES MARKET BY PRODUCT (USD BILLION) 2020-2029
TABLE 172 MIDDLE EAST AND AFRICA NANOCOMPOSITES MARKET BY PRODUCT (KILOTONS) 2020-2029
TABLE 173 MIDDLE EAST AND AFRICA NANOCOMPOSITES MARKET BY APPLICATION (USD BILLION) 2020-2029
TABLE 174 MIDDLE EAST AND AFRICA NANOCOMPOSITES MARKET BY APPLICATION (KILOTONS) 2020-2029
TABLE 175 UAE NANOCOMPOSITES MARKET BY TYPE (USD BILLION) 2020-2029
TABLE 176 UAE NANOCOMPOSITES MARKET BY TYPE (KILOTONS) 2020-2029
TABLE 177 UAE NANOCOMPOSITES MARKET BY PRODUCT (USD BILLION) 2020-2029
TABLE 178 UAE NANOCOMPOSITES MARKET BY PRODUCT (KILOTONS) 2020-2029
TABLE 179 UAE NANOCOMPOSITES MARKET BY APPLICATION (USD BILLION) 2020-2029
TABLE 180 UAE NANOCOMPOSITES MARKET BY APPLICATION (KILOTONS) 2020-2029
TABLE 181 SAUDI ARABIA NANOCOMPOSITES MARKET BY TYPE (USD BILLION) 2020-2029
TABLE 182 SAUDI ARABIA NANOCOMPOSITES MARKET BY TYPE (KILOTONS) 2020-2029
TABLE 183 SAUDI ARABIA NANOCOMPOSITES MARKET BY PRODUCT (USD BILLION) 2020-2029
TABLE 184 SAUDI ARABIA NANOCOMPOSITES MARKET BY PRODUCT (KILOTONS) 2020-2029
TABLE 185 SAUDI ARABIA NANOCOMPOSITES MARKET BY APPLICATION (USD BILLION) 2020-2029
TABLE 186 SAUDI ARABIA NANOCOMPOSITES MARKET BY APPLICATION (KILOTONS) 2020-2029
TABLE 187 SOUTH AFRICA NANOCOMPOSITES MARKET BY TYPE (USD BILLION) 2020-2029
TABLE 188 SOUTH AFRICA NANOCOMPOSITES MARKET BY TYPE (KILOTONS) 2020-2029
TABLE 189 SOUTH AFRICA NANOCOMPOSITES MARKET BY PRODUCT (USD BILLION) 2020-2029
TABLE 190 SOUTH AFRICA NANOCOMPOSITES MARKET BY PRODUCT (KILOTONS) 2020-2029
TABLE 191 SOUTH AFRICA NANOCOMPOSITES MARKET BY APPLICATION (USD BILLION) 2020-2029
TABLE 192 SOUTH AFRICA NANOCOMPOSITES MARKET BY APPLICATION (KILOTONS) 2020-2029
TABLE 193 REST OF MIDDLE EAST AND AFRICA NANOCOMPOSITES MARKET BY TYPE (USD BILLION) 2020-2029
TABLE 194 REST OF MIDDLE EAST AND AFRICA NANOCOMPOSITES MARKET BY TYPE (KILOTONS) 2020-2029
TABLE 195 REST OF MIDDLE EAST AND AFRICA NANOCOMPOSITES MARKET BY PRODUCT (USD BILLION) 2020-2029
TABLE 196 REST OF MIDDLE EAST AND AFRICA NANOCOMPOSITES MARKET BY PRODUCT (KILOTONS) 2020-2029
TABLE 197 REST OF MIDDLE EAST AND AFRICA NANOCOMPOSITES MARKET BY APPLICATION (USD BILLION) 2020-2029
TABLE 198 REST OF MIDDLE EAST AND AFRICA NANOCOMPOSITES MARKET BY APPLICATION (KILOTONS) 2020-2029
LIST OF FIGURES
FIGURE 1 MARKET DYNAMICS
FIGURE 2 MARKET SEGMENTATION
FIGURE 3 REPORT TIMELINES: YEARS CONSIDERED
FIGURE 4 DATA TRIANGULATION
FIGURE 5 BOTTOM-UP APPROACH
FIGURE 6 TOP-DOWN APPROACH
FIGURE 7 RESEARCH FLOW
FIGURE 8 GLOBAL NANOCOMPOSITES MARKET BY TYPE, USD BILLION, 2020-2029
FIGURE 9 GLOBAL NANOCOMPOSITES MARKET BY PRODUCT, USD BILLION, 2020-2029
FIGURE 10 GLOBAL NANOCOMPOSITES MARKET BY APPLICATION, USD BILLION, 2020-2029
FIGURE 11 GLOBAL NANOCOMPOSITES MARKET BY REGION, USD BILLION, 2020-2029
FIGURE 12 PORTER’S FIVE FORCES MODEL
FIGURE 13 GLOBAL NANOCOMPOSITES MARKET BY TYPE, USD BILLION, 2021
FIGURE 14 GLOBAL NANOCOMPOSITES MARKET BY PRODUCT, USD BILLION, 2021
FIGURE 15 GLOBAL NANOCOMPOSITES MARKET BY APPLICATION, USD BILLION, 2021
FIGURE 16 GLOBAL NANOCOMPOSITES MARKET BY REGION, USD BILLION, 2021
FIGURE 17 NORTH AMERICA NANOCOMPOSITES MARKET SNAPSHOT
FIGURE 18 EUROPE NANOCOMPOSITES MARKET SNAPSHOT
FIGURE 19 SOUTH AMERICA NANOCOMPOSITES MARKET SNAPSHOT
FIGURE 20 ASIA PACIFIC NANOCOMPOSITES MARKET SNAPSHOT
FIGURE 21 MIDDLE EAST ASIA AND AFRICA NANOCOMPOSITES MARKET SNAPSHOT
FIGURE 22 MARKET SHARE ANALYSIS
FIGURE 23 NANOCOR INC.: COMPANY SNAPSHOT
FIGURE 24 ARKEMA INC: COMPANY SNAPSHOT
FIGURE 25 POWDERMET INC.: COMPANY SNAPSHOT
FIGURE 26 RTP COMPANY: COMPANY SNAPSHOT
FIGURE 27 UNIDYM INC.: COMPANY SNAPSHOT
FIGURE 28 NANOCYL SA: COMPANY SNAPSHOT
FIGURE 29 GNANOMAT: COMPANY SNAPSHOT
FIGURE 30 BASF: COMPANY SNAPSHOT
FIGURE 31 CELANESE CORPORATION: COMPANY SNAPSHOT
FIGURE 32 CABOT: COMPANY SNAPSHOT
DOWNLOAD FREE SAMPLE REPORT
License Type
SPEAK WITH OUR ANALYST
Want to know more about the report or any specific requirement?
WANT TO CUSTOMIZE THE REPORT?
Our Clients Speak
We asked them to research ‘ Equipment market’ all over the world, and their whole arrangement was helpful to us. thehealthanalytics.com insightful analysis and reports contributed to our current analysis and in creating a future strategy. Besides, the te
Yosuke Mitsui
Senior Associate Construction Equipment Sales & Marketing
We asked them to research ‘Equipment market’ all over the world, and their whole arrangement was helpful to us. thehealthanalytics.com insightful analysis and reports contributed to our current analysis and in creating a future strategy. Besides, the te


