

Base Year Value ()
x.x %
x.x %
CAGR ()
x.x %
x.x %
Forecast Year Value ()
x.x %
x.x %
Historical Data Period
Largest Region
Forecast Period
Mercato della navigazione autonoma per soluzione (sistema di rilevamento, software, unità di elaborazione), piattaforma (aerea, terrestre, spaziale, marina, arma), applicazione (commerciale, militare e governativa) e per regione (Nord America, Europa, Asia Pacifico, Sud America, Medio Oriente e Africa) Tendenze e previsioni globali dal 2022 al 2029
Instant access to hundreds of data points and trends
- Market estimates from 2014-2029
- Competitive analysis, industry segmentation, financial benchmarks
- Incorporates SWOT, Porter's Five Forces and risk management frameworks
- PDF report or online database with Word, Excel and PowerPoint export options
- 100% money back guarantee
Panoramica del mercato della navigazione autonoma:
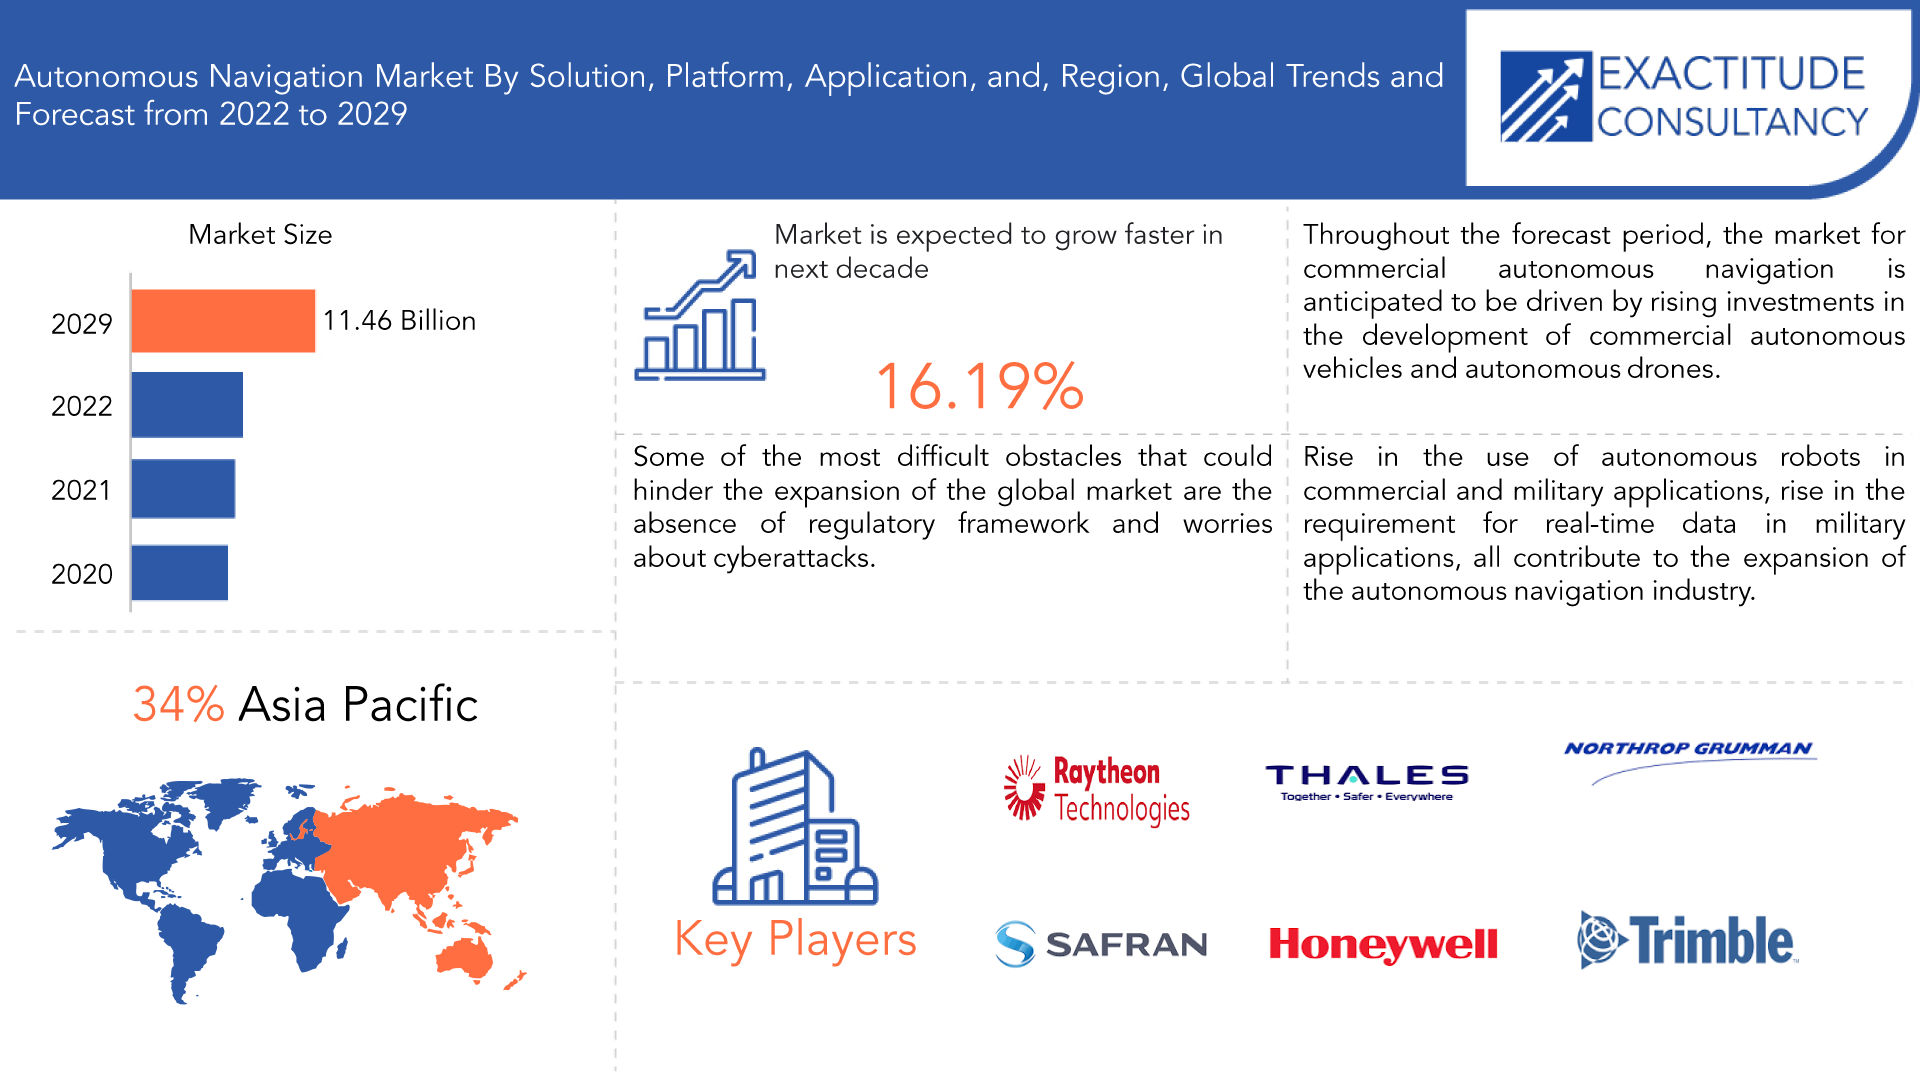
Il mercato globale della navigazione autonoma è stato valutato 4,01 miliardi e si prevede che raggiungerà gli 11,46 miliardi entro il 2029, con un CAGR del 16,19% dal 2022 al 2029.
Un sistema che può pianificare il suo percorso e portarlo a termine senza l'assistenza umana è detto autonomo. Prendere decisioni in base all'ambiente è assistito da una complicata combinazione di sistemi. È installato in una varietà di veicoli, tra cui auto, barche, droni e robot. Per una navigazione precisa e sicura del veicolo, vengono utilizzate tecnologie moderne, tra cui sistemi di navigazione inerziale, sistemi di navigazione satellitare , telecamere , radar , navigazione ultrasonica e acustica , nonché algoritmi di navigazione autonomi.
Grazie al miglioramento della tecnologia e ai significativi investimenti finanziari da parte dei governi di tutto il mondo, l'uso di veicoli senza pilota, come i veicoli aerei senza pilota (UAV), i veicoli terrestri senza pilota (UGV) e altri, nelle applicazioni militari è aumentato. È diventato essenziale aggiornare il sistema di comunicazione e navigazione di un UAV per aumentare l'efficienza e la portata della connessione, il che può essere attribuito all'aumento dell'uso di veicoli senza pilota per operazioni militari. La consapevolezza della situazione è fondamentale quando si utilizza la navigazione autonoma per scopi di sorveglianza del governo militare .
| ATTRIBUTO | DETTAGLI |
| Periodo di studio | 2022-2029 |
| Anno base | 2021 |
| Anno stimato | 2022 |
| Anno previsto | 2022-2029 |
| Periodo storico | 2018-2020 |
| Unità | Valore (miliardi di USD) |
| Segmentazione | Per soluzione, piattaforma, applicazione e regione. |
| Per soluzione |
|
| Per piattaforma |
|
| Per applicazione |
|
| Per regione |
|
Il business dell'e-commerce si è espanso grazie all'accessibilità delle aziende, ai tempi di risposta rapidi e alle funzionalità affidabili. L'aumento della domanda ha reso più facile l'uso di robot per le operazioni logistiche. I servizi logistici sono stati meccanizzati grazie all'impiego rapido, preciso e conveniente dei robot .
[caption id="allegato_17945" align="aligncenter" width="1920"]
Frequently Asked Questions
What is the worth of the global autonomous navigation market?
The global autonomous navigation market was valued at 4.01 billion in 2022 and is projected to reach 11.46 billion by 2029, growing at a CAGR of 16.19% from 2022 to 2029
Which market segments are covered in the report on the autonomous navigation market?
Based on solution, platform, application, and region the autonomous navigation market report's divisions are broken down.
What is the CAGR of the autonomous navigation market?
The global autonomous navigation market registered a CAGR of 16.19% from 2022 to 2029. The industry segment was the highest revenue contributor to the market.
Which are the top companies to hold the market share in the autonomous navigation market?
Key players profiled in the report include Raytheon, Thales, Northrop Grumman, Safran, Honeywell International, Rh Marine, Northrop Grumman, Kongsberg Gruppen, Furuno, Moog Inc., L3 Harris Technologies, General Dynamics, and others.
Which is the largest regional market for the autonomous navigation market?
Throughout the forecast period, the market for autonomous navigation in Asia Pacific is anticipated to grow at the greatest CAGR. The demand for high-tech automobiles and the autonomous navigation market in China, which is the largest in the Asia Pacific area, are both expanding significantly. Given the country's expanding disposable income, China is one of the major markets for high-tech automobiles. The Chinese market, which leans towards tiny and inexpensive passenger vehicles, has attracted investment from almost all major automobile makers.
Autonomous Navigation Market Segment Analysis:
Based on solution, platform, application, and region, the global market for autonomous navigation is divided into these categories.
On the basis of the solution autonomous navigation is divided into Sensing System, Software, and Processing Unit. Two of the most crucial sensors that can give an autonomous system situation awareness and be used for activities like mapping, visual localization, path planning, and obstacle avoidance are LiDAR and cameras. Autonomous vehicles use data analysis and management software to perform a variety of tasks, including smooth movement, health monitoring, and accident avoidance. The system's integrated software is in charge of performing complicated procedures and offering learning capabilities.
On the basis of the platform the airborne platform autonomous navigation is divided into Airborne, Land, Space, Marine, and Weapon. The airborne platform segment is anticipated to experience the highest revenue growth throughout the projection period of all the platform segments. Unmanned aerial vehicles are being used in more military applications, which is a major driver of this market segment's growth. High investment in the creation of autonomous drones is another element promoting the expansion of the airborne market.
[caption id="attachment_17946" align="aligncenter" width="1920"]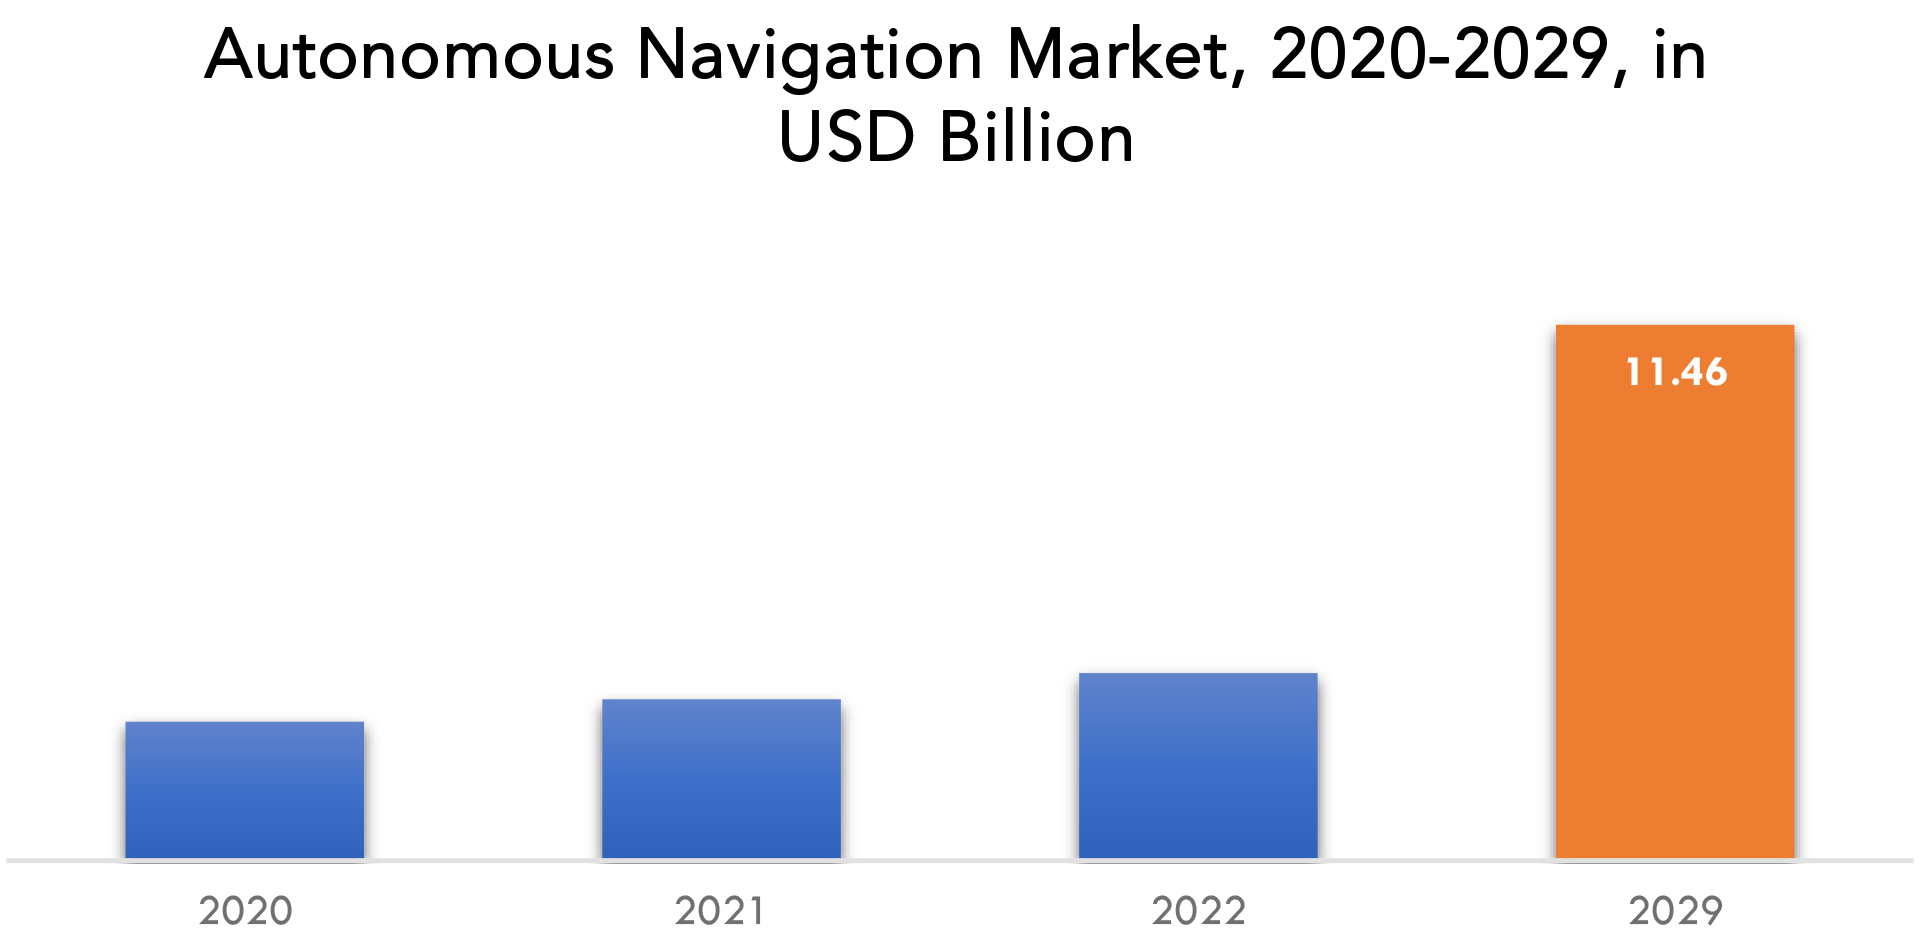
Autonomous Navigation Market Players:
The major players operating in the global autonomous navigation industry include the major market players include Raytheon, Thales, Northrop Grumman, Safran, Honeywell International, Rh Marine, Northrop Grumman, Kongsberg Gruppen, Furuno, Moog Inc., L3 Harris Technologies, General Dynamics, and others.
Industry Development:- 15 February 2023: Safran Seats is awarded the Janus Label of Excellence by the Institute François du Design for Euphony. With Euphony, each individual passenger can enjoy high-quality sound in every position of the seat, enabling them to make the most of the entertainment content provided by the airline free from headsets and cables.
- 5 October 2022: Safran Data Systems was selected to develop a ground network for lunar missions.
Who Should Buy? Or Key Stakeholders
- Manufacturing
- End-Use Industries
- Automotive Industries
- Industrial Vehicles
- Aviation
- Regulatory Authorities
- Research Organizations
- Metal Processing Industries
- Construction
- Others
Autonomous Navigation Market Regional Analysis:
Geographically, the Autonomous Navigation market is segmented into North America, South America, Europe, APAC, and MEA.
- North America: includes the US, Canada, Mexico
- Europe: includes UK, Germany, France, Italy, Spain, Russia, and Rest of Europe
- Asia Pacific: includes China, Japan, South Korea, India, Australia, ASEAN and the Rest of APAC
- South America: includes Brazil, Argentina and Rest of South America
- Middle East & Africa: includes Turkey, UAE, Saudi Arabia, South Africa, and the Rest of MEA
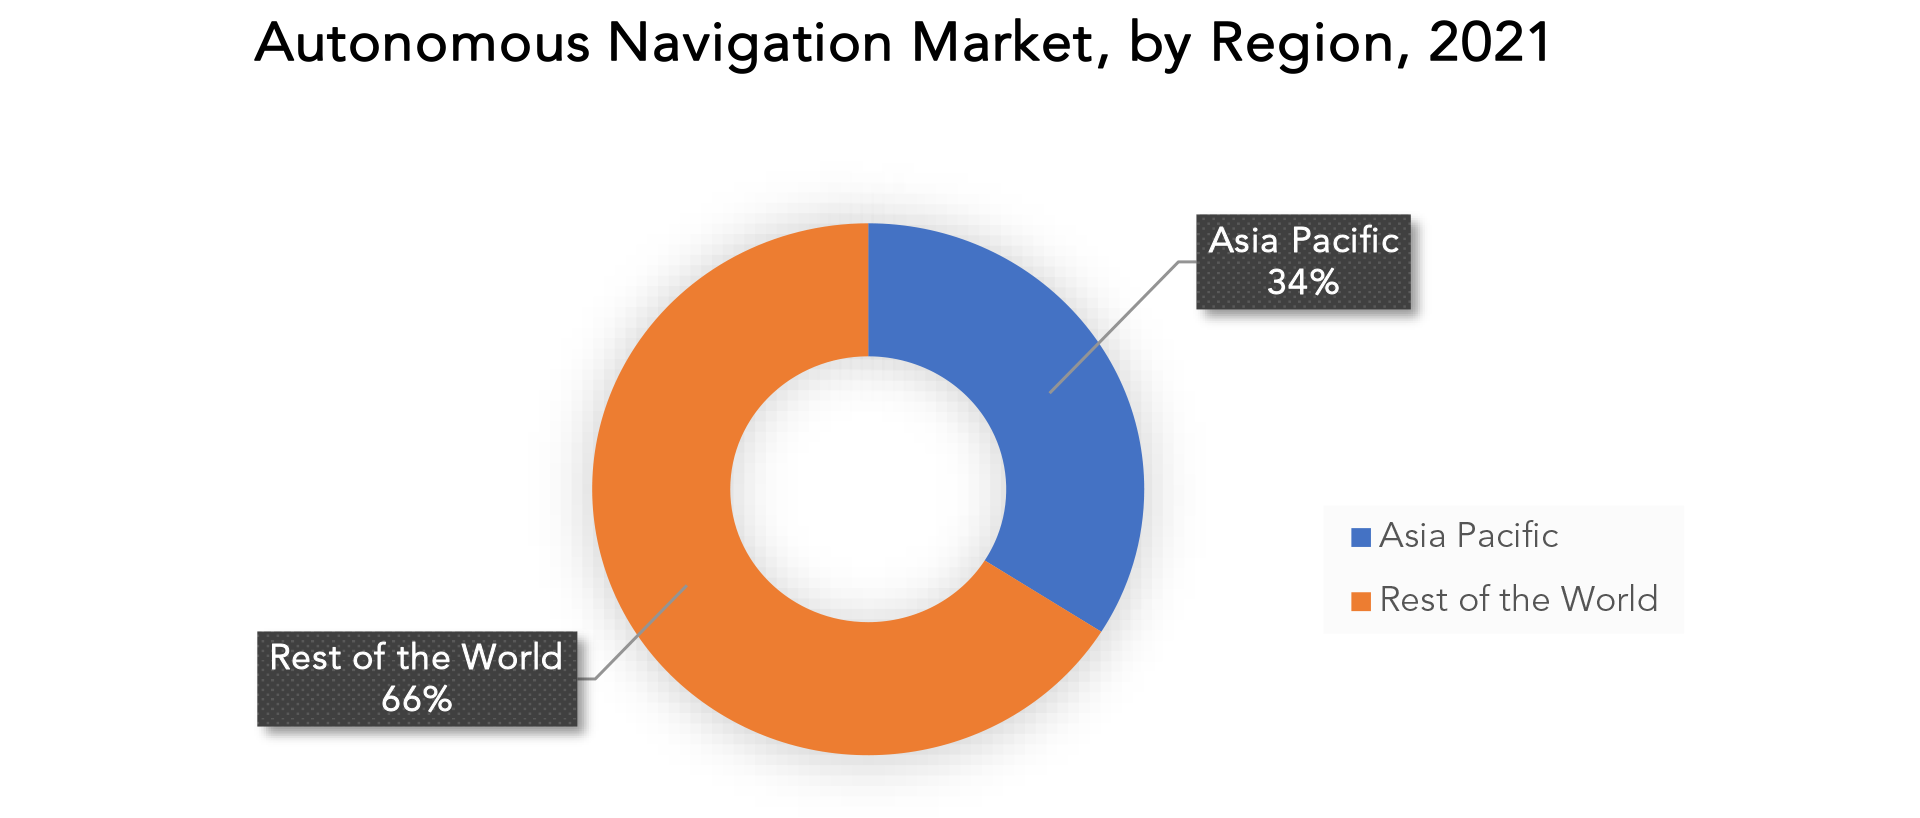
Throughout the forecast period, the market for autonomous navigation in Asia Pacific is anticipated to grow at the greatest CAGR. The demand for high-tech automobiles and the autonomous navigation market in China, which is the largest in the Asia Pacific area, are both expanding significantly. Given the country's expanding disposable income, China is one of the major markets for high-tech automobiles. The Chinese market, which leans towards tiny and inexpensive passenger vehicles, has attracted investment from almost all major automobile Makers. Given that the current automobile penetration is low in comparison to that of industrialized countries, an increase in demand is anticipated. The demand for vehicles has grown as a result of China's rising automotive manufacturing levels.
Key Market Segments: Autonomous Navigation Market
Autonomous Navigation Market By Solution, 2020-2029, (USD Billion)- Sensing System
- Software
- Processing Unit
- Airborne
- Land
- Space
- Marine
- Weapon
- Commercial
- Military & Government
- North America
- Europe
- Asia Pacific
- South America
- Middle East And Africa
Exactitude Consultancy Services Key Objectives:
- Increasing sales and market share
- Developing new technology
- Improving profitability
- Entering new markets
- Enhancing brand reputation
Key Question Answered
- What is the expected growth rate of the autonomous navigation market over the next 7 years?
- Who are the major players in the autonomous navigation market and what is their market share?
- What are the end-user industries driving demand for the market and what is their outlook?
- What are the opportunities for growth in emerging markets such as Asia-Pacific, the Middle East, and Africa?
- How is the economic environment affecting the autonomous navigation market, including factors such as interest rates, inflation, and exchange rates?
- What is the expected impact of government policies and regulations on the autonomous navigation market?
- What is the current and forecasted size and growth rate of the global autonomous navigation market?
- What are the key drivers of growth in the autonomous navigation market?
- Who are the major players in the market and what is their market share?
- What are the distribution channels and supply chain dynamics in the autonomous navigation market?
- What are the technological advancements and innovations in the autonomous navigation market and their impact on product development and growth?
- What are the regulatory considerations and their impact on the market?
- What are the challenges faced by players in the autonomous navigation market and how are they addressing these challenges?
- What are the opportunities for growth and expansion in the autonomous navigation market?
- What are the product offerings and specifications of leading players in the market?
- INTRODUZIONE
- DEFINIZIONE DI MERCATO
- SEGMENTAZIONE DEL MERCATO
- TEMPI DI RICERCA
- ASSUNZIONI E LIMITAZIONI
- METODOLOGIA DI RICERCA
- ESTRAZIONE DATI
- RICERCA SECONDARIA
- RICERCA PRIMARIA
- PARERI DEGLI ESPERTI IN MATERIA
- CONTROLLI DI QUALITÀ
- RECENSIONE FINALE
- TRIANGOLAZIONE DEI DATI
- APPROCCIO DAL BASSO VERSO L'ALTO
- APPROCCIO TOP-DOWN
- FLUSSO DI RICERCA
- FONTI DEI DATI
- ESTRAZIONE DATI
- SINTESI
- PANORAMICA DEL MERCATO
- PROSPETTIVE DEL MERCATO GLOBALE DELLA NAVIGAZIONE AUTONOMA
- FATTORI DI MERCATO
- LIMITAZIONI DI MERCATO
- OPPORTUNITÀ DI MERCATO
- IMPATTO DEL COVID-19 SUL MERCATO DELLA NAVIGAZIONE AUTONOMA
- MODELLO DELLE CINQUE FORZE DI PORTER
- MINACCIA DAI NUOVI ENTRANSI
- MINACCIA DA SOSTITUTI
- POTERE CONTRATTUALE DEI FORNITORI
- POTERE CONTRATTUALE DEI CLIENTI
- GRADO DI COMPETIZIONE
- ANALISI DELLA CATENA DEL VALORE DEL SETTORE
- PROSPETTIVE DEL MERCATO GLOBALE DELLA NAVIGAZIONE AUTONOMA
- MERCATO GLOBALE DELLA NAVIGAZIONE AUTONOMA PER SOLUZIONE, 2020-2029, (MILIARDI DI USD)
- SISTEMA DI RILEVAMENTO
- SOFTWARE
- UNITÀ DI ELABORAZIONE
- MERCATO GLOBALE DELLA NAVIGAZIONE AUTONOMA PER PIATTAFORMA, 2020-2029, (MILIARDI DI USD)
- AEREO
- TERRA
- SPAZIO
- MARINO
- ARMA
- MERCATO GLOBALE DELLA NAVIGAZIONE AUTONOMA PER APPLICAZIONE, 2020-2029, (MILIARDI DI USD)
- COMMERCIALE
- MILITARE E GOVERNO
- MERCATO GLOBALE DELLA NAVIGAZIONE AUTONOMA PER REGIONE, 2020-2029, (MILIARDI DI USD)
- AMERICA DEL NORD
- NOI
- CANADA
- MESSICO
- SUD AMERICA
- BRASILE
- ARGENTINA
- COLOMBIA
- RESTO DEL SUD AMERICA
- EUROPA
- GERMANIA
- Regno Unito
- FRANCIA
- ITALIA
- SPAGNA
- RUSSIA
- RESTO D'EUROPA
- ASIA PACIFICO
- INDIA
- CINA
- GIAPPONE
- COREA DEL SUD
- AUSTRALIA
- ASIA SUD-ORIENTALE
- RESTO DELL'ASIA PACIFICO
- MEDIO ORIENTE E AFRICA
- Emirati Arabi Uniti
- ARABIA SAUDITA
- SUDAFRICA
- RESTO DEL MEDIO ORIENTE E AFRICA
- AMERICA DEL NORD
- PROFILI AZIENDALI* (PANORAMICA AZIENDALE, PANORAMICA AZIENDALE, PRODOTTI OFFERTI, SVILUPPI RECENTI)
- RAIGHEONE
- TALELE
- NORTHROP GRUMMAN
- SAFRAN
- HONEYWELL INTERNAZIONALE
- RH MARINO
- NORTHROP GRUMMAN
- GRUPPI KONGSBERG
- FURUNO
- MOOG INC.
- TECNOLOGIE L3 HARRIS
- DINAMICA GENERALE
*L'ELENCO DELLE AZIENDE È INDICATIVO
ELENCO DELLE TABELLE
TABLE 1 GLOBAL AUTONOMOUS NAVIGATION MARKET BY SOLUTION (USD BILLION) 2020-2029
TABLE 2 GLOBAL AUTONOMOUS NAVIGATION MARKET BY PLATFORM (USD BILLION) 2020-2029
TABLE 3 GLOBAL AUTONOMOUS NAVIGATION MARKET BY APPLICATION (USD BILLION) 2020-2029
TABLE 4 GLOBAL AUTONOMOUS NAVIGATION MARKET BY REGION (USD BILLION) 2020-2029
TABLE 5 NORTH AMERICA AUTONOMOUS NAVIGATION MARKET BY COUNTRY (USD BILLION) 2020-2029
TABLE 6 NORTH AMERICA AUTONOMOUS NAVIGATION MARKET BY SOLUTION (USD BILLION) 2020-2029
TABLE 7 NORTH AMERICA AUTONOMOUS NAVIGATION MARKET BY PLATFORM (USD BILLION) 2020-2029
TABLE 8 NORTH AMERICA AUTONOMOUS NAVIGATION MARKET BY APPLICATION (USD BILLION) 2020-2029
TABLE 9 US AUTONOMOUS NAVIGATION MARKET BY SOLUTION (USD BILLION) 2020-2029
TABLE 10 US AUTONOMOUS NAVIGATION MARKET BY PLATFORM (USD BILLION) 2020-2029
TABLE 11 US AUTONOMOUS NAVIGATION MARKET BY APPLICATION (USD BILLION) 2020-2029
TABLE 12 CANADA AUTONOMOUS NAVIGATION MARKET BY SOLUTION (USD BILLION) 2020-2029
TABLE 13 CANADA AUTONOMOUS NAVIGATION MARKET BY PLATFORM (USD BILLION) 2020-2029
TABLE 14 CANADA AUTONOMOUS NAVIGATION MARKET BY APPLICATION (USD BILLION) 2020-2029
TABLE 15 MEXICO AUTONOMOUS NAVIGATION MARKET BY SOLUTION (USD BILLION) 2020-2029
TABLE 16 MEXICO AUTONOMOUS NAVIGATION MARKET BY PLATFORM (USD BILLION) 2020-2029
TABLE 17 MEXICO AUTONOMOUS NAVIGATION MARKET BY APPLICATION (USD BILLION) 2020-2029
TABLE 18 SOUTH AMERICA AUTONOMOUS NAVIGATION MARKET BY COUNTRY (USD BILLION) 2020-2029
TABLE 19 SOUTH AMERICA AUTONOMOUS NAVIGATION MARKET BY SOLUTION (USD BILLION) 2020-2029
TABLE 20 SOUTH AMERICA AUTONOMOUS NAVIGATION MARKET BY PLATFORM (USD BILLION) 2020-2029
TABLE 21 SOUTH AMERICA AUTONOMOUS NAVIGATION MARKET BY APPLICATION (USD BILLION) 2020-2029
TABLE 22 BRAZIL AUTONOMOUS NAVIGATION MARKET BY SOLUTION (USD BILLION) 2020-2029
TABLE 23 BRAZIL AUTONOMOUS NAVIGATION MARKET BY PLATFORM (USD BILLION) 2020-2029
TABLE 24 BRAZIL AUTONOMOUS NAVIGATION MARKET BY APPLICATION (USD BILLION) 2020-2029
TABLE 25 ARGENTINA AUTONOMOUS NAVIGATION MARKET BY SOLUTION (USD BILLION) 2020-2029
TABLE 26 ARGENTINA AUTONOMOUS NAVIGATION MARKET BY PLATFORM (USD BILLION) 2020-2029
TABLE 27 ARGENTINA AUTONOMOUS NAVIGATION MARKET BY APPLICATION (USD BILLION) 2020-2029
TABLE 28 COLOMBIA AUTONOMOUS NAVIGATION MARKET BY SOLUTION (USD BILLION) 2020-2029
TABLE 29 COLOMBIA AUTONOMOUS NAVIGATION MARKET BY PLATFORM (USD BILLION) 2020-2029
TABLE 30 COLOMBIA AUTONOMOUS NAVIGATION MARKET BY APPLICATION (USD BILLION) 2020-2029
TABLE 31 REST OF SOUTH AMERICA AUTONOMOUS NAVIGATION MARKET BY SOLUTION (USD BILLION) 2020-2029
TABLE 32 REST OF SOUTH AMERICA AUTONOMOUS NAVIGATION MARKET BY PLATFORM (USD BILLION) 2020-2029
TABLE 33 REST OF SOUTH AMERICA AUTONOMOUS NAVIGATION MARKET BY APPLICATION (USD BILLION) 2020-2029
TABLE 34 ASIA-PACIFIC AUTONOMOUS NAVIGATION MARKET BY COUNTRY (USD BILLION) 2020-2029
TABLE 35 ASIA-PACIFIC AUTONOMOUS NAVIGATION MARKET BY SOLUTION (USD BILLION) 2020-2029
TABLE 36 ASIA-PACIFIC AUTONOMOUS NAVIGATION MARKET BY PLATFORM (USD BILLION) 2020-2029
TABLE 37 ASIA-PACIFIC AUTONOMOUS NAVIGATION MARKET BY APPLICATION (USD BILLION) 2020-2029
TABLE 38 INDIA AUTONOMOUS NAVIGATION MARKET BY SOLUTION (USD BILLION) 2020-2029
TABLE 39 INDIA AUTONOMOUS NAVIGATION MARKET BY PLATFORM (USD BILLION) 2020-2029
TABLE 40 INDIA AUTONOMOUS NAVIGATION MARKET BY APPLICATION (USD BILLION) 2020-2029
TABLE 41 CHINA AUTONOMOUS NAVIGATION MARKET BY SOLUTION (USD BILLION) 2020-2029
TABLE 42 CHINA AUTONOMOUS NAVIGATION MARKET BY PLATFORM (USD BILLION) 2020-2029
TABLE 43 CHINA AUTONOMOUS NAVIGATION MARKET BY APPLICATION (USD BILLION) 2020-2029
TABLE 44 JAPAN AUTONOMOUS NAVIGATION MARKET BY SOLUTION (USD BILLION) 2020-2029
TABLE 45 JAPAN AUTONOMOUS NAVIGATION MARKET BY PLATFORM (USD BILLION) 2020-2029
TABLE 46 JAPAN AUTONOMOUS NAVIGATION MARKET BY APPLICATION (USD BILLION) 2020-2029
TABLE 47 SOUTH KOREA AUTONOMOUS NAVIGATION MARKET BY SOLUTION (USD BILLION) 2020-2029
TABLE 48 SOUTH KOREA AUTONOMOUS NAVIGATION MARKET BY PLATFORM (USD BILLION) 2020-2029
TABLE 49 SOUTH KOREA AUTONOMOUS NAVIGATION MARKET BY APPLICATION (USD BILLION) 2020-2029
TABLE 50 AUSTRALIA AUTONOMOUS NAVIGATION MARKET BY SOLUTION (USD BILLION) 2020-2029
TABLE 51 AUSTRALIA AUTONOMOUS NAVIGATION MARKET BY PLATFORM (USD BILLION) 2020-2029
TABLE 52 AUSTRALIA AUTONOMOUS NAVIGATION MARKET BY APPLICATION (USD BILLION) 2020-2029
TABLE 53 SOUTH-EAST ASIA AUTONOMOUS NAVIGATION MARKET BY SOLUTION (USD BILLION) 2020-2029
TABLE 54 SOUTH-EAST ASIA AUTONOMOUS NAVIGATION MARKET BY PLATFORM (USD BILLION) 2020-2029
TABLE 55 SOUTH-EAST ASIA AUTONOMOUS NAVIGATION MARKET BY APPLICATION (USD BILLION) 2020-2029
TABLE 56 REST OF ASIA PACIFIC AUTONOMOUS NAVIGATION MARKET BY SOLUTION (USD BILLION) 2020-2029
TABLE 57 REST OF ASIA PACIFIC AUTONOMOUS NAVIGATION MARKET BY PLATFORM (USD BILLION) 2020-2029
TABLE 58 REST OF ASIA PACIFIC AUTONOMOUS NAVIGATION MARKET BY APPLICATION (USD BILLION) 2020-2029
TABLE 59 EUROPE AUTONOMOUS NAVIGATION MARKET BY COUNTRY (USD BILLION) 2020-2029
TABLE 60 EUROPE AUTONOMOUS NAVIGATION MARKET BY SOLUTION (USD BILLION) 2020-2029
TABLE 61 EUROPE AUTONOMOUS NAVIGATION MARKET BY PLATFORM (USD BILLION) 2020-2029
TABLE 62 EUROPE AUTONOMOUS NAVIGATION MARKET BY APPLICATION (USD BILLION) 2020-2029
TABLE 63 GERMANY AUTONOMOUS NAVIGATION MARKET BY SOLUTION (USD BILLION) 2020-2029
TABLE 64 GERMANY AUTONOMOUS NAVIGATION MARKET BY PLATFORM (USD BILLION) 2020-2029
TABLE 65 GERMANY AUTONOMOUS NAVIGATION MARKET BY APPLICATION (USD BILLION) 2020-2029
TABLE 66 UK AUTONOMOUS NAVIGATION MARKET BY SOLUTION (USD BILLION) 2020-2029
TABLE 67 UK AUTONOMOUS NAVIGATION MARKET BY PLATFORM (USD BILLION) 2020-2029
TABLE 68 UK AUTONOMOUS NAVIGATION MARKET BY APPLICATION (USD BILLION) 2020-2029
TABLE 69 FRANCE AUTONOMOUS NAVIGATION MARKET BY SOLUTION (USD BILLION) 2020-2029
TABLE 70 FRANCE AUTONOMOUS NAVIGATION MARKET BY PLATFORM (USD BILLION) 2020-2029
TABLE 71 FRANCE AUTONOMOUS NAVIGATION MARKET BY APPLICATION (USD BILLION) 2020-2029
TABLE 72 ITALY AUTONOMOUS NAVIGATION MARKET BY SOLUTION (USD BILLION) 2020-2029
TABLE 73 ITALY AUTONOMOUS NAVIGATION MARKET BY PLATFORM (USD BILLION) 2020-2029
TABLE 74 ITALY AUTONOMOUS NAVIGATION MARKET BY APPLICATION (USD BILLION) 2020-2029
TABLE 75 SPAIN AUTONOMOUS NAVIGATION MARKET BY SOLUTION (USD BILLION) 2020-2029
TABLE 76 SPAIN AUTONOMOUS NAVIGATION MARKET BY PLATFORM (USD BILLION) 2020-2029
TABLE 77 SPAIN AUTONOMOUS NAVIGATION MARKET BY APPLICATION (USD BILLION) 2020-2029
TABLE 78 RUSSIA AUTONOMOUS NAVIGATION MARKET BY SOLUTION (USD BILLION) 2020-2029
TABLE 79 RUSSIA AUTONOMOUS NAVIGATION MARKET BY PLATFORM (USD BILLION) 2020-2029
TABLE 80 RUSSIA AUTONOMOUS NAVIGATION MARKET BY APPLICATION (USD BILLION) 2020-2029 TABLE 81 REST OF EUROPE AUTONOMOUS NAVIGATION MARKET BY SOLUTION (USD BILLION) 2020-2029
TABLE 82 REST OF EUROPE AUTONOMOUS NAVIGATION MARKET BY PLATFORM (USD BILLION) 2020-2029
TABLE 83 REST OF EUROPE AUTONOMOUS NAVIGATION MARKET BY APPLICATION (USD BILLION) 2020-2029
TABLE 84 MIDDLE EAST AND AFRICA AUTONOMOUS NAVIGATION MARKET BY COUNTRY (USD BILLION) 2020-2029
TABLE 85 MIDDLE EAST AND AFRICA AUTONOMOUS NAVIGATION MARKET BY SOLUTION (USD BILLION) 2020-2029
TABLE 86 MIDDLE EAST AND AFRICA AUTONOMOUS NAVIGATION MARKET BY PLATFORM (USD BILLION) 2020-2029
TABLE 87 MIDDLE EAST AND AFRICA AUTONOMOUS NAVIGATION MARKET BY APPLICATION (USD BILLION) 2020-2029
TABLE 88 UAE AUTONOMOUS NAVIGATION MARKET BY SOLUTION (USD BILLION) 2020-2029
TABLE 89 UAE AUTONOMOUS NAVIGATION MARKET BY PLATFORM (USD BILLION) 2020-2029
TABLE 90 UAE AUTONOMOUS NAVIGATION MARKET BY APPLICATION (USD BILLION) 2020-2029
TABLE 91 SAUDI ARABIA AUTONOMOUS NAVIGATION MARKET BY SOLUTION (USD BILLION) 2020-2029
TABLE 92 SAUDI ARABIA AUTONOMOUS NAVIGATION MARKET BY PLATFORM (USD BILLION) 2020-2029
TABLE 93 SAUDI ARABIA AUTONOMOUS NAVIGATION MARKET BY APPLICATION (USD BILLION) 2020-2029
TABLE 94 SOUTH AFRICA AUTONOMOUS NAVIGATION MARKET BY SOLUTION (USD BILLION) 2020-2029
TABLE 95 SOUTH AFRICA AUTONOMOUS NAVIGATION MARKET BY PLATFORM (USD BILLION) 2020-2029
TABLE 96 SOUTH AFRICA AUTONOMOUS NAVIGATION MARKET BY APPLICATION (USD BILLION) 2020-2029
TABLE 97 REST OF MIDDLE EAST AND AFRICA AUTONOMOUS NAVIGATION MARKET BY SOLUTION (USD BILLION) 2020-2029
TABLE 98 REST OF MIDDLE EAST AND AFRICA AUTONOMOUS NAVIGATION MARKET BY PLATFORM (USD BILLION) 2020-2029
TABLE 99 REST OF MIDDLE EAST AND AFRICA AUTONOMOUS NAVIGATION MARKET BY APPLICATION (USD BILLION) 2020-2029
LIST OF FIGURES
FIGURE 1 MARKET DYNAMICS
FIGURE 2 MARKET SEGMENTATION
FIGURE 3 REPORT TIMELINES: YEARS CONSIDERED
FIGURE 4 DATA TRIANGULATION
FIGURE 5 BOTTOM-UP APPROACH
FIGURE 6 TOP-DOWN APPROACH
FIGURE 7 RESEARCH FLOW
FIGURE 8 GLOBAL AUTONOMOUS NAVIGATION MARKET BY SOLUTION, USD BILLION, 2020-2029
FIGURE 9 GLOBAL AUTONOMOUS NAVIGATION MARKET BY PLATFORM, USD BILLION, 2020-2029
FIGURE 10 GLOBAL AUTONOMOUS NAVIGATION MARKET BY APPLICATION, USD BILLION, 2020-2029
FIGURE 11 GLOBAL AUTONOMOUS NAVIGATION MARKET BY REGION, USD BILLION, 2020-2029
FIGURE 12 PORTER’S FIVE FORCES MODEL
FIGURE 13 GLOBAL AUTONOMOUS NAVIGATION MARKET BY SOLUTION, USD BILLION, 2021
FIGURE 14 GLOBAL AUTONOMOUS NAVIGATION MARKET BY PLATFORM, USD BILLION, 2021
FIGURE 15 GLOBAL AUTONOMOUS NAVIGATION MARKET BY APPLICATION, USD BILLION, 2021
FIGURE 16 GLOBAL AUTONOMOUS NAVIGATION MARKET BY REGION 2021 USD BILLION
FIGURE 17 MARKET SHARE ANALYSIS
FIGURE 18 RAYTHEON: COMPANY SNAPSHOT
FIGURE 19 THALES: COMPANY SNAPSHOT
FIGURE 20 NORTHROP GRUMMAN: COMPANY SNAPSHOT
FIGURE 21 SAFRAN: COMPANY SNAPSHOT
FIGURE 22 HONEYWELL INTERNATIONAL: COMPANY SNAPSHOT
FIGURE 23 RH MARINE: COMPANY SNAPSHOT
FIGURE 24 NORTHROP GRUMMAN: COMPANY SNAPSHOT
FIGURE 25 KONGSBERG GRUPPEN: COMPANY SNAPSHOT
FIGURE 26 FURUNO: COMPANY SNAPSHOT
FIGURE 27 MOOG INC.: COMPANY SNAPSHOT
FIGURE 28 L3 HARRIS TECHNOLOGIES: COMPANY SNAPSHOT
FIGURE 29 GENERAL DYNAMICS: COMPANY SNAPSHOT
DOWNLOAD FREE SAMPLE REPORT
License Type
SPEAK WITH OUR ANALYST
Want to know more about the report or any specific requirement?
WANT TO CUSTOMIZE THE REPORT?
Our Clients Speak
We asked them to research ‘ Equipment market’ all over the world, and their whole arrangement was helpful to us. thehealthanalytics.com insightful analysis and reports contributed to our current analysis and in creating a future strategy. Besides, the te
Yosuke Mitsui
Senior Associate Construction Equipment Sales & Marketing
We asked them to research ‘Equipment market’ all over the world, and their whole arrangement was helpful to us. thehealthanalytics.com insightful analysis and reports contributed to our current analysis and in creating a future strategy. Besides, the te


