

Base Year Value ()
x.x %
x.x %
CAGR ()
x.x %
x.x %
Forecast Year Value ()
x.x %
x.x %
Historical Data Period
Largest Region
Forecast Period
Mercato globale dell'olio base per tipo (gruppo I, gruppo II, gruppo III, gruppo IV e altri), applicazione (olio per autoveicoli, olio industriale, olio idraulico, grasso, fluido per lavorazione dei metalli) e settore di utilizzo finale (cibo e bevande, agricoltura, sanità, automotive, elettrico ed elettronico) e regione, tendenze globali e previsioni dal 2022 al 2029
Instant access to hundreds of data points and trends
- Market estimates from 2014-2029
- Competitive analysis, industry segmentation, financial benchmarks
- Incorporates SWOT, Porter's Five Forces and risk management frameworks
- PDF report or online database with Word, Excel and PowerPoint export options
- 100% money back guarantee
Panoramica del mercato degli oli base
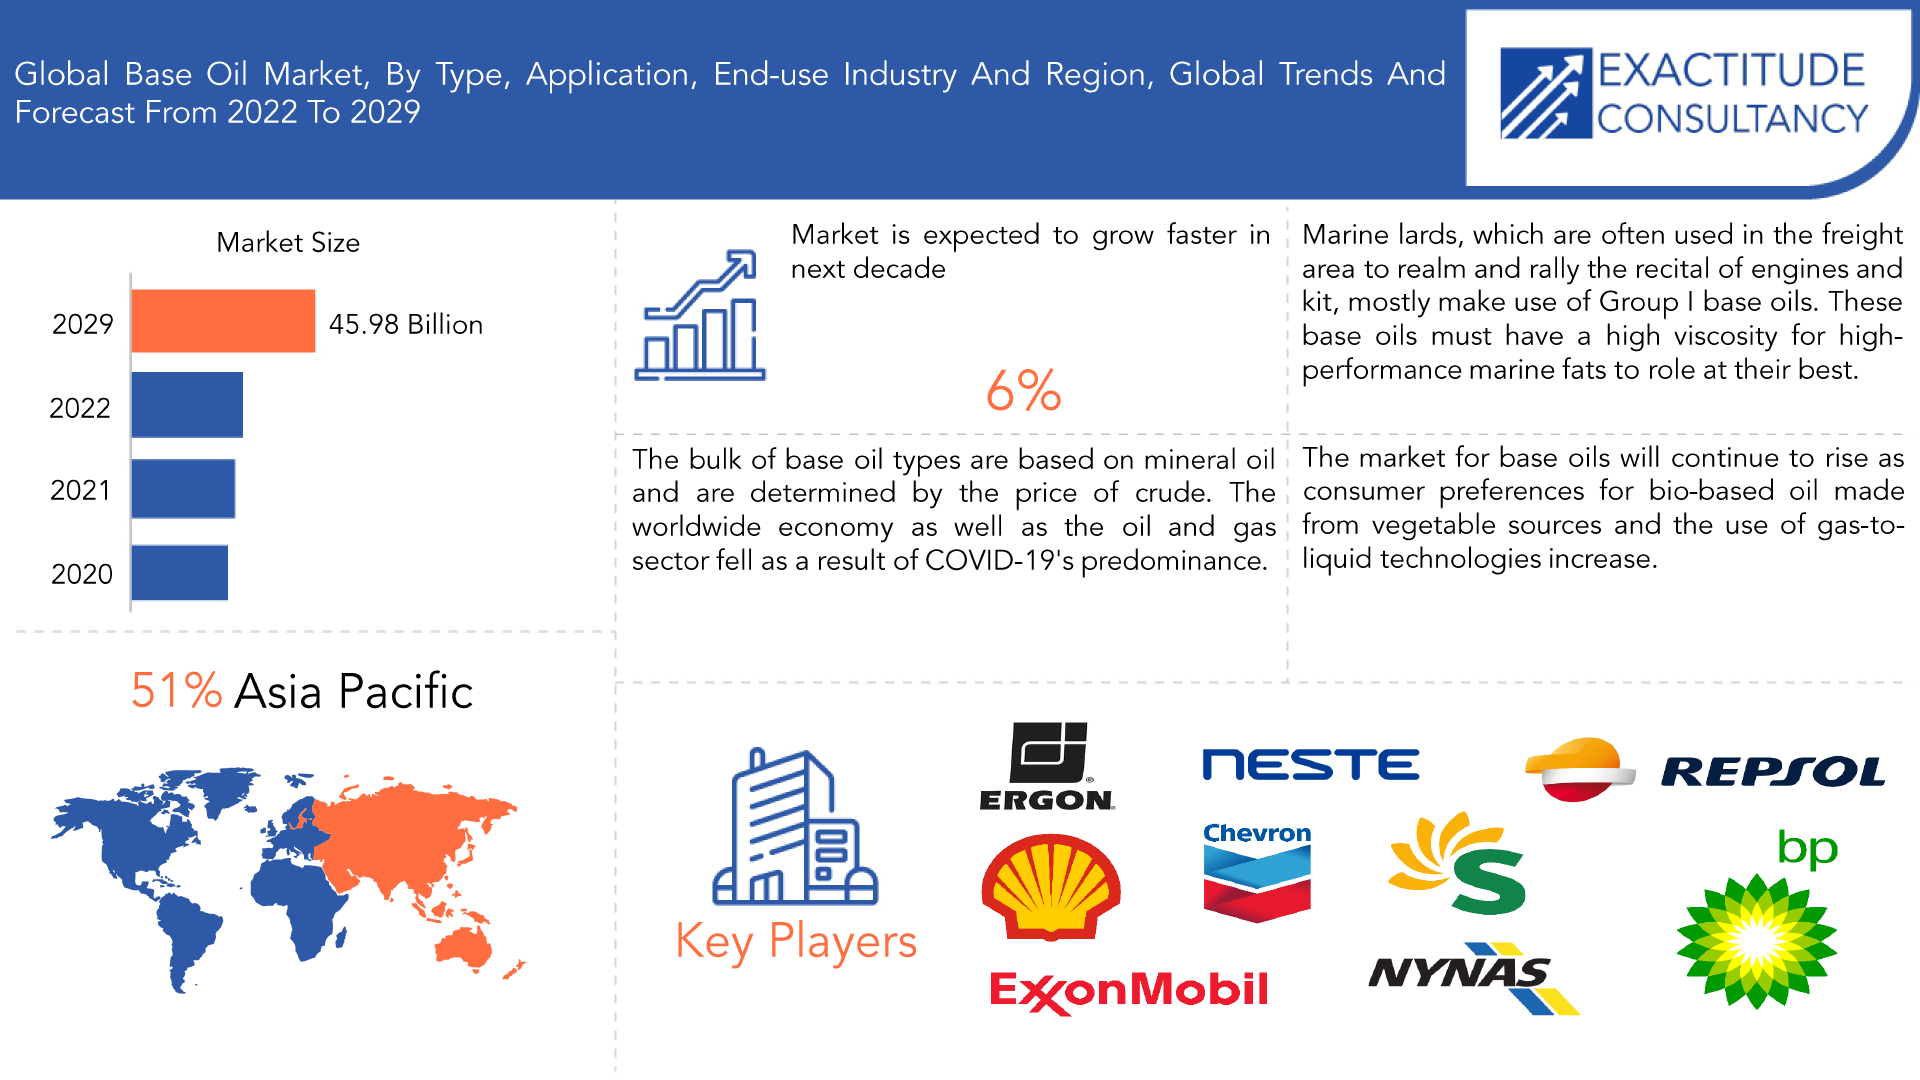
Si prevede che il mercato globale degli oli base crescerà al 6% di CAGR dal 2022 al 2029. Si prevede che raggiungerà oltre 45,98 miliardi di USD entro il 2029 dai 31,39 miliardi di USD del 2022.
L'aumento dell'olio motore utilizzato in settori quali metallurgia, automotive, chimica, macchinari pesanti e produzione di energia è ritenuto responsabile dell'impennata. A causa dell'esistenza di diverse aziende molto inventive, il mercato è estremamente frammentato. La concorrenza è feroce poiché i partecipanti lavorano per mantenere la propria clientela e ottenere un vantaggio competitivo l'uno sull'altro. Le aziende stanno implementando tattiche aziendali cooperative per aumentare la produzione, offrire ai consumatori beni apprezzati e ampliare la propria portata geografica.
L'olio base è ampiamente utilizzato in un'ampia gamma di settori e svolge un ruolo cruciale nella formulazione di oli lubrificanti su scala mondiale. I lubrificanti marini , che sono frequentemente utilizzati nel settore delle spedizioni per preservare e migliorare le prestazioni di motori e attrezzature, utilizzano principalmente oli base del Gruppo I. Questi oli base devono avere un'elevata viscosità affinché i lubrificanti marini ad alte prestazioni funzionino al meglio.
Al giorno d'oggi, uno dei principali contributori globali agli oli base è l'industria automobilistica. Sebbene la tendenza verso le auto elettriche abbia rallentato l'aumento di alcuni lubrificanti dopo le vendite, si prevede che la domanda di lubrificanti nella produzione di veicoli continuerà. I produttori di lubrificanti si impegnano in innovazioni di prodotto, in particolare per il settore automobilistico, poiché i consumatori cercano beni standard e personalizzati per soddisfare esigenze specifiche. Durante il periodo di proiezione, si prevede che la domanda di oli base aumenterà a causa del crescente utilizzo da parte dei produttori di lubrificanti.
Il cambiamento delle preferenze dei consumatori nel contesto di una prevista crisi economica, i cambiamenti nelle normative industriali per riflettere le crescenti preoccupazioni ambientali, le oscillazioni significative nei prezzi delle materie prime causate dalle attuali tensioni geopolitiche e le previste turbolenze economiche sono considerate sfide chiave che gli operatori del settore degli oli base dovranno affrontare nel breve e medio termine.
| ATTRIBUTO | DETTAGLI |
| Periodo di studio | 2022-2029 |
| Anno base | 2021 |
| Anno stimato | 2022 |
| Anno previsto | 2022-2029 |
| Periodo storico | 2018-2022 |
| Unità | Valore (miliardi di USD), (chilotoni) |
| Segmentazione | Per tipo, applicazione, settore dell'utente finale e regione. |
| Per tipo |
|
| Per applicazione |
|
| Per settore dell'utente finale |
|
| Per regione |
|
Gli operatori del mercato dell'olio base concentreranno le loro spese sull'acquisizione di tecnologie innovative, sull'ottenimento di materie prime, su un'efficace gestione degli approvvigionamenti e delle scorte, sul miglioramento dei portafogli di prodotti e sull'utilizzo di competenze per sostenere la crescita in tempi economici difficili. I produttori di olio base e gli attori correlati si stanno concentrando su strategie specifiche per paese a causa delle documentate differenze significative nei problemi economici e sociali affrontati da vari mercati e nazioni.
La necessità per i partecipanti al business dell'olio base di essere più attenti e lungimiranti è pressante a causa delle preoccupazioni per la crisi economica globale, l'effetto del conflitto ucraino, i lockdown in Cina con i casi di COVID in ripresa e i rischi di stagflazione che prevedono varie situazioni di mercato. Le aziende sono costrette ad adattare la propria strategia a causa dei cambiamenti significativi apportati dall'epidemia di COVID-19 nella filiera di fornitura dell'olio base e dal crescente movimento per un ambiente più pulito e sostenibile.
[caption id="allegato_18019" align="aligncenter" width="1920"]
Frequently Asked Questions
What is the worth of the global base oil market?
The global base oil market is expected to grow at 6 % CAGR from 2022 to 2029. It is expected to reach above USD 45.98 billion by 2029 from USD 31.39 billion in 2022.
What are some of the market's driving forces?
The increase in engine oil used in sectors including metallurgy, automotive, chemicals, heavy equipment, and power generation is blamed for the surge. Due to the existence of several very inventive firms, the market is extremely fragmented. Competition is fierce as participants work to keep their clientele to get a competitive advantage over one another. Businesses are implementing cooperative business tactics to boost output, offer consumers well-regarded goods, and broaden their geographical reach.
Which are the top companies to hold the market share in the base oil market?
Base Oil is widely used across a wide range of sectors and plays a crucial role in the formulation of lubricating oils on a worldwide scale. Marine lubricants, which are frequently used in the shipping sector to preserve and improve the performance of engines and equipment, primarily make use of Group I base oils. These base oils must have a high viscosity for high-performance marine lubricants to function at their best.
What is the leading Application of the base oil mark?
Due to the increasing demand for engine oil from industries such as automotive, power, heavy equipment, metallurgy, chemicals, and others, the engine oil sector leads the market for base oil. Internal combustion engines are frequently lubricated using engine oils, which are typically composed of 75–90% basic oils and 10–25% additives. They are often used to protect the engine internals from corrosion, reduce wear, and ensure smooth operation. To improve heat transmission and lessen stress during component contact, they produce a thin coating between the moving parts.
Which is the largest regional market for the base oil market?
The Market’s largest share is in the Asia Pacific region.
Base Oil Market Segmentation
Basic oils are divided into five categories, or Group 1 through Group 4 and others. The first three groupings come from facilities that refine petroleum downstream. Group 4 base oils are polyalphaolefin-based synthetic oils. The base oil market is divided into three categories: type, application, and region. Group I, Group II, Group III, Group IV, and other categories are used to segment the market. Engine oils, transmission and gear oils, metalworking fluids, hydraulic fluids, greases, and other applications make up the market's application-based segments. The market size and predictions for base oil in 15 countries across significant regions are also included in the paper. The market size and forecasting for each segment have been done using volume.
Due to the increasing demand for engine oil from industries such as automotive, power, heavy equipment, metallurgy, chemicals, and others, the engine oil sector leads the market for base oil. Internal combustion engines are frequently lubricated using engine oils, which are typically composed of 75–90% basic oils and 10–25% additives. They are often used to protect the engine internals from corrosion, reduce wear, and ensure smooth operation. To improve heat transmission and lessen stress during component contact, they produce a thin coating between the moving parts.
In 2021, the group I product category dominated the market and accounted for 42.0% of total sales. Due to their accessibility, ease of processing, low volatility, high viscosity index, and lubrication properties, lubricants are becoming more and more popular in the automotive, marine, and rail industries. More than 0.03% sulfur, less than 90% saturates, and viscosities between 80 and 120 are all considered to be characteristics of Group I goods. This category is distinguished by its lack of aromatic compounds and paraffinic composition. The temperature range is 32 to 150 degrees Fahrenheit. Group I is the least refined and has a variety of irregular hydrocarbon chains when compared to the other groups.
[caption id="attachment_18020" align="aligncenter" width="1920"]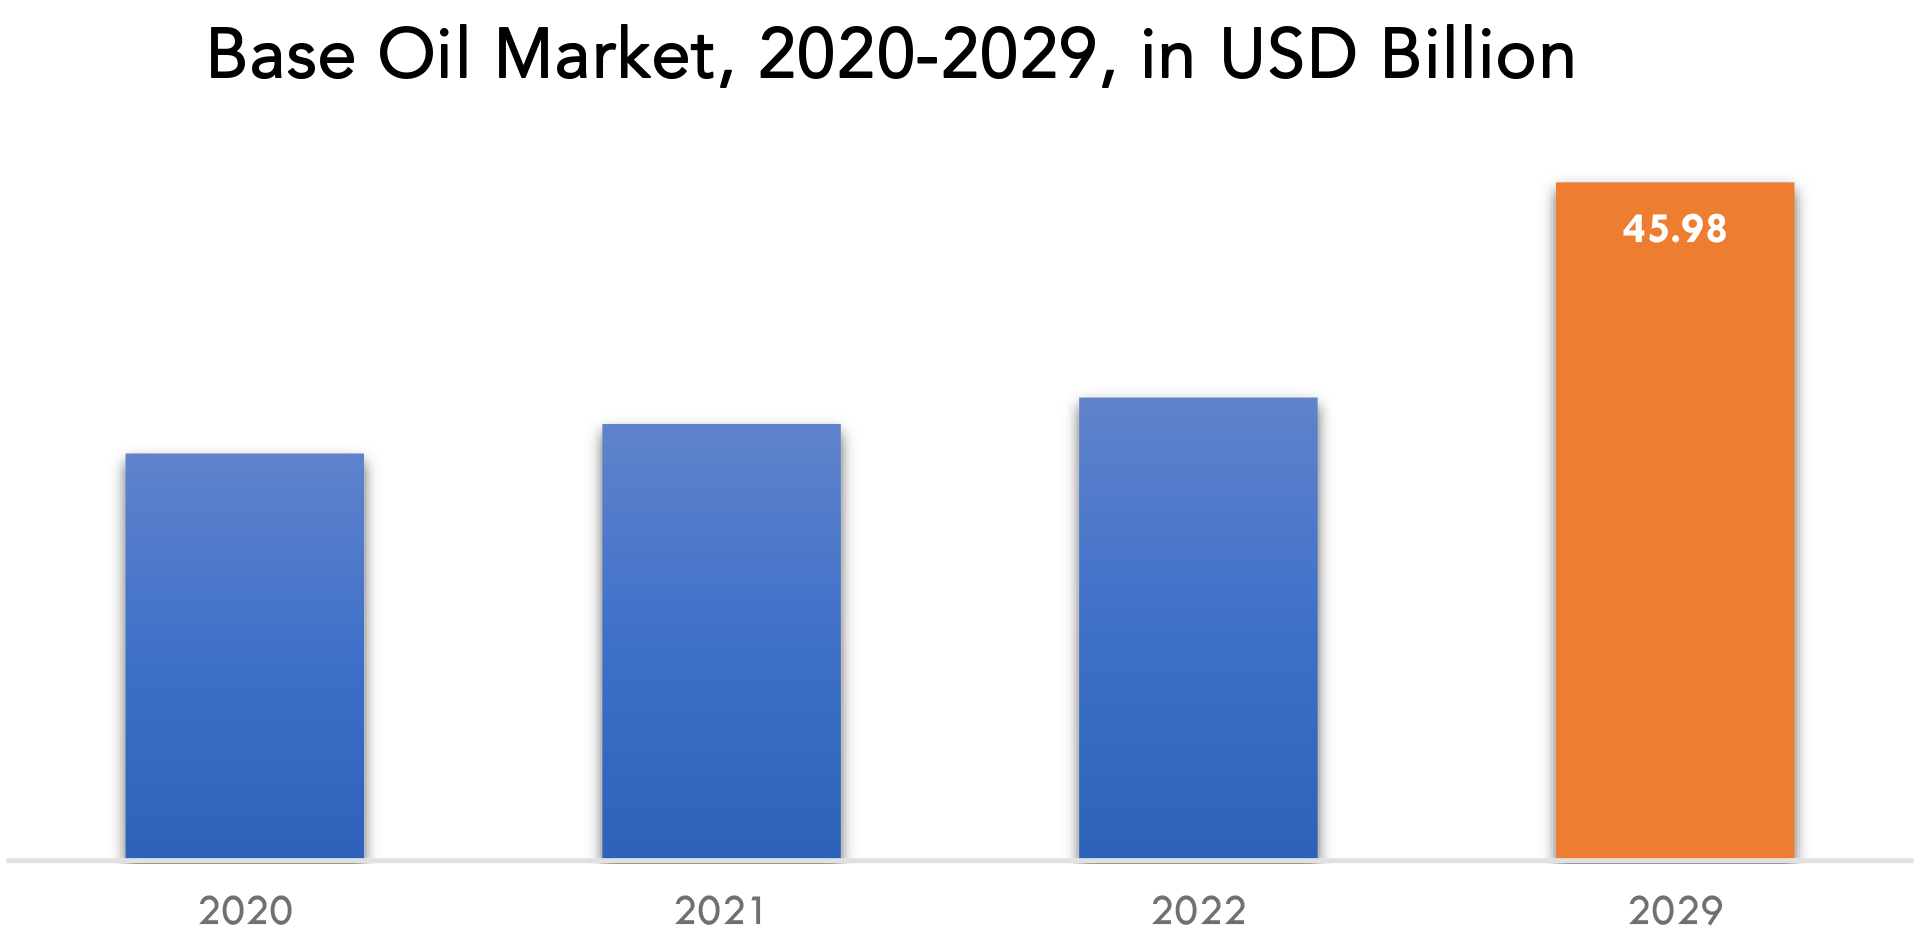
Base Oil Market Players
Chevron Corporation, Exxon Mobil Corporation, Royal Dutch Shell PLC, Ergon Inc., Neste Oyj, Nynas AB, S-OIL CORPORATION, Sepahan Oil, Repsol S.A., Sinopec Limited, BP PLC, Evonik Industries AG, H&R Group, Saudi Aramco, and SK Lubricants Co. Ltd. are significant market participants in the base oil.
For corporate expansion, these key leaders are implementing strategic formulations such as new product development and commercialization, commercial expansion, and distribution agreements. Moreover, these participants are substantially spending on product development, which is fueling revenue generation.
Industry Development:-
In March 2024, Chevron began the U.S. commercial production of NEXBASE 3043, a Group III base oil, at its Richmond, California plant. This product is characterized by a high viscosity index and low volatility, making it suitable for formulating high-quality engine oils and other lubricants. The Richmond facility is now the third plant to produce NEXBASE 3043, complementing existing production in Europe and Asia, and enhancing Chevron's capacity to meet the growing demand for premium base oils in North America.
-
February 2023 - Russian base oil shipments in 2022 were behind 2021 levels for every month of the year and are unlikely to rebound this year, trading company DYM Resources said at the Argus Global Base Oils Conference today.
-
March 2023 - Reuters, March 12, 2019 - Amin Nasser, the chief executive of Aramco, stated on Sunday that he was cautiously optimistic and believed the oil market will stay tightly balanced in the short to medium term.
Who Should Buy? Or Key Stakeholders
- Investors
- Food and Beverage industry
- Medical Technology Companies
- Healthcare and personal care firms
- Research Organizations
- Regulatory Authorities
- Institutional & retail players
- Others
Base Oil Market Regional Analysis
The base oil market by region includes North America, Asia-Pacific (APAC), Europe, South America, and Middle East & Africa (MEA).
- North America: includes the US, Canada, Mexico
- Asia Pacific: includes China, Japan, South Korea, India, Australia, ASEAN, and the Rest of APAC
- Europe: includes the UK, Germany, France, Italy, Spain, Russia, and the Rest of Europe
- South America: includes Brazil, Argentina, and the Rest of South America
- Middle East & Africa: includes Turkey, UAE, Saudi Arabia, South Africa, and the Rest of MEA
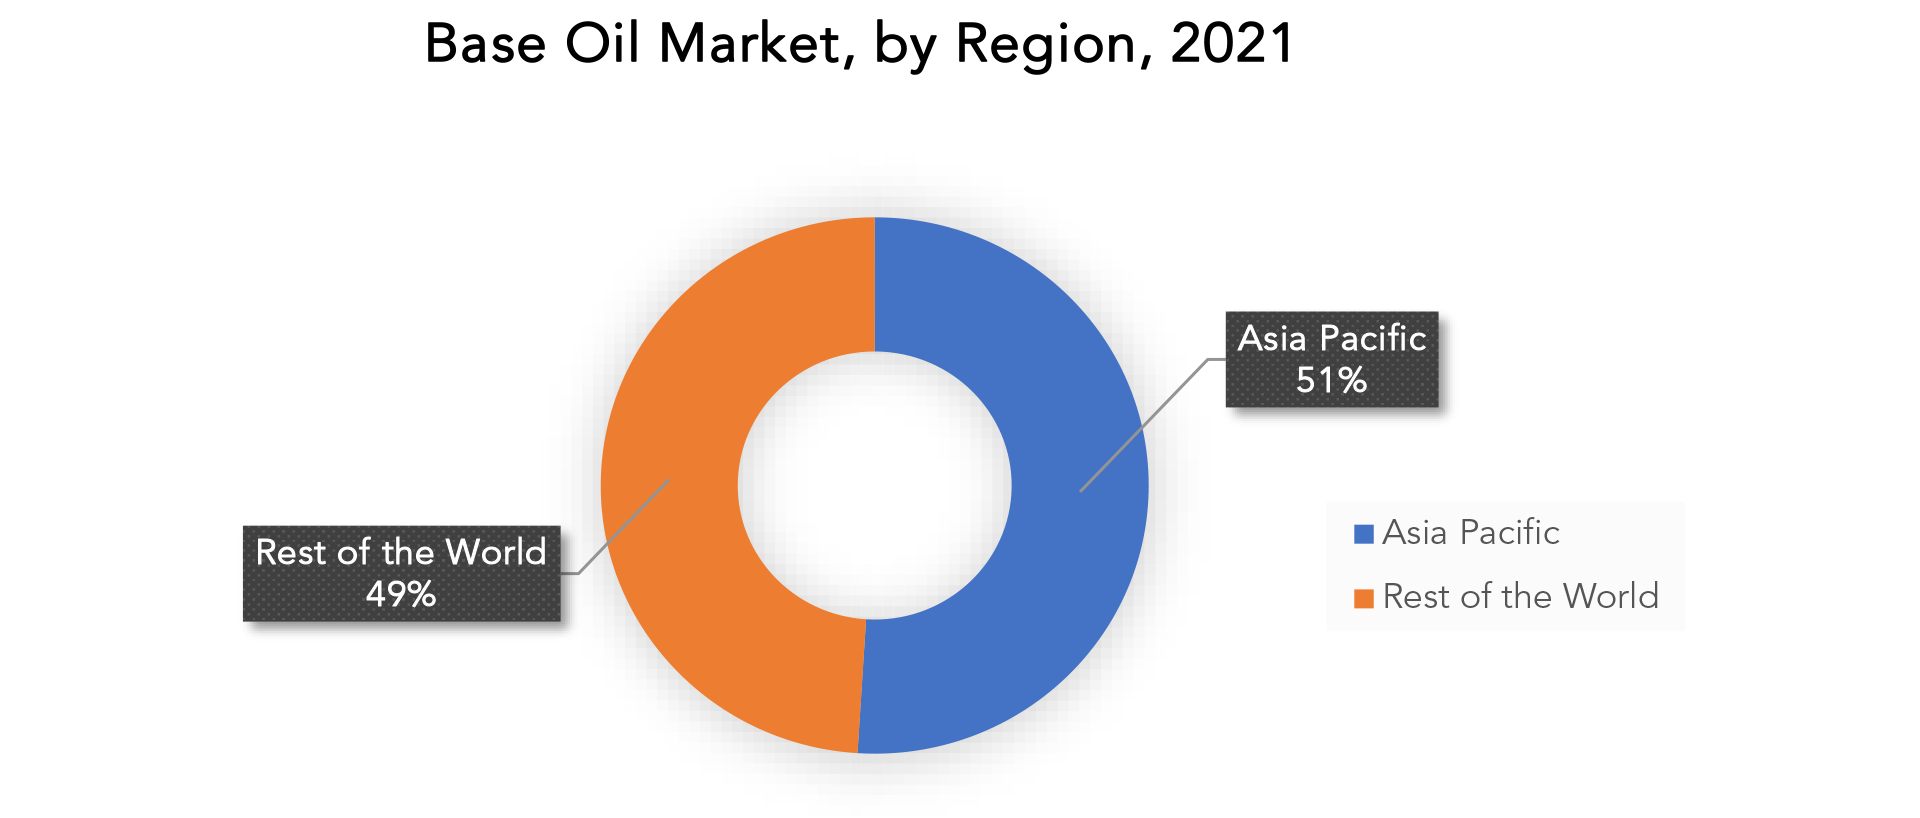
In 2021, Asia Pacific led the market and accounted for 50.6% of total revenue. This is explained by the fact that the area is a desirable market for lubricant makers due to the existence of expanding economies and the rising level of disposable income in the population. China dominates the Asia Pacific area, which is one of the world's major markets for base oil. Throughout the forecast period, China is anticipated to dominate the Asia Pacific base oil market. The supremacy is attributable to the country's booming industrial sector and greater usage of vehicles. The availability of raw supplies, greater foreign investment, fast industrialization, and a rising population all boost the Chinese market.
In the upcoming years, the base oil market is anticipated to develop due to the expanding automotive sector. The need for motor oils and lubricating greases that offer compatibility with fast-moving components and high temperatures is being driven by advanced engine technology. Additionally, superior base oils and additive technologies are used to create engine oils that maintain their viscosity, minimize engine wear, and assist ensure reliability. Automotive base oil is fuel for internal combustion engines, which power a range of machines, including lawnmowers, motorcycles, generators, and cars.
Similar to other markets, the Indian industry is anticipated to grow quickly because of the country's government's aggressive infrastructure development plans and the significant presence of multiple base oil producers. During the year 2021, Europe is expected to account for the second-largest revenue share internationally. Given that base oil makes up the majority of lubricants, the market's expansion in Europe is thought to be significantly influenced by the region's high lubricant consumption. The expansion of the transportation and industrial sectors is directly correlated with the increased base oil consumption.
Key Market Segments: Base Oil Market
Base Oil Market By Type, 2022-2029, (USD Billion), (Kilotons)- Group I
- Group II
- Group III
- Group IV
- Others
- Automotive Oil
- Industrial Oil
- Hydraulic Oil
- Grease
- Metalworking Fluid
- Food & Beverages
- Agriculture
- Healthcare
- Automotive
- Electrical & Electronics
- North America
- Asia Pacific
- Europe
- South America
- Middle East And Africa
Exactitude Consultancy Services Key Objectives:
- Increasing sales and market share
- Developing new technology
- Improving profitability
- Entering new markets
- Enhancing brand reputation
Key Question Answered
- What is the expected growth rate of the base oil market over the next 7 years?
- What are the end-user industries driving demand for the market and what is their outlook?
- What are the opportunities for growth in emerging markets such as Asia-Pacific, the Middle East, and Africa?
- How is the economic environment affecting the base oil market, including factors such as interest rates, inflation, and exchange rates?
- What is the expected impact of government policies and regulations on the base oil market?
- What are the key drivers of growth in the base oil market?
- Who are the market’s major players, and what is their market share?
- What are the base oil market's distribution channels and supply chain dynamics?
- What are the technological advancements and innovations in the base oil market and their impact on product development and growth?
- What are the regulatory considerations and their impact on the market?
- What are the challenges faced by players in the base oil market and how are they addressing these challenges?
- What are the opportunities for growth and expansion in the base oil market?
- What are the market's product offerings/ service offerings and specifications of leading players?
- What is the pricing trend of base oil in the market and what is the impact of raw material prices on the price trend?
- INTRODUZIONE
- DEFINIZIONE DI MERCATO
- SEGMENTAZIONE DEL MERCATO
- TEMPI DI RICERCA
- ASSUNZIONI E LIMITAZIONI
- METODOLOGIA DI RICERCA
- ESTRAZIONE DATI
- RICERCA SECONDARIA
- RICERCA PRIMARIA
- PARERI DEGLI ESPERTI IN MATERIA
- CONTROLLI DI QUALITÀ
- RECENSIONE FINALE
- TRIANGOLAZIONE DEI DATI
- APPROCCIO DAL BASSO VERSO L'ALTO
- APPROCCIO TOP-DOWN
- FLUSSO DI RICERCA
- FONTI DEI DATI
- ESTRAZIONE DATI
- SINTESI
- PANORAMICA DEL MERCATO
- PROSPETTIVE DEL MERCATO GLOBALE DELL'OLIO BASE SOLARE
- FATTORI DI MERCATO
- LIMITAZIONI DI MERCATO
- OPPORTUNITÀ DI MERCATO
- IMPATTO DEL COVID-19 SUL MERCATO DELL'OLIO BASE
- MODELLO DELLE CINQUE FORZE DI PORTER
- MINACCIA DAI NUOVI ENTRANSI
- MINACCIA DA SOSTITUTI
- POTERE CONTRATTUALE DEI FORNITORI
- POTERE CONTRATTUALE DEI CLIENTI
- GRADO DI COMPETIZIONE
- ANALISI DELLA CATENA DEL VALORE DEL SETTORE
- PROSPETTIVE DEL MERCATO GLOBALE DELL'OLIO BASE SOLARE
- MERCATO GLOBALE DELL'OLIO BASE PER TIPO, 2022-2029, (MILIARDI DI USD), (KILOTONI)
- GRUPPO 1
- GRUPPO 2
- GRUPPO 3
- GRUPPO 4
- ALTRI
- MERCATO GLOBALE DELL'OLIO BASE PER APPLICAZIONE, 2022-2029, (MILIARDI DI USD), (KILOTONI)
- OLIO PER AUTOMOBILI
- OLIO INDUSTRIALE
- OLIO IDRAULICO
- GRASSO
- FLUIDO PER LA LAVORAZIONE DEI METALLI
- MERCATO GLOBALE DELL'OLIO BASE PER SETTORE UTENTE FINALE, 2022-2029, (MILIARDI DI USD), (KILOTONI)
- CIBO E BEVANDE
- AGRICOLTURA
- ASSISTENZA SANITARIA
- AUTOMOBILISTICO
- ELETTRICO ED ELETTRONICO
- MERCATO GLOBALE DELL'OLIO BASE PER REGIONE, 2022-2029, (MILIARDI DI USD), (KILOTONI)
- AMERICA DEL NORD
- NOI
- CANADA
- MESSICO
- SUD AMERICA
- BRASILE
- ARGENTINA
- COLOMBIA
- RESTO DEL SUD AMERICA
- EUROPA
- GERMANIA
- Regno Unito
- FRANCIA
- ITALIA
- SPAGNA
- RUSSIA
- RESTO D'EUROPA
- ASIA PACIFICO
- INDIA
- CINA
- GIAPPONE
- COREA DEL SUD
- AUSTRALIA
- ASIA SUD-ORIENTALE
- RESTO DELL'ASIA PACIFICO
- MEDIO ORIENTE E AFRICA
- Emirati Arabi Uniti
- ARABIA SAUDITA
- SUDAFRICA
- RESTO DEL MEDIO ORIENTE E AFRICA
- AMERICA DEL NORD
- PROFILI AZIENDALI* (PANORAMICA AZIENDALE, PANORAMICA AZIENDALE, PRODOTTI OFFERTI, SVILUPPI RECENTI)
- CHEVRON CORPORATION
- EXXON MOBIL CORPORATION
- ROYAL DUTCH SHELL PLC
- ERGON INC
- NESTE OYJ
- NYNAS AB
- S-OIL CORPORATION
- SEPAHAN OIL
- REPSOL S.A.
- SINOPEC LIMITED
- BP PLC
- EVONIK INDUSTRIES AG
- H&R GROUP
- SAUDI ARMACO
- SK LUBRICANTS CO. LTD
*THE COMPANY LIST IS INDICATIVE
LIST OF TABLES
TABLE 1 GLOBAL BASE OIL MARKET BY TYPE (USD BILLION) 2022-2029
TABLE 2 GLOBAL BASE OIL MARKET BY TYPE (KILOTONS) 2022-2029
TABLE 3 GLOBAL BASE OIL MARKET BY APPLICATION (USD BILLION) 2022-2029
TABLE 4 GLOBAL BASE OIL MARKET BY APPLICATION (KILOTONS) 2022-2029
TABLE 5 GLOBAL BASE OIL MARKET BY END USER (USD BILLION) 2022-2029
TABLE 6 GLOBAL BASE OIL MARKET BY END USER (KILOTONS) 2022-2029
TABLE 7 GLOBAL BASE OIL MARKET BY REGION (USD BILLION) 2022-2029
TABLE 8 GLOBAL BASE OIL MARKET BY REGION (KILOTONS) 2022-2029
TABLE 9 NORTH AMERICA BASE OIL MARKET BY COUNTRY (USD BILLION) 2022-2029
TABLE 10 NORTH AMERICA BASE OIL MARKET BY COUNTRY (KILOTONS) 2022-2029
TABLE 11 NORTH AMERICA BASE OIL MARKET BY TYPE (USD BILLION) 2022-2029
TABLE 12 NORTH AMERICA BASE OIL MARKET BY TYPE (KILOTONS) 2022-2029
TABLE 13 NORTH AMERICA BASE OIL MARKET BY APPLICATION (USD BILLION) 2022-2029
TABLE 14 NORTH AMERICA BASE OIL MARKET BY APPLICATION (KILOTONS) 2022-2029
TABLE 15 NORTH AMERICA BASE OIL MARKET BY END USER (USD BILLION) 2022-2029
TABLE 16 NORTH AMERICA BASE OIL MARKET BY END USER (KILOTONS) 2022-2029
TABLE 17 US BASE OIL MARKET BY TYPE (USD BILLION) 2022-2029
TABLE 18 US BASE OIL MARKET BY TYPE (KILOTONS) 2022-2029
TABLE 19 US BASE OIL MARKET BY APPLICATION (USD BILLION) 2022-2029
TABLE 20 US BASE OIL MARKET BY APPLICATION (KILOTONS) 2022-2029
TABLE 21 US BASE OIL MARKET BY END USER (USD BILLION) 2022-2029
TABLE 22 US BASE OIL MARKET BY END USER (KILOTONS) 2022-2029
TABLE 23 CANADA BASE OIL MARKET BY TYPE (USD BILLION) 2022-2029
TABLE 24 CANADA BASE OIL MARKET BY TYPE (KILOTONS) 2022-2029
TABLE 25 CANADA BASE OIL MARKET BY APPLICATION (USD BILLION) 2022-2029
TABLE 26 CANADA BASE OIL MARKET BY APPLICATION (KILOTONS) 2022-2029
TABLE 27 CANADA BASE OIL MARKET BY END USER (USD BILLION) 2022-2029
TABLE 28 CANADA BASE OIL MARKET BY END USER (KILOTONS) 2022-2029
TABLE 29 MEXICO BASE OIL MARKET BY TYPE (USD BILLION) 2022-2029
TABLE 30 MEXICO BASE OIL MARKET BY TYPE (KILOTONS) 2022-2029
TABLE 31 MEXICO BASE OIL MARKET BY APPLICATION (USD BILLION) 2022-2029
TABLE 32 MEXICO BASE OIL MARKET BY APPLICATION (KILOTONS) 2022-2029
TABLE 33 MEXICO BASE OIL MARKET BY END USER (USD BILLION) 2022-2029
TABLE 34 MEXICO BASE OIL MARKET BY END USER (KILOTONS) 2022-2029
TABLE 35 SOUTH AMERICA BASE OIL MARKET BY COUNTRY (USD BILLION) 2022-2029
TABLE 36 SOUTH AMERICA BASE OIL MARKET BY COUNTRY (KILOTONS) 2022-2029
TABLE 37 SOUTH AMERICA BASE OIL MARKET BY TYPE (USD BILLION) 2022-2029
TABLE 38 SOUTH AMERICA BASE OIL MARKET BY TYPE (KILOTONS) 2022-2029
TABLE 39 SOUTH AMERICA BASE OIL MARKET BY APPLICATION (USD BILLION) 2022-2029
TABLE 40 SOUTH AMERICA BASE OIL MARKET BY APPLICATION (KILOTONS) 2022-2029
TABLE 41 SOUTH AMERICA BASE OIL MARKET BY END USER (USD BILLION) 2022-2029
TABLE 42 SOUTH AMERICA BASE OIL MARKET BY END USER (KILOTONS) 2022-2029
TABLE 43 BRAZIL BASE OIL MARKET BY TYPE (USD BILLION) 2022-2029
TABLE 44 BRAZIL BASE OIL MARKET BY TYPE (KILOTONS) 2022-2029
TABLE 45 BRAZIL BASE OIL MARKET BY APPLICATION (USD BILLION) 2022-2029
TABLE 46 BRAZIL BASE OIL MARKET BY APPLICATION (KILOTONS) 2022-2029
TABLE 47 BRAZIL BASE OIL MARKET BY END USER (USD BILLION) 2022-2029
TABLE 48 BRAZIL BASE OIL MARKET BY END USER (KILOTONS) 2022-2029
TABLE 49 ARGENTINA BASE OIL MARKET BY TYPE (USD BILLION) 2022-2029
TABLE 50 ARGENTINA BASE OIL MARKET BY TYPE (KILOTONS) 2022-2029
TABLE 51 ARGENTINA BASE OIL MARKET BY APPLICATION (USD BILLION) 2022-2029
TABLE 52 ARGENTINA BASE OIL MARKET BY APPLICATION (KILOTONS) 2022-2029
TABLE 53 ARGENTINA BASE OIL MARKET BY END USER (USD BILLION) 2022-2029
TABLE 54 ARGENTINA BASE OIL MARKET BY END USER (KILOTONS) 2022-2029
TABLE 55 COLOMBIA BASE OIL MARKET BY TYPE (USD BILLION) 2022-2029
TABLE 56 COLOMBIA BASE OIL MARKET BY TYPE (KILOTONS) 2022-2029
TABLE 57 COLOMBIA BASE OIL MARKET BY APPLICATION (USD BILLION) 2022-2029
TABLE 58 COLOMBIA BASE OIL MARKET BY APPLICATION (KILOTONS) 2022-2029
TABLE 59 COLOMBIA BASE OIL MARKET BY END USER (USD BILLION) 2022-2029
TABLE 60 COLOMBIA BASE OIL MARKET BY END USER (KILOTONS) 2022-2029
TABLE 61 REST OF SOUTH AMERICA BASE OIL MARKET BY TYPE (USD BILLION) 2022-2029
TABLE 62 REST OF SOUTH AMERICA BASE OIL MARKET BY TYPE (KILOTONS) 2022-2029
TABLE 63 REST OF SOUTH AMERICA BASE OIL MARKET BY APPLICATION (USD BILLION) 2022-2029
TABLE 64 REST OF SOUTH AMERICA BASE OIL MARKET BY APPLICATION (KILOTONS) 2022-2029
TABLE 65 REST OF SOUTH AMERICA BASE OIL MARKET BY END USER (USD BILLION) 2022-2029
TABLE 66 REST OF SOUTH AMERICA BASE OIL MARKET BY END USER (KILOTONS) 2022-2029
TABLE 67 ASIA-PACIFIC BASE OIL MARKET BY COUNTRY (USD BILLION) 2022-2029
TABLE 68 ASIA-PACIFIC BASE OIL MARKET BY COUNTRY (KILOTONS) 2022-2029
TABLE 69 ASIA-PACIFIC BASE OIL MARKET BY TYPE (USD BILLION) 2022-2029
TABLE 70 ASIA-PACIFIC BASE OIL MARKET BY TYPE (KILOTONS) 2022-2029
TABLE 71 ASIA-PACIFIC BASE OIL MARKET BY APPLICATION (USD BILLION) 2022-2029
TABLE 72 ASIA-PACIFIC BASE OIL MARKET BY APPLICATION (KILOTONS) 2022-2029
TABLE 73 ASIA-PACIFIC BASE OIL MARKET BY END USER (USD BILLION) 2022-2029
TABLE 74 ASIA-PACIFIC BASE OIL MARKET BY END USER (KILOTONS) 2022-2029
TABLE 75 INDIA BASE OIL MARKET BY TYPE (USD BILLION) 2022-2029
TABLE 76 INDIA BASE OIL MARKET BY TYPE (KILOTONS) 2022-2029
TABLE 77 INDIA BASE OIL MARKET BY APPLICATION (USD BILLION) 2022-2029
TABLE 78 INDIA BASE OIL MARKET BY APPLICATION (KILOTONS) 2022-2029
TABLE 79 INDIA BASE OIL MARKET BY END USER (USD BILLION) 2022-2029
TABLE 80 INDIA BASE OIL MARKET BY END USER (KILOTONS) 2022-2029
TABLE 81 CHINA BASE OIL MARKET BY TYPE (USD BILLION) 2022-2029
TABLE 82 CHINA BASE OIL MARKET BY TYPE (KILOTONS) 2022-2029
TABLE 83 CHINA BASE OIL MARKET BY APPLICATION (USD BILLION) 2022-2029
TABLE 84 CHINA BASE OIL MARKET BY APPLICATION (KILOTONS) 2022-2029
TABLE 85 CHINA BASE OIL MARKET BY END USER (USD BILLION) 2022-2029
TABLE 86 CHINA BASE OIL MARKET BY END USER (KILOTONS) 2022-2029
TABLE 87 JAPAN BASE OIL MARKET BY TYPE (USD BILLION) 2022-2029
TABLE 88 JAPAN BASE OIL MARKET BY TYPE (KILOTONS) 2022-2029
TABLE 89 JAPAN BASE OIL MARKET BY APPLICATION (USD BILLION) 2022-2029
TABLE 90 JAPAN BASE OIL MARKET BY APPLICATION (KILOTONS) 2022-2029
TABLE 91 JAPAN BASE OIL MARKET BY END USER (USD BILLION) 2022-2029
TABLE 92 JAPAN BASE OIL MARKET BY END USER (KILOTONS) 2022-2029
TABLE 93 SOUTH KOREA BASE OIL MARKET BY TYPE (USD BILLION) 2022-2029
TABLE 94 SOUTH KOREA BASE OIL MARKET BY TYPE (KILOTONS) 2022-2029
TABLE 95 SOUTH KOREA BASE OIL MARKET BY APPLICATION (USD BILLION) 2022-2029
TABLE 96 SOUTH KOREA BASE OIL MARKET BY APPLICATION (KILOTONS) 2022-2029
TABLE 97 SOUTH KOREA BASE OIL MARKET BY END USER (USD BILLION) 2022-2029
TABLE 98 SOUTH KOREA BASE OIL MARKET BY END USER (KILOTONS) 2022-2029
TABLE 99 AUSTRALIA BASE OIL MARKET BY TYPE (USD BILLION) 2022-2029
TABLE 100 AUSTRALIA BASE OIL MARKET BY TYPE (KILOTONS) 2022-2029
TABLE 101 AUSTRALIA BASE OIL MARKET BY APPLICATION (USD BILLION) 2022-2029
TABLE 102 AUSTRALIA BASE OIL MARKET BY APPLICATION (KILOTONS) 2022-2029
TABLE 103 AUSTRALIA BASE OIL MARKET BY END USER (USD BILLION) 2022-2029
TABLE 104 AUSTRALIA BASE OIL MARKET BY END USER (KILOTONS) 2022-2029
TABLE 105 SOUTH-EAST ASIA BASE OIL MARKET BY TYPE (USD BILLION) 2022-2029
TABLE 106 SOUTH-EAST ASIA BASE OIL MARKET BY TYPE (KILOTONS) 2022-2029
TABLE 107 SOUTH-EAST ASIA BASE OIL MARKET BY APPLICATION (USD BILLION) 2022-2029
TABLE 108 SOUTH-EAST ASIA BASE OIL MARKET BY APPLICATION (KILOTONS) 2022-2029
TABLE 109 SOUTH-EAST ASIA BASE OIL MARKET BY END USER (USD BILLION) 2022-2029
TABLE 110 SOUTH-EAST ASIA BASE OIL MARKET BY END USER (KILOTONS) 2022-2029
TABLE 111 REST OF ASIA PACIFIC BASE OIL MARKET BY TYPE (USD BILLION) 2022-2029
TABLE 112 REST OF ASIA PACIFIC BASE OIL MARKET BY TYPE (KILOTONS) 2022-2029
TABLE 113 REST OF ASIA PACIFIC BASE OIL MARKET BY APPLICATION (USD BILLION) 2022-2029
TABLE 114 REST OF ASIA PACIFIC BASE OIL MARKET BY APPLICATION (KILOTONS) 2022-2029
TABLE 115 REST OF ASIA PACIFIC BASE OIL MARKET BY END USER (USD BILLION) 2022-2029
TABLE 116 REST OF ASIA PACIFIC BASE OIL MARKET BY END USER (KILOTONS) 2022-2029
TABLE 117 EUROPE BASE OIL MARKET BY COUNTRY (USD BILLION) 2022-2029
TABLE 118 EUROPE BASE OIL MARKET BY COUNTRY (KILOTONS) 2022-2029
TABLE 119 ASIA-PACIFIC BASE OIL MARKET BY TYPE (USD BILLION) 2022-2029
TABLE 120 ASIA-PACIFIC BASE OIL MARKET BY TYPE (KILOTONS) 2022-2029
TABLE 121 ASIA-PACIFIC BASE OIL MARKET BY APPLICATION (USD BILLION) 2022-2029
TABLE 122 ASIA-PACIFIC BASE OIL MARKET BY APPLICATION (KILOTONS) 2022-2029
TABLE 123 ASIA-PACIFIC BASE OIL MARKET BY END USER (USD BILLION) 2022-2029
TABLE 124 ASIA-PACIFIC BASE OIL MARKET BY END USER (KILOTONS) 2022-2029
TABLE 125 GERMANY BASE OIL MARKET BY TYPE (USD BILLION) 2022-2029
TABLE 126 GERMANY BASE OIL MARKET BY TYPE (KILOTONS) 2022-2029
TABLE 127 GERMANY BASE OIL MARKET BY APPLICATION (USD BILLION) 2022-2029
TABLE 128 GERMANY BASE OIL MARKET BY APPLICATION (KILOTONS) 2022-2029
TABLE 129 GERMANY BASE OIL MARKET BY END USER (USD BILLION) 2022-2029
TABLE 130 GERMANY BASE OIL MARKET BY END USER (KILOTONS) 2022-2029
TABLE 131 UK BASE OIL MARKET BY TYPE (USD BILLION) 2022-2029
TABLE 132 UK BASE OIL MARKET BY TYPE (KILOTONS) 2022-2029
TABLE 133 UK BASE OIL MARKET BY APPLICATION (USD BILLION) 2022-2029
TABLE 134 UK BASE OIL MARKET BY APPLICATION (KILOTONS) 2022-2029
TABLE 135 UK BASE OIL MARKET BY END USER (USD BILLION) 2022-2029
TABLE 136 UK BASE OIL MARKET BY END USER (KILOTONS) 2022-2029
TABLE 137 FRANCE BASE OIL MARKET BY TYPE (USD BILLION) 2022-2029
TABLE 138 FRANCE BASE OIL MARKET BY TYPE (KILOTONS) 2022-2029
TABLE 139 FRANCE BASE OIL MARKET BY APPLICATION (USD BILLION) 2022-2029
TABLE 140 FRANCE BASE OIL MARKET BY APPLICATION (KILOTONS) 2022-2029
TABLE 141 FRANCE BASE OIL MARKET BY END USER (USD BILLION) 2022-2029
TABLE 142 FRANCE BASE OIL MARKET BY END USER (KILOTONS) 2022-2029
TABLE 143 ITALY BASE OIL MARKET BY TYPE (USD BILLION) 2022-2029
TABLE 144 ITALY BASE OIL MARKET BY TYPE (KILOTONS) 2022-2029
TABLE 145 ITALY BASE OIL MARKET BY APPLICATION (USD BILLION) 2022-2029
TABLE 146 ITALY BASE OIL MARKET BY APPLICATION (KILOTONS) 2022-2029
TABLE 147 ITALY BASE OIL MARKET BY END USER (USD BILLION) 2022-2029
TABLE 148 ITALY BASE OIL MARKET BY END USER (KILOTONS) 2022-2029
TABLE 149 SPAIN BASE OIL MARKET BY TYPE (USD BILLION) 2022-2029
TABLE 150 SPAIN BASE OIL MARKET BY TYPE (KILOTONS) 2022-2029
TABLE 151 SPAIN BASE OIL MARKET BY APPLICATION (USD BILLION) 2022-2029
TABLE 152 SPAIN BASE OIL MARKET BY APPLICATION (KILOTONS) 2022-2029
TABLE 153 SPAIN BASE OIL MARKET BY END USER (USD BILLION) 2022-2029
TABLE 154 SPAIN BASE OIL MARKET BY END USER (KILOTONS) 2022-2029
TABLE 155 RUSSIA BASE OIL MARKET BY TYPE (USD BILLION) 2022-2029
TABLE 156 RUSSIA BASE OIL MARKET BY TYPE (KILOTONS) 2022-2029
TABLE 157 RUSSIA BASE OIL MARKET BY APPLICATION (USD BILLION) 2022-2029
TABLE 158 RUSSIA BASE OIL MARKET BY APPLICATION (KILOTONS) 2022-2029
TABLE 159 RUSSIA BASE OIL MARKET BY END USER (USD BILLION) 2022-2029
TABLE 160 RUSSIA BASE OIL MARKET BY END USER (KILOTONS) 2022-2029
TABLE 161 REST OF EUROPE BASE OIL MARKET BY TYPE (USD BILLION) 2022-2029
TABLE 162 REST OF EUROPE BASE OIL MARKET BY TYPE (KILOTONS) 2022-2029
TABLE 163 REST OF EUROPE BASE OIL MARKET BY APPLICATION (USD BILLION) 2022-2029
TABLE 164 REST OF EUROPE BASE OIL MARKET BY APPLICATION (KILOTONS) 2022-2029
TABLE 165 REST OF EUROPE BASE OIL MARKET BY END USER (USD BILLION) 2022-2029
TABLE 166 REST OF EUROPE BASE OIL MARKET BY END USER (KILOTONS) 2022-2029
TABLE 167 MIDDLE EAST AND AFRICA BASE OIL MARKET BY COUNTRY (USD BILLION) 2022-2029
TABLE 168 MIDDLE EAST AND AFRICA BASE OIL MARKET BY COUNTRY (KILOTONS) 2022-2029
TABLE 169 MIDDLE EAST AND AFRICA BASE OIL MARKET BY TYPE (USD BILLION) 2022-2029
TABLE 170 MIDDLE EAST AND AFRICA BASE OIL MARKET BY TYPE (KILOTONS) 2022-2029
TABLE 171 MIDDLE EAST AND AFRICA BASE OIL MARKET BY APPLICATION (USD BILLION) 2022-2029
TABLE 172 MIDDLE EAST AND AFRICA BASE OIL MARKET BY APPLICATION (KILOTONS) 2022-2029
TABLE 173 MIDDLE EAST AND AFRICA BASE OIL MARKET BY END USER (USD BILLION) 2022-2029
TABLE 174 MIDDLE EAST AND AFRICA BASE OIL MARKET BY END USER (KILOTONS) 2022-2029
TABLE 175 UAE BASE OIL MARKET BY TYPE (USD BILLION) 2022-2029
TABLE 176 UAE BASE OIL MARKET BY TYPE (KILOTONS) 2022-2029
TABLE 177 UAE BASE OIL MARKET BY APPLICATION (USD BILLION) 2022-2029
TABLE 178 UAE BASE OIL MARKET BY APPLICATION (KILOTONS) 2022-2029
TABLE 179 UAE BASE OIL MARKET BY END USER (USD BILLION) 2022-2029
TABLE 180 UAE BASE OIL MARKET BY END USER (KILOTONS) 2022-2029
TABLE 181 SAUDI ARABIA BASE OIL MARKET BY TYPE (USD BILLION) 2022-2029
TABLE 182 SAUDI ARABIA BASE OIL MARKET BY TYPE (KILOTONS) 2022-2029
TABLE 183 SAUDI ARABIA BASE OIL MARKET BY APPLICATION (USD BILLION) 2022-2029
TABLE 184 SAUDI ARABIA BASE OIL MARKET BY APPLICATION (KILOTONS) 2022-2029
TABLE 185 SAUDI ARABIA BASE OIL MARKET BY END USER (USD BILLION) 2022-2029
TABLE 186 SAUDI ARABIA BASE OIL MARKET BY END USER (KILOTONS) 2022-2029
TABLE 187 SOUTH AFRICA BASE OIL MARKET BY TYPE (USD BILLION) 2022-2029
TABLE 188 SOUTH AFRICA BASE OIL MARKET BY TYPE (KILOTONS) 2022-2029
TABLE 189 SOUTH AFRICA BASE OIL MARKET BY APPLICATION (USD BILLION) 2022-2029
TABLE 190 SOUTH AFRICA BASE OIL MARKET BY APPLICATION (KILOTONS) 2022-2029
TABLE 191 SOUTH AFRICA BASE OIL MARKET BY END USER (USD BILLION) 2022-2029
TABLE 192 SOUTH AFRICA BASE OIL MARKET BY END USER (KILOTONS) 2022-2029
TABLE 193 REST OF MIDDLE EAST AND AFRICA BASE OIL MARKET BY TYPE (USD BILLION) 2022-2029
TABLE 194 REST OF MIDDLE EAST AND AFRICA BASE OIL MARKET BY TYPE (KILOTONS) 2022-2029
TABLE 195 REST OF MIDDLE EAST AND AFRICA BASE OIL MARKET BY APPLICATION (USD BILLION) 2022-2029
TABLE 196 REST OF MIDDLE EAST AND AFRICA BASE OIL MARKET BY APPLICATION (KILOTONS) 2022-2029
TABLE 197 REST OF MIDDLE EAST AND AFRICA BASE OIL MARKET BY END USER (USD BILLION) 2022-2029
TABLE 198 REST OF MIDDLE EAST AND AFRICA BASE OIL MARKET BY END USER (KILOTONS) 2022-2029
LIST OF FIGURES
FIGURE 1 MARKET DYNAMICS
FIGURE 2 MARKET SEGMENTATION
FIGURE 3 REPORT TIMELINES: YEARS CONSIDERED
FIGURE 4 DATA TRIANGULATION
FIGURE 5 BOTTOM-UP APPROACH
FIGURE 6 TOP-DOWN APPROACH
FIGURE 7 RESEARCH FLOW
FIGURE 8 GLOBAL BASE OIL MARKET BY TYPE, USD BILLION, 2022-2029
FIGURE 9 GLOBAL BASE OIL MARKET BY APPLICATION, USD BILLION, 2022-2029
FIGURE 10 GLOBAL BASE OIL MARKET BY END USER, USD BILLION, 2022-2029
FIGURE 11 GLOBAL BASE OIL MARKET BY REGION, USD BILLION, 2022-2029
FIGURE 12 PORTER’S FIVE FORCES MODEL
FIGURE 13 GLOBAL BASE OIL MARKET BY TYPE, 2021
FIGURE 14 GLOBAL BASE OIL MARKET BY APPLICATION 2021
FIGURE 15 GLOBAL BASE OIL MARKET BY END USER 2021
FIGURE 16 BASE OIL MARKET BY REGION 2021
FIGURE 17 MARKET SHARE ANALYSIS
FIGURE 18 CHEVRON CORPORATION: COMPANY SNAPSHOT
FIGURE 19 EXXON MOBIL CORPORATION: COMPANY SNAPSHOT
FIGURE 20 ROYAL DUTCH SHELL PLC: COMPANY SNAPSHOT
FIGURE 21 ERGON INC: COMPANY SNAPSHOT
FIGURE 22 NESTE OYJ: COMPANY SNAPSHOT
FIGURE 23 NYNAS AB: COMPANY SNAPSHOT
FIGURE 24 S-OIL CORPORATION: COMPANY SNAPSHOT
FIGURE 25 SEPAHAN OIL: COMPANY SNAPSHOT
FIGURE 26 REPSOL S.A: COMPANY SNAPSHOT
DOWNLOAD FREE SAMPLE REPORT
License Type
SPEAK WITH OUR ANALYST
Want to know more about the report or any specific requirement?
WANT TO CUSTOMIZE THE REPORT?
Our Clients Speak
We asked them to research ‘ Equipment market’ all over the world, and their whole arrangement was helpful to us. thehealthanalytics.com insightful analysis and reports contributed to our current analysis and in creating a future strategy. Besides, the te
Yosuke Mitsui
Senior Associate Construction Equipment Sales & Marketing
We asked them to research ‘Equipment market’ all over the world, and their whole arrangement was helpful to us. thehealthanalytics.com insightful analysis and reports contributed to our current analysis and in creating a future strategy. Besides, the te


