

Base Year Value ()
x.x %
x.x %
CAGR ()
x.x %
x.x %
Forecast Year Value ()
x.x %
x.x %
Historical Data Period
Largest Region
Forecast Period
Il mercato del metanolo è segmentato in base a materia prima (carbone, gas naturale, altri), derivato (benzina, MTO/MTP, formaldeide, metil-terz-butil-etere, acido acetico, dimetil-etere, metil-metacrilato, biodiesel, altri), sotto-derivato (additivi per benzina, olefine, resine UF/PF, VAM, poliacetali, MDI, PTA, esteri acetati, anidride acetica, carburanti, altri), utente finale (edilizia, automotive, elettronica, elettrodomestici, vernici e rivestimenti, isolamento, prodotti farmaceutici, imballaggi, solventi, altri) e regione, tendenze globali e previsioni dal 2022 al 2029
Instant access to hundreds of data points and trends
- Market estimates from 2014-2029
- Competitive analysis, industry segmentation, financial benchmarks
- Incorporates SWOT, Porter's Five Forces and risk management frameworks
- PDF report or online database with Word, Excel and PowerPoint export options
- 100% money back guarantee
Panoramica del mercato del metanolo
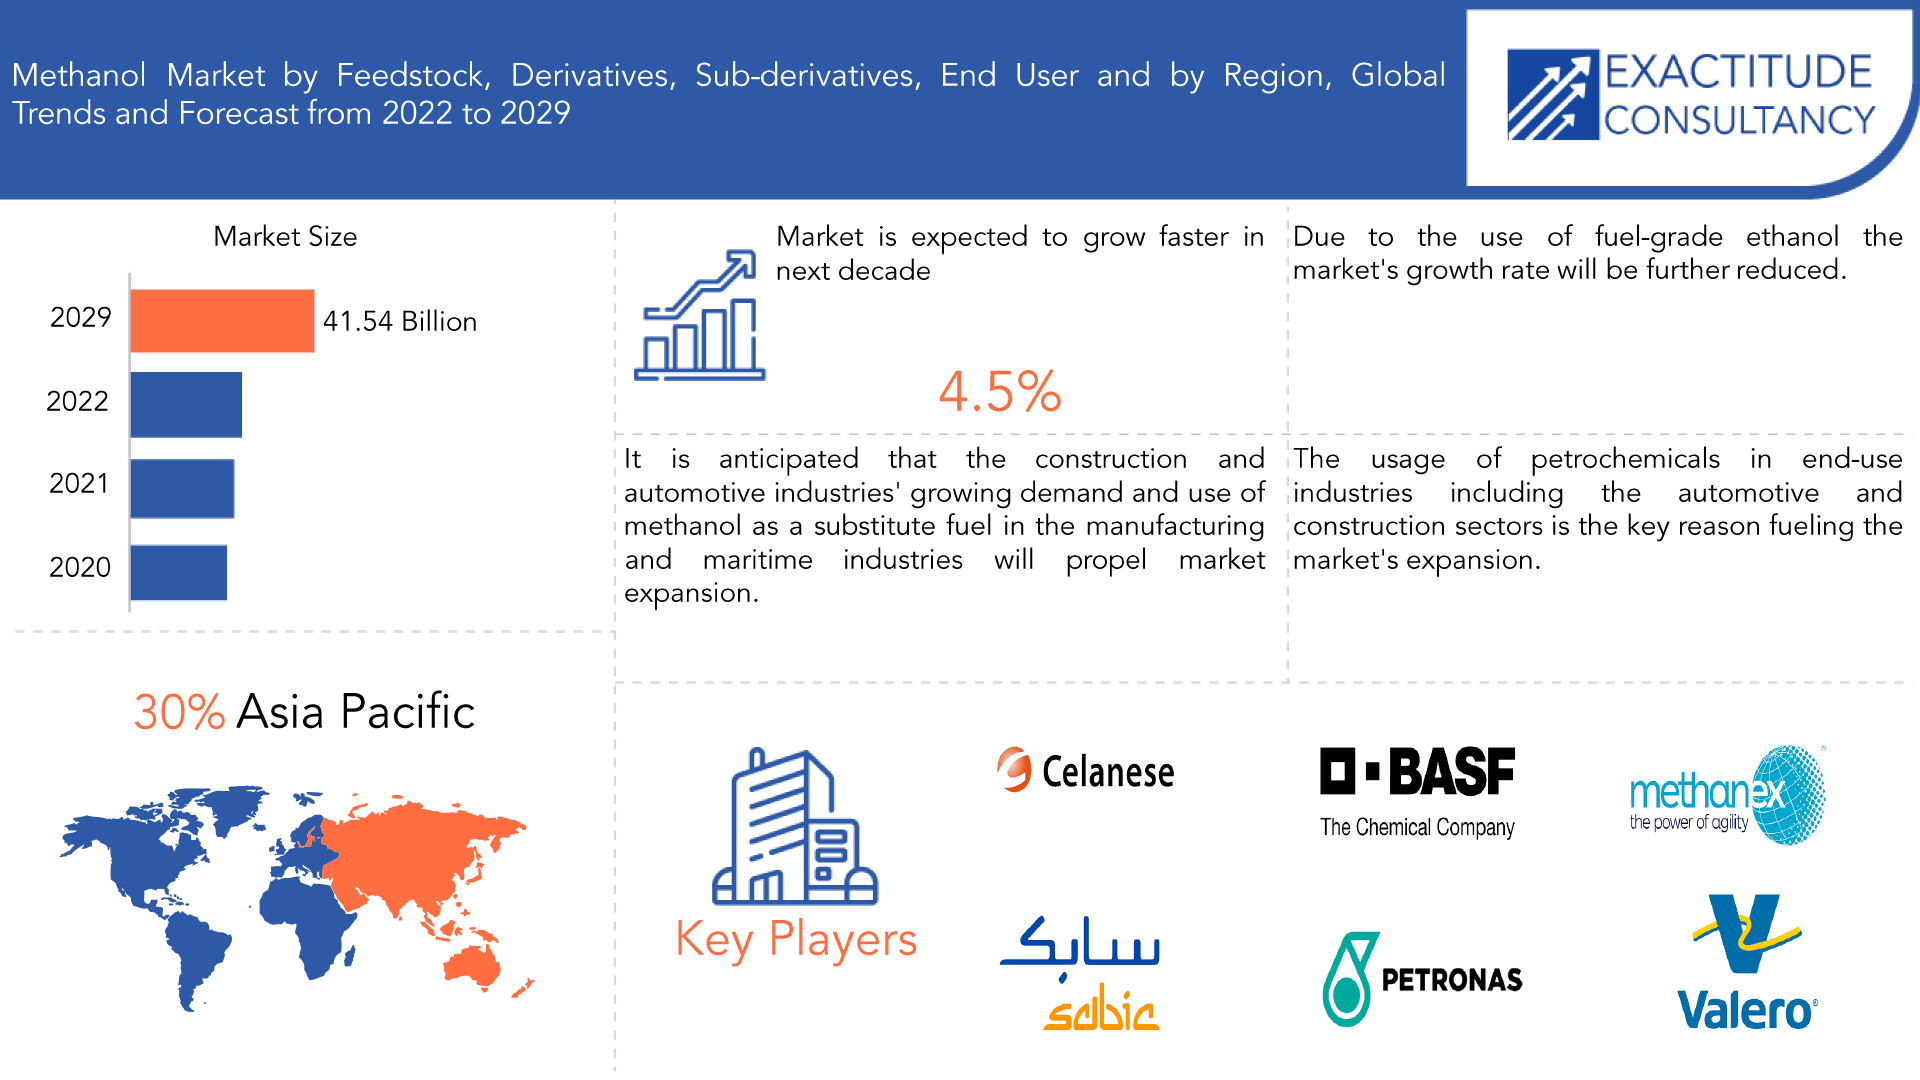
Si prevede che il mercato del metanolo crescerà al 4,5% di CAGR dal 2022 al 2029. Era valutato 27,95 miliardi nel 2020. Si prevede che raggiungerà oltre 41,54 miliardi di USD entro il 2029.
Si prevede che la crescente domanda dei settori dell'edilizia e dell'automotive stimolerà l'espansione del mercato. L'uso di prodotti petrolchimici nei settori di utilizzo finale, tra cui l'automotive e l'edilizia, è la ragione principale che alimenta l'espansione del mercato.
Il metanolo, a volte indicato come idrato di metile o alcol metilico , è una sostanza incolore e infiammabile con un forte odore alcolico. Il metanolo trova ampio utilizzo in una varietà di settori, tra cui isolamento, vernici e rivestimenti, imballaggio, prodotti farmaceutici, vernici e rivestimenti e automotive. Inoltre, è impiegato nella produzione di forniture mediche come berretti con cappuccio, grembiuli, maschere, camici medici, guanti, disinfettanti, prodotti farmaceutici e altri. Il metanolo è inoltre impiegato negli impianti di trattamento delle acque reflue per disinfettare l'acqua. La conversione del nitrato in eccesso dalle acque reflue in gas azoto ed emissioni atmosferiche è un processo noto come denitrificazione.
| ATTRIBUTO | DETTAGLI |
| Periodo di studio | 2020-2029 |
| Anno base | 2021 |
| Anno stimato | 2022 |
| Anno previsto | 2022-2029 |
| Periodo storico | 2018-2020 |
| Unità | Valore (miliardi di USD, chilotoni) |
| Segmentazione | Per materia prima, per derivato, per sotto-derivato, per utente finale |
| Per materia prima |
|
| Per derivato |
|
| Per sotto-derivata |
|
| Per utente finale |
|
| Per regione |
|
Il metanolo sta diventando sempre più utilizzato come carburante per i trasporti e nell'industria marittima. A differenza del carburante a base di benzina, il metanolo è una forma di carburante per i trasporti più economica e adattabile. Il metanolo può sostituire i carburanti a base di benzina come il diesel grazie a queste caratteristiche. Acido acetico, olefine, metilmetacrilato, silicone, formaldeide e altre sostanze chimiche vengono prodotte nell'industria chimica utilizzando il metanolo. Adesivi, materie plastiche, vernici, sigillanti, apparecchiature mediche, produzione di automobili, lubrificanti e altri prodotti sono solo alcuni degli usi finali di queste sostanze.
Il consumo di metanolo aumenterà a causa della domanda crescente da parte di settori quali l'industria automobilistica e quella edile. L'alcol metilico viene utilizzato per realizzare materiali isolanti, tessuti, materie plastiche e adesivi. I polimeri svolgono una funzione cruciale nelle automobili, riducendo il peso del veicolo, il che migliora l'efficienza del carburante e conferisce l'aspetto del metallo. Durante il periodo di previsione, l'aumento sarà alimentato dall'uso di materie plastiche nel settore edile. Durante il periodo di proiezione, l'espansione del mercato sarà supportata dalla domanda di abiti nei settori dei beni di consumo e dell'arredamento.
Un altro aspetto motivante è il crescente utilizzo del metanolo in applicazioni che prevedono la miscelazione di carburante. Il metanolo è un liquido incolore e infiammabile che viene spesso combinato con alcol etilico per l'uso in una varietà di applicazioni industriali. Man mano che gli utenti finali si rivolgono a carburanti sostenibili, il mercato del metanolo si trova di fronte a enormi prospettive. Grazie al suo carattere adattabile e alle applicazioni in una varietà di settori, questo alcol soddisferà le esigenze di una popolazione globale in espansione.
[caption id="allegato_18368" align="aligncenter" width="1920"]
Frequently Asked Questions
What is the worth of methanol market?
Methanol market is expected to grow at 4.5% CAGR from 2022 to 2029. it is expected to reach above USD 41.95 billion by 2029.
What is the size of the Asia Pacific in methanol industry?
Asia Pacific held more than 30% of methanol market revenue share in 2021 and will witness expansion in the forecast period.
What are some of the market's driving forces?
It is anticipated that the construction and automotive industries' growing demand will propel market expansion. The usage of petrochemicals in end-use industries including the automotive and construction sectors is the key reason fueling the market's expansion.
Which are the top companies to hold the market share in methanol market?
Celanese Corporation, BASF SE, Methanex Corporation, SABIC, Petroliam Nasional Berhad (PETRONAS), Mitsubishi Gas Chemical Company, Inc., Valero, Mitsui & Co., Ltd., Methanol Holdings (Trinidad) Limited., Zagros Petrochemical Co.
What is the leading component segment of methanol market?
Over the projection period, the natural gas segment will command a large market share. This market sector is anticipated to expand because to the low cost of production that results in a considerable output. Together with an increase in the use of coal to generate methyl alcohol in many nations with substantial coal output, the coal section is also anticipated to pass the end of the line successfully.
Methanol Market Dynamics
Growth Drivers:On a worldwide scale, the growing need from sectors like automotive and construction is predicted to boost its usage. Methyl alcohol serves as a starting point for different chemicals and compounds, including adhesives, plastics, textiles, insulation materials, and more. Plastics are crucial in cars as they lower the vehicle's weight, providing qualities like metals and enhancing fuel efficiency. Plastics are utilized in various applications in construction, from piping to crane ropes. Additionally, the market will be driven by the need for adhesives in the furniture and consumer goods sectors. Moreover, the anticipated rise in methanol consumption for fuel blending purposes is projected to drive the market's advancement in the forecast period.
Worldwide, the rapidly expanding electronics sector, driven by rising demand for electronics components and devices, is pushing the growth of the methanol market. Methyl alcohol plays a vital role in the production of different electronic materials, such as printed circuit boards, semiconductors, and display screens. Moreover, the demand for the product is further increased by its role as a solvent in the production process of electronic items.
Restraints:Methyl alcohol is primarily utilized as a solvent, alternative fuel, and pesticide. In addition to being produced commercially, it can be found naturally in foods, fruits, and the human body. Consuming contaminated alcohol may lead to poisoning from the product. Breathing in or ingesting it may result in loss of vision, buildup of acid in the blood, and fatality. Additional health consequences as a result of exposure consist of nausea, vomiting, heart and respiratory failure, seizures, and kidney failure. These factors are anticipated to impede the expansion of the methyl alcohol market.
Opportunities:Bunkering in marine settings is easy with methanol since it remains in liquid form at room temperature, eliminating the need for cryogenic storage or specialized materials in tanks and pipes. The rising demand for environmentally-friendly fuels and changes in regulations are becoming more influential in promoting new uses for methanol as a marine fuel because of its reduced emissions.
Methanol Market Segment Analysis
Methanol market is segmented based on feedstock, derivative, sub-derivative, end user and region.
By feedstock the market is segmented into coal, natural gas, and others. Over the projection period, the natural gas segment will command a large market share. This market sector is anticipated to expand because to the low cost of production that results in a considerable output. Together with an increase in the use of coal to generate methyl alcohol in many nations with substantial coal output, the coal section is also anticipated to pass the end of the line successfully.
By derivative the market is segmented into gasoline, MTO/MTP, formaldehyde, methyl tertiary butyl ether, acetic acid, dimethyl ether, methyl methacrylate, biodiesel, others. Throughout the projected period, it is anticipated that the MTO/MTP category will increase at the fastest rate. These thermoplastics—polypropylene, polyolefins, and polyethylene—are made from methyl alcohol and are widely used in a variety of sectors of the economy.
Due to their adaptability and advantageous characteristics, plastics are utilised more than other materials in the construction, furnishing, and automobile industries. Polyolefins are increasingly in demand across a wide range of end user industries. We will also have a bigger volume share for the formaldehyde category. It is crucial for the production of adhesives, insecticides, and molding materials. In various industries, formaldehyde is in high demand. The expansion of the formaldehyde market is being driven by the textile, construction, and mobile industries.
By sub-derivative the market is segmented into gasoline additives, olefins, UF/PF resins, VAM, polyacetals, MDI, PTA, acetate esters, acetic anhydride, fuels, and others. Regulations aiming at lowering car emissions and enhancing fuel efficiency are a big factor in the need for gasoline additives. Olefins market dynamics, price, and technological improvements all have an impact on the broader petrochemical industry, which is closely related to it.
Although these resins are used to create a range of wood-based products, the building and furniture industries dominate the market for UF/PF resins. The demand for adhesives, coatings, and other goods in the construction, automotive, and packaging industries is what drives the VAM market. Engineering plastics are in high demand in the consumer goods, electronics, and automotive sectors, which drives the market for polyacetals.
By end user the market is segmented into construction, automotive, electronics, appliances, paints & coatings, insulation, pharmaceuticals, packaging, solvents, others. Across the projection period, it is anticipated that the construction sector would account for the greatest market share in methanol. This is because methanol is used to make a wide range of goods, including foams, adhesives, plywood subfloors, and plastics. Large uses for these items exist in the construction sector, and rising demand is anticipated to drive up consumption. The increased usage of plastics and methanol-blend fuels is predicted to cause the automotive market to see significant growth by the end of the projection period.
[caption id="attachment_18370" align="aligncenter" width="1920"]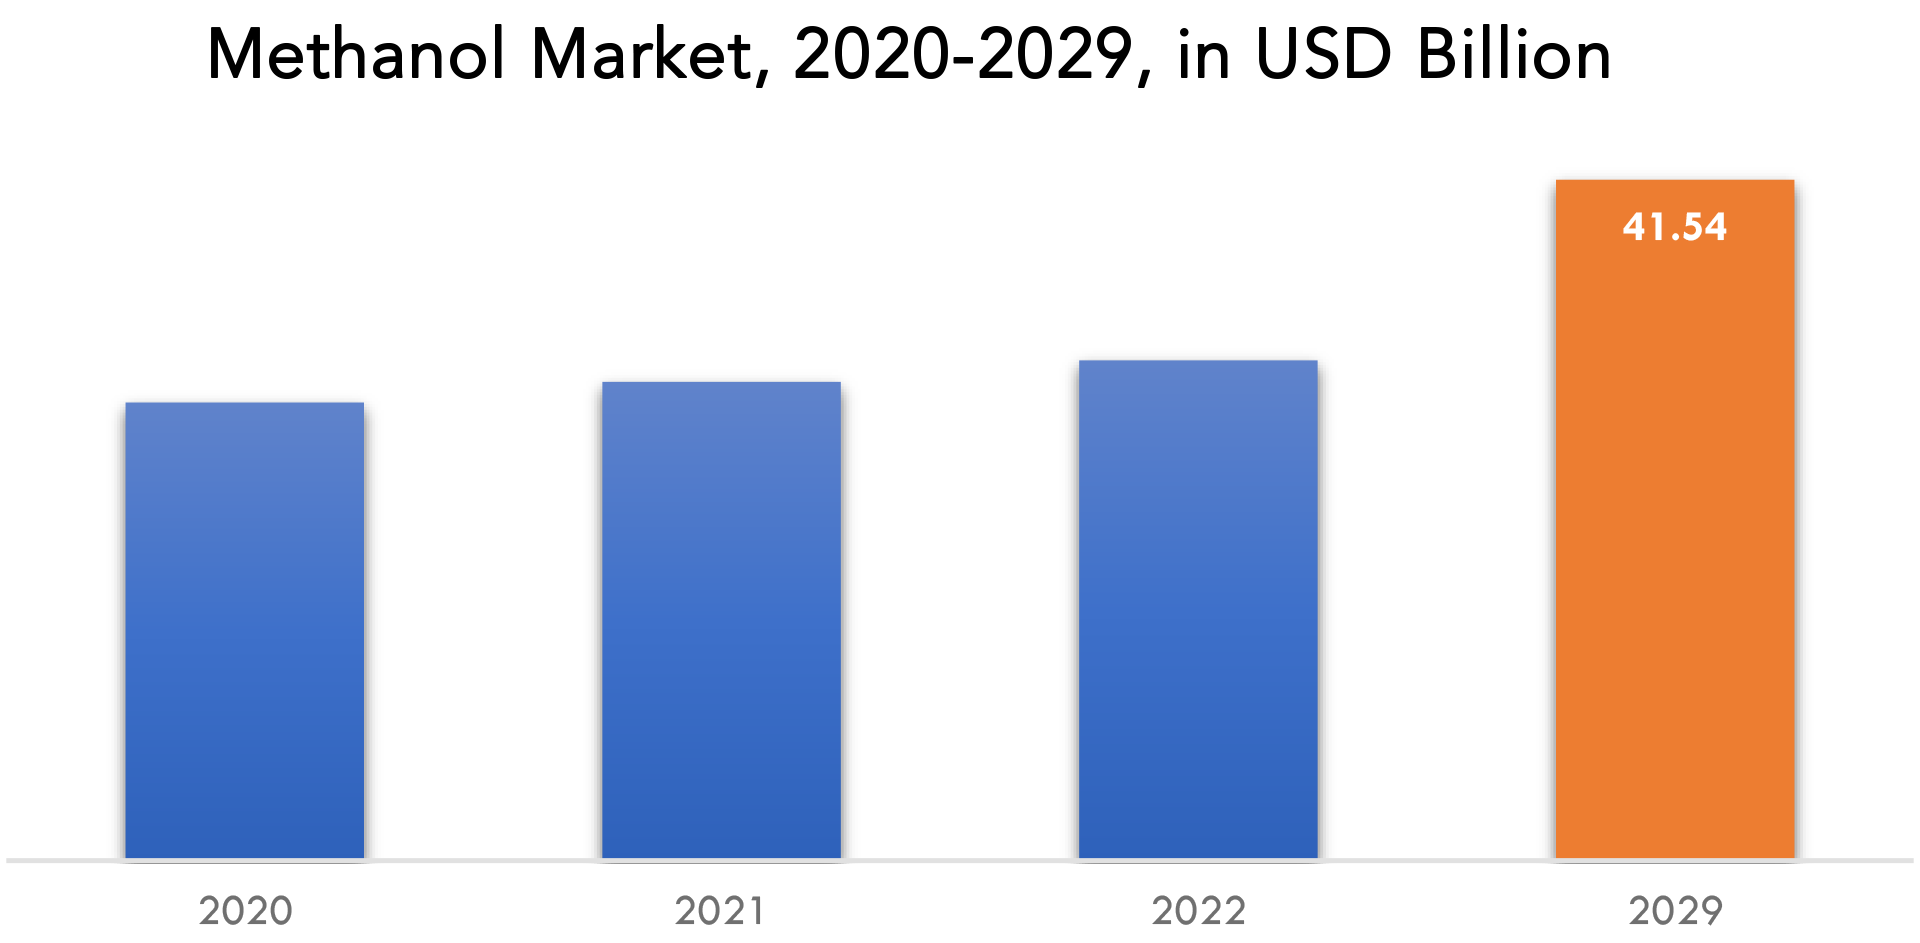
Methanol Market Key Players
Methanol market key players include Celanese Corporation, BASF SE, Methanex Corporation, SABIC, Petroliam Nasional Berhad (PETRONAS), Mitsubishi Gas Chemical Company, Inc., Valero, Mitsui & Co., Ltd., Methanol Holdings (Trinidad) Limited., Zagros Petrochemical Co.
Industry Development:January 2024 – Celanese Corporation announced, that Fairyway Methanol company, a joint venture between the company and Mitsui & Co., has began carbon capture and utilization at its plant located in Clear Lake, Texas. The plant is producing 130,000 metric tons of methanol from 180,000 metric tons of the greenhouse gas carbon dioxide per year.
March 01, 2023: Celanese Corporation, a global specialty materials and chemical company, and Alessa Therapeutics announced their collaboration for developing a new oncology drug product leveraging Alessa’s expertise on sustained localized drug delivery and the Celanese VitalDose® EVA drug delivery platform.
December 02, 2022: Methanex Corporation, the world’s largest producer and supplier of methanol, is pleased to announced it has made a NZ USD 2 million investment to support the building of the new neonatal unit at Taranaki Base Hospital in New Zealand. The 10-year partnership provides funding for state-of-the-art treatment to care for the most vulnerable newborns and their families. As part of this investment, the new unit will be called The Methanex Neonatal Unit and is expected to be completed in 2025.
Who Should Buy? Or Key Stakeholders
- Methanol producers
- Methanol distributors and traders
- Financial institutions
- Investors
- Manufacturing companies
- Raw Material Suppliers
- End Users
- Government & Regional Agencies
- Research Organizations
- Others
Methanol Market Regional Analysis
Methanol market by region includes North America, Asia-Pacific (APAC), Europe, South America, and Middle East & Africa (MEA).
- North America: includes the US, Canada, Mexico
- Asia Pacific: includes China, Japan, South Korea, India, Australia, ASEAN and Rest of APAC
- Europe: includes UK, Germany, France, Italy, Spain, Russia, and Rest of Europe
- South America: includes Brazil, Argentina and Rest of South America
- Middle East & Africa: includes Turkey, UAE, Saudi Arabia, South Africa, and Rest of MEA
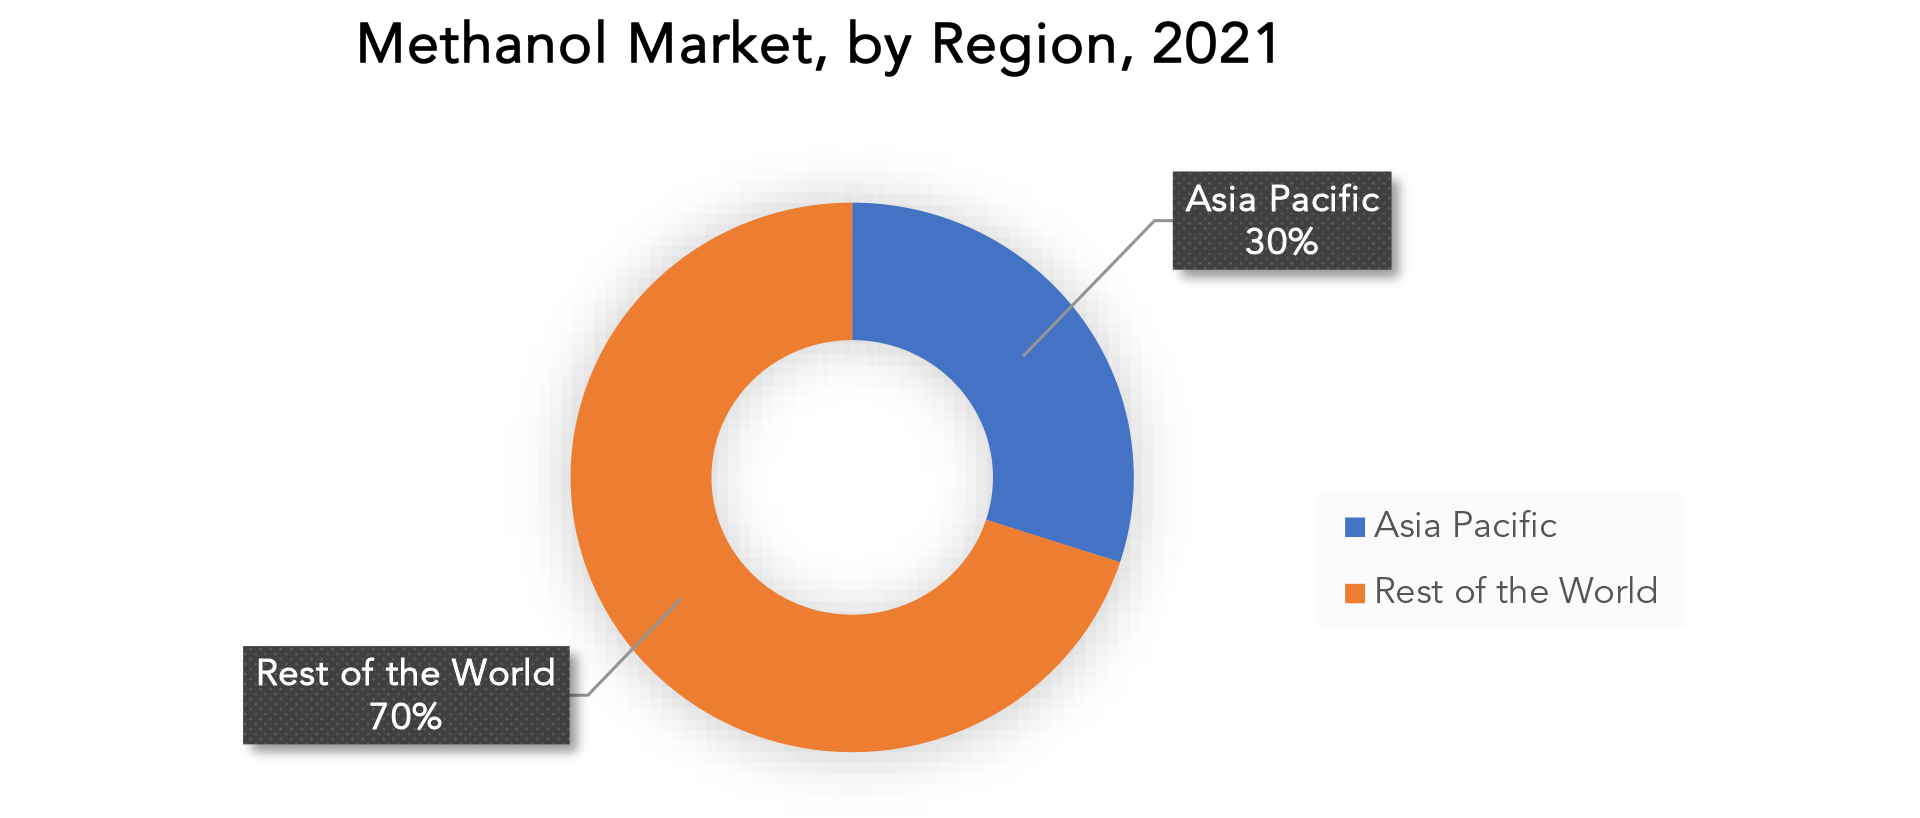
The market's growth is primarily attributed to the Asia Pacific region. The market is anticipated to expand along with the development of the building and automotive sectors in China and India. A significant contributor to the market's expansion is the fact that China is a significant producer and consumer of derivative. The Asia Pacific region has a sizable and expanding population, which is driving demand for a variety of chemical products used in consumer goods, electronics, construction, and other end-use industries.
As the economies of the region expand and consumer preferences change, this trend is anticipated to last for the foreseeable future. The demand for consumer goods and personal care products is being driven by the region's huge and expanding population as well as rising wages. Surfactants, polymers, and speciality chemicals are all experiencing growth as a result of this. The US is one of the top producers of chemicals in the world and the biggest in North America. The nation boasts a thriving chemical sector with a broad range of goods and uses. Due to regulatory pressure and consumer demand, the North American chemical sector is placing an increasing amount of emphasis on sustainability and environmental responsibility. This is encouraging more money to be spent on recycling, green chemistry, and other sustainable initiatives.
Key Market Segments: Methanol Market
Methanol Market By Feedstock, 2020-2029, (USD Billion, Kilotons)- Coal
- Natural Gas
- Others
- Gasoline
- MTO/MTP
- Formaldehyde
- Methyl Tertiary Butyl Ether
- Acetic Acid
- Dimethyl Ether
- Methyl Methacrylate
- Biodiesel
- Others
- Gasoline Additives
- Olefins
- UF/PF Resins
- VAM
- Polyacetals
- MDI
- PTA
- Acetate Esters
- Acetic Anhydride
- Fuels
- Others
- Construction
- Automotive
- Electronics
- Appliances
- Paints & Coatings
- Insulation
- Pharmaceuticals
- Packaging
- Solvents
- Others
- North America
- Asia Pacific
- Europe
- South America
- Middle East and Africa
Exactitude Consultancy Services Key Objectives:
- Increasing sales and market share
- Developing new technology
- Improving profitability
- Entering new markets
- Enhancing brand reputation
Key Question Answered
- What is the expected growth rate of the methanol market over the next 7 years?
- Who are the major players in the methanol market and what is their market share?
- What are the end-user industries driving demand for market and what is their outlook?
- What are the opportunities for growth in emerging markets such as Asia-Pacific, Middle East, and Africa?
- How is the economic environment affecting the methanol market, including factors such as interest rates, inflation, and exchange rates?
- What is the expected impact of government policies and regulations on the methanol market?
- What is the current and forecasted size and growth rate of the global methanol market?
- What are the key drivers of growth in the methanol market?
- Who are the major players in the market and what is their market share?
- What are the distribution channels and supply chain dynamics in the methanol market?
- What are the technological advancements and innovations in the methanol market and their impact on product development and growth?
- What are the regulatory considerations and their impact on the market?
- What are the challenges faced by players in the methanol market and how are they addressing these challenges?
- What are the opportunities for growth and expansion in the methanol market?
- What are the product offerings and specifications of leading players in the market?
- What is the pricing trend of methanol market in the market and what is the impact of raw material prices on the price trend?
- INTRODUZIONE
- DEFINIZIONE DI MERCATO
- SEGMENTAZIONE DEL MERCATO
- TEMPI DI RICERCA
- ASSUNZIONI E LIMITAZIONI
- METODOLOGIA DI RICERCA
- ESTRAZIONE DATI
- RICERCA SECONDARIA
- RICERCA PRIMARIA
- PARERI DEGLI ESPERTI IN MATERIA
- CONTROLLI DI QUALITÀ
- RECENSIONE FINALE
- TRIANGOLAZIONE DEI DATI
- APPROCCIO DAL BASSO VERSO L'ALTO
- APPROCCIO TOP-DOWN
- FLUSSO DI RICERCA
- FONTI DEI DATI
- ESTRAZIONE DATI
- SINTESI
- PANORAMICA DEL MERCATO
- PROSPETTIVE DEL MERCATO GLOBALE DEL METANOLO
- FATTORI DI MERCATO
- LIMITAZIONI DI MERCATO
- OPPORTUNITÀ DI MERCATO
- IMPATTO DEL COVID-19 SUL MERCATO DEL METANOLO
- MODELLO DELLE CINQUE FORZE DI PORTER
- MINACCIA DAI NUOVI ENTRANSI
- MINACCIA DA SOSTITUTI
- POTERE CONTRATTUALE DEI FORNITORI
- POTERE CONTRATTUALE DEI CLIENTI
- GRADO DI COMPETIZIONE
- ANALISI DELLA CATENA DEL VALORE DEL SETTORE
- PROSPETTIVE DEL MERCATO GLOBALE DEL METANOLO
- MERCATO GLOBALE DEL METANOLO PER MATERIE PRIME (MILIARDI DI USD, KILOTONI) , 2020-2029
- CARBONE
- GAS NATURALE
- ALTRI
- MERCATO GLOBALE DEL METANOLO PER DERIVATO (MILIARDI DI USD, KILOTONI), 2020-2029
- BENZINA
- MTO/MTP
- FORMALDEIDE
- ETERE TERZIARIO-BUTILICO METILE
- ACIDO ACETICO
- ETERE DIMETILICO
- METACRILATO DI METILE
- BIODIESEL
- ALTRI
- MERCATO GLOBALE DEL METANOLO PER SOTTODERIVATO (MILIARDI DI USD, KILOTONI), 2020-2029
- ADDITIVI PER BENZINA
- OLEFINE
- RESINE UF/PF
- VAM
- POLIACETALI
- MDI
- Genitori-insegnanti
- ESTERI ACETATI
- ANIDRIDE ACETICA
- CARBURANTI
- ALTRI
- GLOBAL METHANOL MARKET BY END USER (USD BILLION, KILOTONS), 2020-2029
- CONSTRUCTION
- AUTOMOTIVE
- ELECTRONICS
- APPLIANCES
- PAINTS & COATINGS
- INSULATION
- PHARMACEUTICALS
- PACKAGING
- SOLVENTS
- OTHERS
- GLOBAL METHANOL MARKET BY REGION (USD BILLION, KILOTONS), 2020-2029
- NORTH AMERICA
- US
- CANADA
- MEXICO
- SOUTH AMERICA
- BRAZIL
- ARGENTINA
- COLOMBIA
- REST OF SOUTH AMERICA
- EUROPE
- GERMANY
- UK
- FRANCE
- ITALY
- SPAIN
- RUSSIA
- REST OF EUROPE
- ASIA PACIFIC
- INDIA
- CHINA
- JAPAN
- SOUTH KOREA
- AUSTRALIA
- SOUTH-EAST ASIA
- REST OF ASIA PACIFIC
- MIDDLE EAST AND AFRICA
- UAE
- SAUDI ARABIA
- SOUTH AFRICA
- REST OF MIDDLE EAST AND AFRICA
- NORTH AMERICA
- COMPANY PROFILES* (BUSINESS OVERVIEW, COMPANY SNAPSHOT, PRODUCTS OFFERED, RECENT DEVELOPMENTS)
- CELANESE CORPORATION
- BASF SE
- METHANEX CORPORATION
- SABIC
- PETROLIAM NASIONAL BERHAD (PETRONAS)
- MITSUBISHI GAS CHEMICAL COMPANY, INC.
- VALERO
- MITSUI & CO., LTD.
- METHANOL HOLDINGS (TRINIDAD) LIMITED.
- ZAGROS PETROCHEMICAL CO. *THE COMPANY LIST IS INDICATIVE
LIST OF TABLES
TABLE 1 GLOBAL METHANOL MARKET BY FEEDSTOCK (USD BILLION) 2020-2029
TABLE 2 GLOBAL METHANOL MARKET BY FEEDSTOCK (KILOTONS) 2020-2029
TABLE 3 GLOBAL METHANOL MARKET BY DERIVATIVE (USD MILLIONS) 2020-2029
TABLE 4 GLOBAL METHANOL MARKET BY DERIVATIVE (KILOTONS) 2020-2029
TABLE 5 GLOBAL METHANOL MARKET BY SUB-DERIVATIVE (USD BILLION) 2020-2029
TABLE 6 GLOBAL METHANOL MARKET BY SUB-DERIVATIVE (KILOTONS) 2020-2029
TABLE 7 GLOBAL METHANOL MARKET BY END USER (USD MILLIONS) 2020-2029
TABLE 8 GLOBAL METHANOL MARKET BY END USER (KILOTONS) 2020-2029
TABLE 9 GLOBAL METHANOL MARKET BY REGION (USD BILLION) 2020-2029
TABLE 10 GLOBAL METHANOL MARKET BY REGION (KILOTONS) 2020-2029
TABLE 11 NORTH AMERICA METHANOL MARKET BY COUNTRY (USD BILLION) 2020-2029
TABLE 12 NORTH AMERICA METHANOL MARKET BY COUNTRY (KILOTONS) 2020-2029
TABLE 13 NORTH AMERICA METHANOL MARKET BY FEEDSTOCK (USD BILLION) 2020-2029
TABLE 14 NORTH AMERICA METHANOL MARKET BY FEEDSTOCK (KILOTONS) 2020-2029
TABLE 15 NORTH AMERICA METHANOL MARKET BY DERIVATIVE (USD MILLIONS) 2020-2029
TABLE 16 NORTH AMERICA METHANOL MARKET BY DERIVATIVE (KILOTONS) 2020-2029
TABLE 17 NORTH AMERICA METHANOL MARKET BY SUB-DERIVATIVE (USD BILLION) 2020-2029
TABLE 18 NORTH AMERICA METHANOL MARKET BY SUB-DERIVATIVE (KILOTONS) 2020-2029
TABLE 19 NORTH AMERICA METHANOL MARKET BY END USER (USD MILLIONS) 2020-2029
TABLE 20 NORTH AMERICA METHANOL MARKET BY END USER (KILOTONS) 2020-2029
TABLE 21 US METHANOL MARKET BY FEEDSTOCK (USD BILLION) 2020-2029
TABLE 22 US METHANOL MARKET BY FEEDSTOCK (KILOTONS) 2020-2029
TABLE 23 US METHANOL MARKET BY DERIVATIVE (USD MILLIONS) 2020-2029
TABLE 24 US METHANOL MARKET BY DERIVATIVE (KILOTONS) 2020-2029
TABLE 25 US METHANOL MARKET BY SUB-DERIVATIVE (USD BILLION) 2020-2029
TABLE 26 US METHANOL MARKET BY SUB-DERIVATIVE (KILOTONS) 2020-2029
TABLE 27 US METHANOL MARKET BY END USER (USD MILLIONS) 2020-2029
TABLE 28 US METHANOL MARKET BY END USER (KILOTONS) 2020-2029
TABLE 29 CANADA METHANOL MARKET BY FEEDSTOCK (USD BILLION) 2020-2029
TABLE 30 CANADA METHANOL MARKET BY FEEDSTOCK (KILOTONS) 2020-2029
TABLE 31 CANADA METHANOL MARKET BY DERIVATIVE (USD MILLIONS) 2020-2029
TABLE 32 CANADA METHANOL MARKET BY DERIVATIVE (KILOTONS) 2020-2029
TABLE 33 CANADA METHANOL MARKET BY SUB-DERIVATIVE (USD BILLION) 2020-2029
TABLE 34 CANADA METHANOL MARKET BY SUB-DERIVATIVE (KILOTONS) 2020-2029
TABLE 35 CANADA METHANOL MARKET BY END USER (USD MILLIONS) 2020-2029
TABLE 36 CANADA METHANOL MARKET BY END USER (KILOTONS) 2020-2029
TABLE 37 MEXICO METHANOL MARKET BY FEEDSTOCK (USD BILLION) 2020-2029
TABLE 38 MEXICO METHANOL MARKET BY FEEDSTOCK (KILOTONS) 2020-2029
TABLE 39 MEXICO METHANOL MARKET BY DERIVATIVE (USD MILLIONS) 2020-2029
TABLE 40 MEXICO METHANOL MARKET BY DERIVATIVE (KILOTONS) 2020-2029
TABLE 41 MEXICO METHANOL MARKET BY SUB-DERIVATIVE (USD BILLION) 2020-2029
TABLE 42 MEXICO METHANOL MARKET BY SUB-DERIVATIVE (KILOTONS) 2020-2029
TABLE 43 MEXICO METHANOL MARKET BY END USER (USD MILLIONS) 2020-2029
TABLE 44 MEXICO METHANOL MARKET BY END USER (KILOTONS) 2020-2029
TABLE 45 SOUTH AMERICA METHANOL MARKET BY COUNTRY (USD BILLION) 2020-2029
TABLE 46 SOUTH AMERICA METHANOL MARKET BY COUNTRY (KILOTONS) 2020-2029
TABLE 47 SOUTH AMERICA METHANOL MARKET BY FEEDSTOCK (USD BILLION) 2020-2029
TABLE 48 SOUTH AMERICA METHANOL MARKET BY FEEDSTOCK (KILOTONS) 2020-2029
TABLE 49 SOUTH AMERICA METHANOL MARKET BY DERIVATIVE (USD MILLIONS) 2020-2029
TABLE 50 SOUTH AMERICA METHANOL MARKET BY DERIVATIVE (KILOTONS) 2020-2029
TABLE 51 SOUTH AMERICA METHANOL MARKET BY SUB-DERIVATIVE (USD BILLION) 2020-2029
TABLE 52 SOUTH AMERICA METHANOL MARKET BY SUB-DERIVATIVE (KILOTONS) 2020-2029
TABLE 53 SOUTH AMERICA METHANOL MARKET BY END USER (USD MILLIONS) 2020-2029
TABLE 54 SOUTH AMERICA METHANOL MARKET BY END USER (KILOTONS) 2020-2029
TABLE 55 BRAZIL METHANOL MARKET BY FEEDSTOCK (USD BILLION) 2020-2029
TABLE 56 BRAZIL METHANOL MARKET BY FEEDSTOCK (KILOTONS) 2020-2029
TABLE 57 BRAZIL METHANOL MARKET BY DERIVATIVE (USD MILLIONS) 2020-2029
TABLE 58 BRAZIL METHANOL MARKET BY DERIVATIVE (KILOTONS) 2020-2029
TABLE 59 BRAZIL METHANOL MARKET BY SUB-DERIVATIVE (USD BILLION) 2020-2029
TABLE 60 BRAZIL METHANOL MARKET BY SUB-DERIVATIVE (KILOTONS) 2020-2029
TABLE 61 BRAZIL METHANOL MARKET BY END USER (USD MILLIONS) 2020-2029
TABLE 62 BRAZIL METHANOL MARKET BY END USER (KILOTONS) 2020-2029
TABLE 63 ARGENTINA METHANOL MARKET BY FEEDSTOCK (USD BILLION) 2020-2029
TABLE 64 ARGENTINA METHANOL MARKET BY FEEDSTOCK (KILOTONS) 2020-2029
TABLE 65 ARGENTINA METHANOL MARKET BY DERIVATIVE (USD MILLIONS) 2020-2029
TABLE 66 ARGENTINA METHANOL MARKET BY DERIVATIVE (KILOTONS) 2020-2029
TABLE 67 ARGENTINA METHANOL MARKET BY SUB-DERIVATIVE (USD BILLION) 2020-2029
TABLE 68 ARGENTINA METHANOL MARKET BY SUB-DERIVATIVE (KILOTONS) 2020-2029
TABLE 69 ARGENTINA METHANOL MARKET BY END USER (USD MILLIONS) 2020-2029
TABLE 70 ARGENTINA METHANOL MARKET BY END USER (KILOTONS) 2020-2029
TABLE 71 COLOMBIA METHANOL MARKET BY FEEDSTOCK (USD BILLION) 2020-2029
TABLE 72 COLOMBIA METHANOL MARKET BY FEEDSTOCK (KILOTONS) 2020-2029
TABLE 73 COLOMBIA METHANOL MARKET BY DERIVATIVE (USD MILLIONS) 2020-2029
TABLE 74 COLOMBIA METHANOL MARKET BY DERIVATIVE (KILOTONS) 2020-2029
TABLE 75 COLOMBIA METHANOL MARKET BY SUB-DERIVATIVE (USD BILLION) 2020-2029
TABLE 76 COLOMBIA METHANOL MARKET BY SUB-DERIVATIVE (KILOTONS) 2020-2029
TABLE 77 COLOMBIA METHANOL MARKET BY END USER (USD MILLIONS) 2020-2029
TABLE 78 COLOMBIA METHANOL MARKET BY END USER (KILOTONS) 2020-2029
TABLE 79 REST OF SOUTH AMERICA METHANOL MARKET BY FEEDSTOCK (USD BILLION) 2020-2029
TABLE 80 REST OF SOUTH AMERICA METHANOL MARKET BY FEEDSTOCK (KILOTONS) 2020-2029
TABLE 81 REST OF SOUTH AMERICA METHANOL MARKET BY DERIVATIVE (USD MILLIONS) 2020-2029
TABLE 82 REST OF SOUTH AMERICA METHANOL MARKET BY DERIVATIVE (KILOTONS) 2020-2029
TABLE 83 REST OF SOUTH AMERICA METHANOL MARKET BY SUB-DERIVATIVE (USD BILLION) 2020-2029
TABLE 84 REST OF SOUTH AMERICA METHANOL MARKET BY SUB-DERIVATIVE (KILOTONS) 2020-2029
TABLE 85 REST OF SOUTH AMERICA METHANOL MARKET BY END USER (USD MILLIONS) 2020-2029
TABLE 86 REST OF SOUTH AMERICA METHANOL MARKET BY END USER (KILOTONS) 2020-2029
TABLE 87 ASIA-PACIFIC METHANOL MARKET BY COUNTRY (USD BILLION) 2020-2029
TABLE 88 ASIA-PACIFIC METHANOL MARKET BY COUNTRY (KILOTONS) 2020-2029
TABLE 89 ASIA-PACIFIC METHANOL MARKET BY FEEDSTOCK (USD BILLION) 2020-2029
TABLE 90 ASIA-PACIFIC METHANOL MARKET BY FEEDSTOCK (KILOTONS) 2020-2029
TABLE 91 ASIA-PACIFIC METHANOL MARKET BY DERIVATIVE (USD MILLIONS) 2020-2029
TABLE 92 ASIA-PACIFIC METHANOL MARKET BY DERIVATIVE (KILOTONS) 2020-2029
TABLE 93 ASIA-PACIFIC METHANOL MARKET BY SUB-DERIVATIVE (USD BILLION) 2020-2029
TABLE 94 ASIA-PACIFIC METHANOL MARKET BY SUB-DERIVATIVE (KILOTONS) 2020-2029
TABLE 95 ASIA-PACIFIC METHANOL MARKET BY END USER (USD MILLIONS) 2020-2029
TABLE 96 ASIA-PACIFIC METHANOL MARKET BY END USER (KILOTONS) 2020-2029
TABLE 97 INDIA METHANOL MARKET BY FEEDSTOCK (USD BILLION) 2020-2029
TABLE 98 INDIA METHANOL MARKET BY FEEDSTOCK (KILOTONS) 2020-2029
TABLE 99 INDIA METHANOL MARKET BY DERIVATIVE (USD MILLIONS) 2020-2029
TABLE 100 INDIA METHANOL MARKET BY DERIVATIVE (KILOTONS) 2020-2029
TABLE 101 INDIA METHANOL MARKET BY SUB-DERIVATIVE (USD BILLION) 2020-2029
TABLE 102 INDIA METHANOL MARKET BY SUB-DERIVATIVE (KILOTONS) 2020-2029
TABLE 103 INDIA METHANOL MARKET BY END USER (USD MILLIONS) 2020-2029
TABLE 104 INDIA METHANOL MARKET BY END USER (KILOTONS) 2020-2029
TABLE 105 CHINA METHANOL MARKET BY FEEDSTOCK (USD BILLION) 2020-2029
TABLE 106 CHINA METHANOL MARKET BY FEEDSTOCK (KILOTONS) 2020-2029
TABLE 107 CHINA METHANOL MARKET BY DERIVATIVE (USD MILLIONS) 2020-2029
TABLE 108 CHINA METHANOL MARKET BY DERIVATIVE (KILOTONS) 2020-2029
TABLE 109 CHINA METHANOL MARKET BY SUB-DERIVATIVE (USD BILLION) 2020-2029
TABLE 110 CHINA METHANOL MARKET BY SUB-DERIVATIVE (KILOTONS) 2020-2029
TABLE 111 CHINA METHANOL MARKET BY END USER (USD MILLIONS) 2020-2029
TABLE 112 CHINA METHANOL MARKET BY END USER (KILOTONS) 2020-2029
TABLE 113 JAPAN METHANOL MARKET BY FEEDSTOCK (USD BILLION) 2020-2029
TABLE 114 JAPAN METHANOL MARKET BY FEEDSTOCK (KILOTONS) 2020-2029
TABLE 115 JAPAN METHANOL MARKET BY DERIVATIVE (USD MILLIONS) 2020-2029
TABLE 116 JAPAN METHANOL MARKET BY DERIVATIVE (KILOTONS) 2020-2029
TABLE 117 JAPAN METHANOL MARKET BY SUB-DERIVATIVE (USD BILLION) 2020-2029
TABLE 118 JAPAN METHANOL MARKET BY SUB-DERIVATIVE (KILOTONS) 2020-2029
TABLE 119 JAPAN METHANOL MARKET BY END USER (USD MILLIONS) 2020-2029
TABLE 120 JAPAN METHANOL MARKET BY END USER (KILOTONS) 2020-2029
TABLE 121 SOUTH KOREA METHANOL MARKET BY FEEDSTOCK (USD BILLION) 2020-2029
TABLE 122 SOUTH KOREA METHANOL MARKET BY FEEDSTOCK (KILOTONS) 2020-2029
TABLE 123 SOUTH KOREA METHANOL MARKET BY DERIVATIVE (USD MILLIONS) 2020-2029
TABLE 124 SOUTH KOREA METHANOL MARKET BY DERIVATIVE (KILOTONS) 2020-2029
TABLE 125 SOUTH KOREA METHANOL MARKET BY SUB-DERIVATIVE (USD BILLION) 2020-2029
TABLE 126 SOUTH KOREA METHANOL MARKET BY SUB-DERIVATIVE (KILOTONS) 2020-2029
TABLE 127 SOUTH KOREA METHANOL MARKET BY END USER (USD MILLIONS) 2020-2029
TABLE 128 SOUTH KOREA METHANOL MARKET BY END USER (KILOTONS) 2020-2029
TABLE 129 AUSTRALIA METHANOL MARKET BY FEEDSTOCK (USD BILLION) 2020-2029
TABLE 130 AUSTRALIA METHANOL MARKET BY FEEDSTOCK (KILOTONS) 2020-2029
TABLE 131 AUSTRALIA METHANOL MARKET BY DERIVATIVE (USD MILLIONS) 2020-2029
TABLE 132 AUSTRALIA METHANOL MARKET BY DERIVATIVE (KILOTONS) 2020-2029
TABLE 133 AUSTRALIA METHANOL MARKET BY SUB-DERIVATIVE (USD BILLION) 2020-2029
TABLE 134 AUSTRALIA METHANOL MARKET BY SUB-DERIVATIVE (KILOTONS) 2020-2029
TABLE 135 AUSTRALIA METHANOL MARKET BY END USER (USD MILLIONS) 2020-2029
TABLE 136 AUSTRALIA METHANOL MARKET BY END USER (KILOTONS) 2020-2029
TABLE 137 SOUTH-EAST ASIA METHANOL MARKET BY FEEDSTOCK (USD BILLION) 2020-2029
TABLE 138 SOUTH-EAST ASIA METHANOL MARKET BY FEEDSTOCK (KILOTONS) 2020-2029
TABLE 139 SOUTH-EAST ASIA METHANOL MARKET BY DERIVATIVE (USD MILLIONS) 2020-2029
TABLE 140 SOUTH-EAST ASIA METHANOL MARKET BY DERIVATIVE (KILOTONS) 2020-2029
TABLE 141 SOUTH-EAST ASIA METHANOL MARKET BY SUB-DERIVATIVE (USD BILLION) 2020-2029
TABLE 142 SOUTH-EAST ASIA METHANOL MARKET BY SUB-DERIVATIVE (KILOTONS) 2020-2029
TABLE 143 SOUTH-EAST ASIA METHANOL MARKET BY END USER (USD MILLIONS) 2020-2029
TABLE 144 SOUTH-EAST ASIA METHANOL MARKET BY END USER (KILOTONS) 2020-2029
TABLE 145 REST OF ASIA PACIFIC METHANOL MARKET BY FEEDSTOCK (USD BILLION) 2020-2029
TABLE 146 REST OF ASIA PACIFIC METHANOL MARKET BY FEEDSTOCK (KILOTONS) 2020-2029
TABLE 147 REST OF ASIA PACIFIC METHANOL MARKET BY DERIVATIVE (USD MILLIONS) 2020-2029
TABLE 148 REST OF ASIA PACIFIC METHANOL MARKET BY DERIVATIVE (KILOTONS) 2020-2029
TABLE 149 REST OF ASIA PACIFIC METHANOL MARKET BY SUB-DERIVATIVE (USD BILLION) 2020-2029
TABLE 150 REST OF ASIA PACIFIC METHANOL MARKET BY SUB-DERIVATIVE (KILOTONS) 2020-2029
TABLE 151 REST OF ASIA PACIFIC METHANOL MARKET BY END USER (USD MILLIONS) 2020-2029
TABLE 152 REST OF ASIA PACIFIC METHANOL MARKET BY END USER (KILOTONS) 2020-2029
TABLE 153 EUROPE METHANOL MARKET BY COUNTRY (USD BILLION) 2020-2029
TABLE 154 EUROPE METHANOL MARKET BY COUNTRY (KILOTONS) 2020-2029
TABLE 155 EUROPE METHANOL MARKET BY FEEDSTOCK (USD BILLION) 2020-2029
TABLE 156 EUROPE METHANOL MARKET BY FEEDSTOCK (KILOTONS) 2020-2029
TABLE 157 EUROPE METHANOL MARKET BY DERIVATIVE (USD MILLIONS) 2020-2029
TABLE 158 EUROPE METHANOL MARKET BY DERIVATIVE (KILOTONS) 2020-2029
TABLE 159 EUROPE METHANOL MARKET BY SUB-DERIVATIVE (USD BILLION) 2020-2029
TABLE 160 EUROPE METHANOL MARKET BY SUB-DERIVATIVE (KILOTONS) 2020-2029
TABLE 161 EUROPE METHANOL MARKET BY END USER (USD MILLIONS) 2020-2029
TABLE 162 EUROPE METHANOL MARKET BY END USER (KILOTONS) 2020-2029
TABLE 163 GERMANY METHANOL MARKET BY FEEDSTOCK (USD BILLION) 2020-2029
TABLE 164 GERMANY METHANOL MARKET BY FEEDSTOCK (KILOTONS) 2020-2029
TABLE 165 GERMANY METHANOL MARKET BY DERIVATIVE (USD MILLIONS) 2020-2029
TABLE 166 GERMANY METHANOL MARKET BY DERIVATIVE (KILOTONS) 2020-2029
TABLE 167 GERMANY METHANOL MARKET BY SUB-DERIVATIVE (USD BILLION) 2020-2029
TABLE 168 GERMANY METHANOL MARKET BY SUB-DERIVATIVE (KILOTONS) 2020-2029
TABLE 169 GERMANY METHANOL MARKET BY END USER (USD MILLIONS) 2020-2029
TABLE 170 GERMANY METHANOL MARKET BY END USER (KILOTONS) 2020-2029
TABLE 171 UK METHANOL MARKET BY FEEDSTOCK (USD BILLION) 2020-2029
TABLE 172 UK METHANOL MARKET BY FEEDSTOCK (KILOTONS) 2020-2029
TABLE 173 UK METHANOL MARKET BY DERIVATIVE (USD MILLIONS) 2020-2029
TABLE 174 UK METHANOL MARKET BY DERIVATIVE (KILOTONS) 2020-2029
TABLE 175 UK METHANOL MARKET BY SUB-DERIVATIVE (USD BILLION) 2020-2029
TABLE 176 UK METHANOL MARKET BY SUB-DERIVATIVE (KILOTONS) 2020-2029
TABLE 177 UK METHANOL MARKET BY END USER (USD MILLIONS) 2020-2029
TABLE 178 UK METHANOL MARKET BY END USER (KILOTONS) 2020-2029
TABLE 179 FRANCE METHANOL MARKET BY FEEDSTOCK (USD BILLION) 2020-2029
TABLE 180 FRANCE METHANOL MARKET BY FEEDSTOCK (KILOTONS) 2020-2029
TABLE 181 FRANCE METHANOL MARKET BY DERIVATIVE (USD MILLIONS) 2020-2029
TABLE 182 FRANCE METHANOL MARKET BY DERIVATIVE (KILOTONS) 2020-2029
TABLE 183 FRANCE METHANOL MARKET BY SUB-DERIVATIVE (USD BILLION) 2020-2029
TABLE 184 FRANCE METHANOL MARKET BY SUB-DERIVATIVE (KILOTONS) 2020-2029
TABLE 185 FRANCE METHANOL MARKET BY END USER (USD MILLIONS) 2020-2029
TABLE 186 FRANCE METHANOL MARKET BY END USER (KILOTONS) 2020-2029
TABLE 187 ITALY METHANOL MARKET BY FEEDSTOCK (USD BILLION) 2020-2029
TABLE 188 ITALY METHANOL MARKET BY FEEDSTOCK (KILOTONS) 2020-2029
TABLE 189 ITALY METHANOL MARKET BY DERIVATIVE (USD MILLIONS) 2020-2029
TABLE 190 ITALY METHANOL MARKET BY DERIVATIVE (KILOTONS) 2020-2029
TABLE 191 ITALY METHANOL MARKET BY SUB-DERIVATIVE (USD BILLION) 2020-2029
TABLE 192 ITALY METHANOL MARKET BY SUB-DERIVATIVE (KILOTONS) 2020-2029
TABLE 193 ITALY METHANOL MARKET BY END USER (USD MILLIONS) 2020-2029
TABLE 194 ITALY METHANOL MARKET BY END USER (KILOTONS) 2020-2029
TABLE 195 SPAIN METHANOL MARKET BY FEEDSTOCK (USD BILLION) 2020-2029
TABLE 196 SPAIN METHANOL MARKET BY FEEDSTOCK (KILOTONS) 2020-2029
TABLE 197 SPAIN METHANOL MARKET BY DERIVATIVE (USD MILLIONS) 2020-2029
TABLE 198 SPAIN METHANOL MARKET BY DERIVATIVE (KILOTONS) 2020-2029
TABLE 199 SPAIN METHANOL MARKET BY SUB-DERIVATIVE (USD BILLION) 2020-2029
TABLE 200 SPAIN METHANOL MARKET BY SUB-DERIVATIVE (KILOTONS) 2020-2029
TABLE 201 SPAIN METHANOL MARKET BY END USER (USD MILLIONS) 2020-2029
TABLE 202 SPAIN METHANOL MARKET BY END USER (KILOTONS) 2020-2029
TABLE 203 RUSSIA METHANOL MARKET BY FEEDSTOCK (USD BILLION) 2020-2029
TABLE 204 RUSSIA METHANOL MARKET BY FEEDSTOCK (KILOTONS) 2020-2029
TABLE 205 RUSSIA METHANOL MARKET BY DERIVATIVE (USD MILLIONS) 2020-2029
TABLE 206 RUSSIA METHANOL MARKET BY DERIVATIVE (KILOTONS) 2020-2029
TABLE 207 RUSSIA METHANOL MARKET BY SUB-DERIVATIVE (USD BILLION) 2020-2029
TABLE 208 RUSSIA METHANOL MARKET BY SUB-DERIVATIVE (KILOTONS) 2020-2029
TABLE 209 RUSSIA METHANOL MARKET BY END USER (USD MILLIONS) 2020-2029
TABLE 210 RUSSIA METHANOL MARKET BY END USER (KILOTONS) 2020-2029
TABLE 211 REST OF EUROPE METHANOL MARKET BY FEEDSTOCK (USD BILLION) 2020-2029
TABLE 212 REST OF EUROPE METHANOL MARKET BY FEEDSTOCK (KILOTONS) 2020-2029
TABLE 213 REST OF EUROPE METHANOL MARKET BY DERIVATIVE (USD MILLIONS) 2020-2029
TABLE 214 REST OF EUROPE METHANOL MARKET BY DERIVATIVE (KILOTONS) 2020-2029
TABLE 215 REST OF EUROPE METHANOL MARKET BY SUB-DERIVATIVE (USD BILLION) 2020-2029
TABLE 216 REST OF EUROPE METHANOL MARKET BY SUB-DERIVATIVE (KILOTONS) 2020-2029
TABLE 217 REST OF EUROPE METHANOL MARKET BY END USER (USD MILLIONS) 2020-2029
TABLE 218 REST OF EUROPE METHANOL MARKET BY END USER (KILOTONS) 2020-2029
TABLE 219 MIDDLE EAST AND AFRICA METHANOL MARKET BY COUNTRY (USD BILLION) 2020-2029
TABLE 220 MIDDLE EAST AND AFRICA METHANOL MARKET BY COUNTRY (KILOTONS) 2020-2029
TABLE 221 MIDDLE EAST AND AFRICA METHANOL MARKET BY FEEDSTOCK (USD BILLION) 2020-2029
TABLE 222 MIDDLE EAST AND AFRICA METHANOL MARKET BY FEEDSTOCK (KILOTONS) 2020-2029
TABLE 223 MIDDLE EAST AND AFRICA METHANOL MARKET BY DERIVATIVE (USD MILLIONS) 2020-2029
TABLE 224 MIDDLE EAST AND AFRICA METHANOL MARKET BY DERIVATIVE (KILOTONS) 2020-2029
TABLE 225 MIDDLE EAST AND AFRICA METHANOL MARKET BY SUB-DERIVATIVE (USD BILLION) 2020-2029
TABLE 226 MIDDLE EAST AND AFRICA METHANOL MARKET BY SUB-DERIVATIVE (KILOTONS) 2020-2029
TABLE 227 MIDDLE EAST AND AFRICA METHANOL MARKET BY END USER (USD MILLIONS) 2020-2029
TABLE 228 MIDDLE EAST AND AFRICA METHANOL MARKET BY END USER (KILOTONS) 2020-2029
TABLE 229 UAE METHANOL MARKET BY FEEDSTOCK (USD BILLION) 2020-2029
TABLE 230 UAE METHANOL MARKET BY FEEDSTOCK (KILOTONS) 2020-2029
TABLE 231 UAE METHANOL MARKET BY DERIVATIVE (USD MILLIONS) 2020-2029
TABLE 232 UAE METHANOL MARKET BY DERIVATIVE (KILOTONS) 2020-2029
TABLE 233 UAE METHANOL MARKET BY SUB-DERIVATIVE (USD BILLION) 2020-2029
TABLE 234 UAE METHANOL MARKET BY SUB-DERIVATIVE (KILOTONS) 2020-2029
TABLE 235 UAE METHANOL MARKET BY END USER (USD MILLIONS) 2020-2029
TABLE 236 UAE METHANOL MARKET BY END USER (KILOTONS) 2020-2029
TABLE 237 SAUDI ARABIA METHANOL MARKET BY FEEDSTOCK (USD BILLION) 2020-2029
TABLE 238 SAUDI ARABIA METHANOL MARKET BY FEEDSTOCK (KILOTONS) 2020-2029
TABLE 239 SAUDI ARABIA METHANOL MARKET BY DERIVATIVE (USD MILLIONS) 2020-2029
TABLE 240 SAUDI ARABIA METHANOL MARKET BY DERIVATIVE (KILOTONS) 2020-2029
TABLE 241 SAUDI ARABIA METHANOL MARKET BY SUB-DERIVATIVE (USD BILLION) 2020-2029
TABLE 242 SAUDI ARABIA METHANOL MARKET BY SUB-DERIVATIVE (KILOTONS) 2020-2029
TABLE 243 SAUDI ARABIA METHANOL MARKET BY END USER (USD MILLIONS) 2020-2029
TABLE 244 SAUDI ARABIA METHANOL MARKET BY END USER (KILOTONS) 2020-2029
TABLE 245 SOUTH AFRICA METHANOL MARKET BY FEEDSTOCK (USD BILLION) 2020-2029
TABLE 246 SOUTH AFRICA METHANOL MARKET BY FEEDSTOCK (KILOTONS) 2020-2029
TABLE 247 SOUTH AFRICA METHANOL MARKET BY DERIVATIVE (USD MILLIONS) 2020-2029
TABLE 248 SOUTH AFRICA METHANOL MARKET BY DERIVATIVE (KILOTONS) 2020-2029
TABLE 249 SOUTH AFRICA METHANOL MARKET BY SUB-DERIVATIVE (USD BILLION) 2020-2029
TABLE 250 SOUTH AFRICA METHANOL MARKET BY SUB-DERIVATIVE (KILOTONS) 2020-2029
TABLE 251 SOUTH AFRICA METHANOL MARKET BY END USER (USD MILLIONS) 2020-2029
TABLE 252 SOUTH AFRICA METHANOL MARKET BY END USER (KILOTONS) 2020-2029
TABLE 253 REST OF MIDDLE EAST AND AFRICA METHANOL MARKET BY FEEDSTOCK (USD BILLION) 2020-2029
TABLE 254 REST OF MIDDLE EAST AND AFRICA METHANOL MARKET BY FEEDSTOCK (KILOTONS) 2020-2029
TABLE 255 REST OF MIDDLE EAST AND AFRICA METHANOL MARKET BY DERIVATIVE (USD MILLIONS) 2020-2029
TABLE 256 REST OF MIDDLE EAST AND AFRICA METHANOL MARKET BY DERIVATIVE (KILOTONS) 2020-2029
TABLE 257 REST OF MIDDLE EAST AND AFRICA METHANOL MARKET BY SUB-DERIVATIVE (USD BILLION) 2020-2029
TABLE 258 REST OF MIDDLE EAST AND AFRICA METHANOL MARKET BY SUB-DERIVATIVE (KILOTONS) 2020-2029
TABLE 259 REST OF MIDDLE EAST AND AFRICA METHANOL MARKET BY END USER (USD MILLIONS) 2020-2029
TABLE 260 REST OF MIDDLE EAST AND AFRICA METHANOL MARKET BY END USER (KILOTONS) 2020-2029
LIST OF FIGURES
FIGURE 1 MARKET DYNAMICS
FIGURE 2 MARKET SEGMENTATION
FIGURE 3 REPORT TIMELINES: YEARS CONSIDERED
FIGURE 4 DATA TRIANGULATION
FIGURE 5 BOTTOM-UP APPROACH
FIGURE 6 TOP-DOWN APPROACH
FIGURE 7 RESEARCH FLOW
FIGURE 8 GLOBAL METHANOL MARKET BY FEEDSTOCK, USD BILLION, 2020-2029
FIGURE 9 GLOBAL METHANOL MARKET BY DERIVATIVE, USD BILLION, 2020-2029
FIGURE 10 GLOBAL METHANOL MARKET BY SUB-DERIVATIVE, USD BILLION, 2020-2029
FIGURE 11 GLOBAL METHANOL MARKET BY END USER, USD BILLION, 2020-2029
FIGURE 12 GLOBAL METHANOL MARKET BY REGION, USD BILLION, 2020-2029
FIGURE 13 PORTER’S FIVE FORCES MODEL
FIGURE 14 GLOBAL METHANOL MARKET BY FEEDSTOCK, USD BILLION, 2021
FIGURE 15 GLOBAL METHANOL MARKET BY DERIVATIVE, USD BILLION, 2021
FIGURE 16 GLOBAL METHANOL MARKET BY SUB-DERIVATIVE, USD BILLION, 2021
FIGURE 17 GLOBAL METHANOL MARKET BY END USER, USD BILLION, 2021
FIGURE 18 GLOBAL METHANOL MARKET BY REGION, USD BILLION, 2021
FIGURE 19 MARKET SHARE ANALYSIS
FIGURE 20 CELANESE CORPORATION: COMPANY SNAPSHOT
FIGURE 21 BASF SE: COMPANY SNAPSHOT
FIGURE 22 METHANEX CORPORATION: COMPANY SNAPSHOT
FIGURE 23 SABIC: COMPANY SNAPSHOT
FIGURE 24 PETROLIAM NASIONAL BERHAD (PETRONAS): COMPANY SNAPSHOT
FIGURE 25 MITSUBISHI GAS CHEMICAL COMPANY, INC: COMPANY SNAPSHOT
FIGURE 26 VALERO: COMPANY SNAPSHOT
FIGURE 27 MITSUI & CO., LTD: COMPANY SNAPSHOT
FIGURE 28 METHANOL HOLDINGS (TRINIDAD) LIMITED: COMPANY SNAPSHOT
FIGURE 29 ZAGROS PETROCHEMICAL CO: COMPANY SNAPSHOT
DOWNLOAD FREE SAMPLE REPORT
License Type
SPEAK WITH OUR ANALYST
Want to know more about the report or any specific requirement?
WANT TO CUSTOMIZE THE REPORT?
Our Clients Speak
We asked them to research ‘ Equipment market’ all over the world, and their whole arrangement was helpful to us. thehealthanalytics.com insightful analysis and reports contributed to our current analysis and in creating a future strategy. Besides, the te
Yosuke Mitsui
Senior Associate Construction Equipment Sales & Marketing
We asked them to research ‘Equipment market’ all over the world, and their whole arrangement was helpful to us. thehealthanalytics.com insightful analysis and reports contributed to our current analysis and in creating a future strategy. Besides, the te


