

Base Year Value ()
x.x %
x.x %
CAGR ()
x.x %
x.x %
Forecast Year Value ()
x.x %
x.x %
Historical Data Period
Largest Region
Forecast Period
Mercato delle apparecchiature di processo per tipo (pulitrici, essiccatrici, rivestitrici, separatori, lucidatrici, altre), coltura (cereali e granaglie, semi oleosi e legumi, frutta e verdura, altre) e regione, tendenze globali e previsioni dal 2022 al 2029.
Instant access to hundreds of data points and trends
- Market estimates from 2014-2029
- Competitive analysis, industry segmentation, financial benchmarks
- Incorporates SWOT, Porter's Five Forces and risk management frameworks
- PDF report or online database with Word, Excel and PowerPoint export options
- 100% money back guarantee
Panoramica del mercato delle apparecchiature di processo
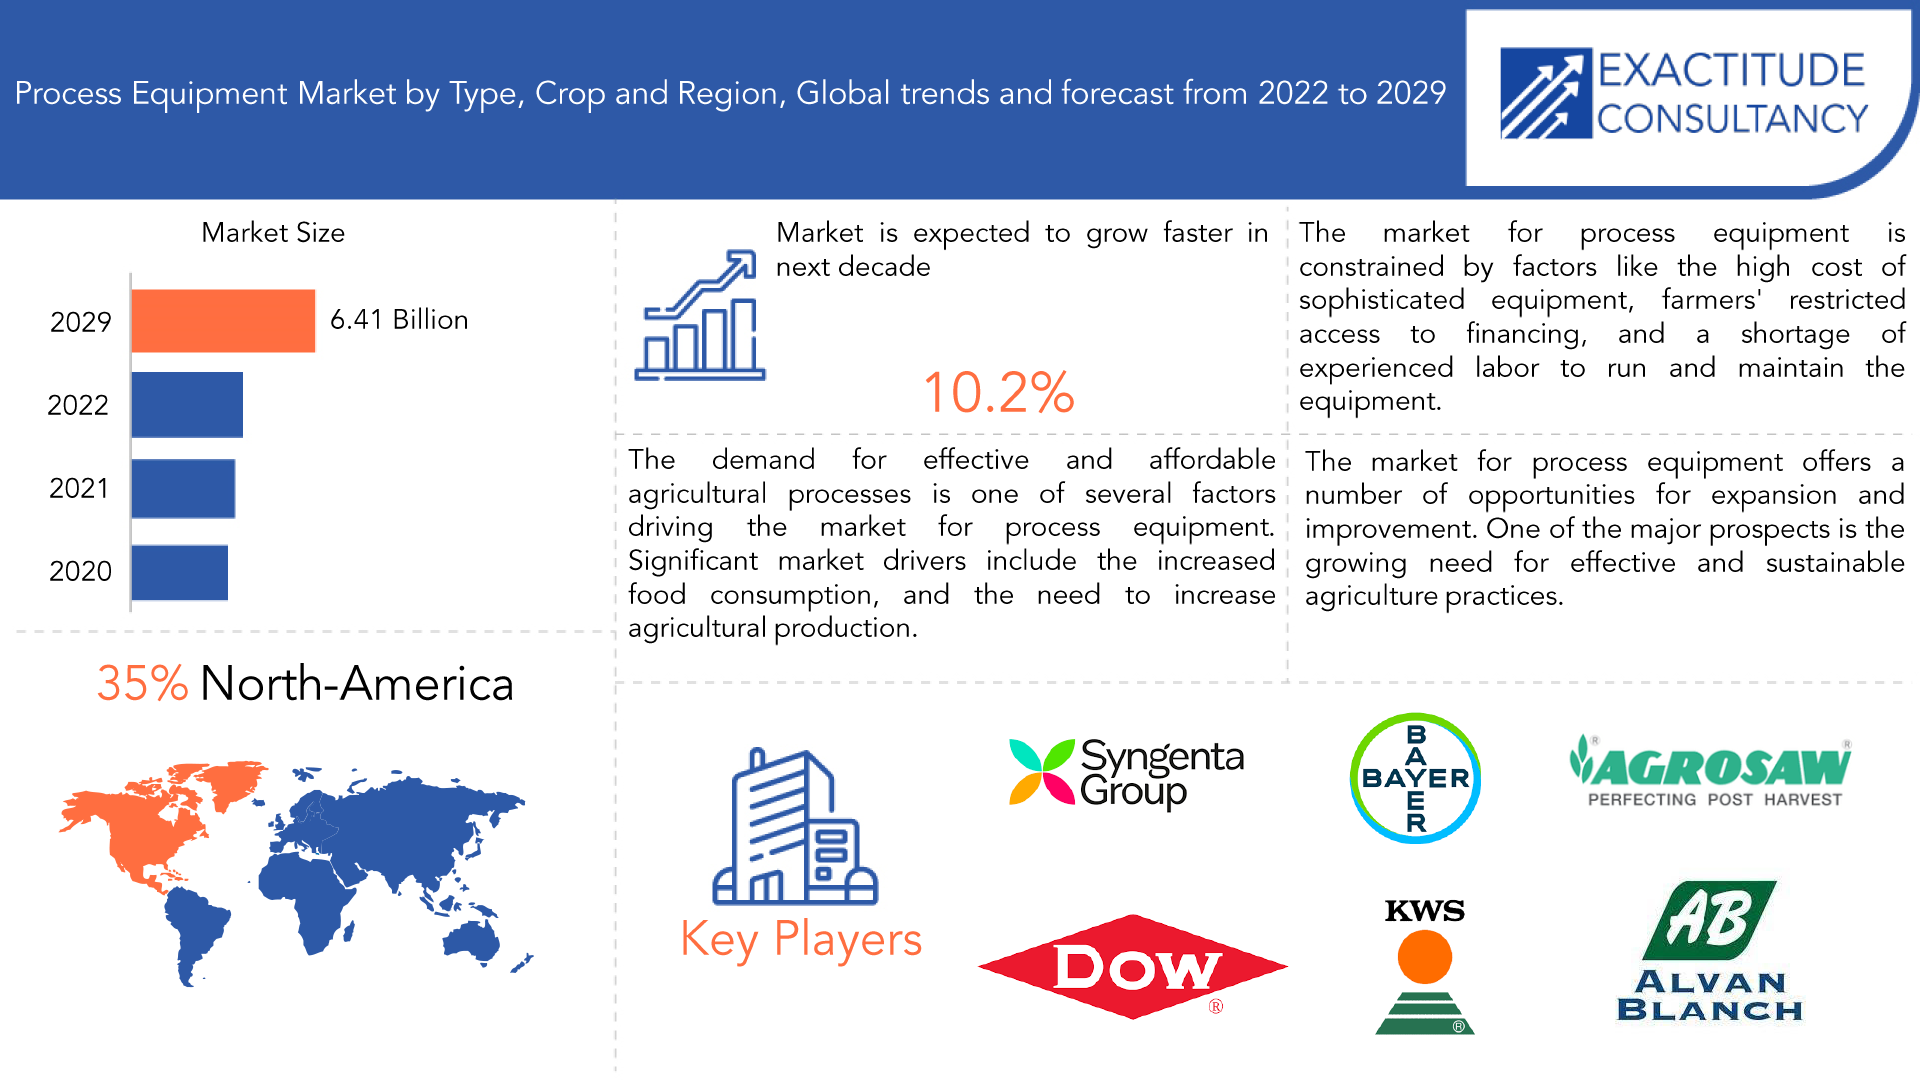
Si prevede che il mercato delle apparecchiature di processo crescerà al 10,2% di CAGR dal 2022 al 2029. Si prevede che raggiungerà oltre 6,41 miliardi di USD entro il 2029 dai 2,68 miliardi di USD del 2020.
Il termine "attrezzature di processo" si riferisce ai macchinari utilizzati nei settori di lavorazione come quelli per cemento, zucchero, prodotti farmaceutici, tessili, acciaio , alimenti, prodotti chimici, petrolchimici, carta, energia, ecc. Scambiatori di calore, serbatoi di stoccaggio, valvole, meccanismi di sfiato della pressione, caldaie, condotte, forni e tubi sono alcuni esempi di queste attrezzature. Ognuno di questi pezzi di macchinario è significativo per la sua funzione essenziale nell'esecuzione di un processo. I macchinari possono essere fissi o in movimento. Sono prodotti o creati tenendo conto di aspetti come il miglioramento della qualità e dell'affidabilità, l'aumento dell'efficienza energetica dei processi, la riduzione delle emissioni e di altri effetti ambientali, il miglioramento della sicurezza e l'aumento della flessibilità di fabbriche e processi.
Il mercato delle apparecchiature di processo è il settore dell'economia che sviluppa, produce e commercializza macchinari utilizzati nei processi industriali. Questi utensili, macchine e strumenti possono essere utilizzati nei settori chimico, farmaceutico, alimentare e delle bevande , petrolifero e del gas e del trattamento delle acque, tra gli altri.
La crescente necessità di automazione e metodi di produzione efficaci in una varietà di settori è ciò che sta guidando il mercato delle apparecchiature di processo. Molti pezzi di macchinari, tra cui caldaie, compressori, pompe, valvole e turbine, sono disponibili sul mercato.
| ATTRIBUTO | DETTAGLI |
| Periodo di studio | 2020-2029 |
| Anno base | 2021 |
| Anno stimato | 2022 |
| Anno previsto | 2022-2029 |
| Periodo storico | 2018-2020 |
| Unità | Valore (miliardi di USD), Valore (migliaia di unità) |
| Segmentazione | Per tipo, per coltura, per regione |
| Per tipo |
|
| Per coltura |
|
| Per regione |
|
The demand for effective and affordable agricultural processes is one of several factors driving the market for process equipment. Significant market drivers include the expanding population, increased food consumption, and the need to increase agricultural production. The industry is further stimulated by the implementation of cutting-edge technologies like automation, smart farming, and precision agriculture, which raise productivity and lower labor costs. Government programs and subsidies to encourage modernization and the deployment of cutting-edge machinery in agriculture are another market-driving factor. The market is also fueled by the rising demand for environmentally friendly agricultural methods that call for equipment that has a minimal negative impact on the environment.
The industry is also being driven by the emergence of cutting-edge technologies like the Internet of Things (IoT), big data analytics, and artificial intelligence (AI). Real-time process monitoring and data-driven decision making are made possible by these technologies, which improves productivity and efficiency. Overall, it is anticipated that the market for process equipment will increase in the future as more and more sectors of industry embrace cutting-edge machinery and technologies to improve their processes and match the demands of contemporary production.
The market for process equipment is constrained by factors like the high cost of sophisticated equipment, farmers' restricted access to financing, and a shortage of experienced labor to run and maintain the equipment. The adoption of some equipment types may also be hampered by environmental and legal issues. It will be essential to address these constraints if the market is to expand and thrive, especially in developing nations and for small-scale producers.
The market for process equipment offers a number of opportunities for expansion and improvement. One of the major prospects is the growing need for effective and sustainable agriculture practices, which is being driven by the expanding global population and increasing food consumption. The industry is also given chances by the implementation of cutting-edge technologies like automation, smart farming, and precision agriculture. Government programs and subsidies to encourage modernization and the use of cutting-edge machinery in agriculture may also contribute to the market's expansion. Opportunities for the industry also arise from the advent of the Internet of Things (IoT), big data analytics, and artificial intelligence (AI) in agriculture. The process equipment market for agriculture is anticipated to grow and develop over the next few years as a result of all of these factors.
Alcuni processi in agricoltura e reti di fornitura sono stati interrotti dal COVID-19. La catena di fornitura è stata interrotta a causa delle limitazioni di trasporto e diverse strutture industriali hanno dovuto chiudere temporaneamente. Secondo fonti dei media, la chiusura di strutture ricettive, ristoranti, pasticcerie e sale da tè ha già avuto un impatto sulle vendite di latte. L'impatto economico dell'India sarà molto probabilmente significativamente peggiore per due motivi. L'economia stava già rallentando prima del COVID-19, il che ha esacerbato problemi preesistenti con disoccupazione, basso reddito, sofferenza rurale, fame e grave disuguaglianza. In secondo luogo, il considerevole settore non organizzato è particolarmente esposto.
[caption id="allegato_20513" align="aligncenter" width="1920"]
Frequently Asked Questions
• What is the total market value of Global process equipment market?
The global process equipment market size was valued at 2.68 Billion in 2020.
• Who are the key players in the process equipment market?
The process equipment market key players include Syngenta, Bayer, KWS Group, The Dow Chemical Company, Agrosaw, Alvan Blanch Development Company, GroupCimbria, Lewis M. Carter Manufacturing, Spectrum Industries, Westrup.
• Which is the largest regional market for process equipment?
North America is the largest regional market for process equipment.
• What is the growth rate of process equipment market?
The process equipment market is growing at a CAGR of 10.2% over the next 5 years.
Process Equipment Market Segment Analysis
The process equipment market is segmented based on coating type, application and region. Based on type market is segmented into cleaners, dryers, coaters, separators, polishers, others; by crop market is segmented into cereals & grains, oilseeds & pulses, fruits & vegetables and others.
Due of the numerous advantages that seed coatings provide, including high yield and protective properties, the coaters market will experience rapid expansion. Coated seeds have a thin layer of nutrients and chemicals that aid in crop growth and protect seeds from insects. Seed coating aids in shielding seeds from bacteria, fungus, and other microorganisms.
The majority of all crop kinds are of the grains and cereals variety, and this tendency is anticipated to last from 2021 through 2026. The market is benefiting from the rising consumption of grains and cereals such wheat, maize, corn, rice, and barley. The type of oilseeds and pulses will grow rapidly on the international market. The expansion of this market is being aided by the rising output of cooking oil seeds like groundnut, sunflower, and palm seeds globally. Further boosting market growths are the emerging countries' booming food industries and the expansion of the cooking oil sector.
[caption id="attachment_20524" align="aligncenter" width="1920"]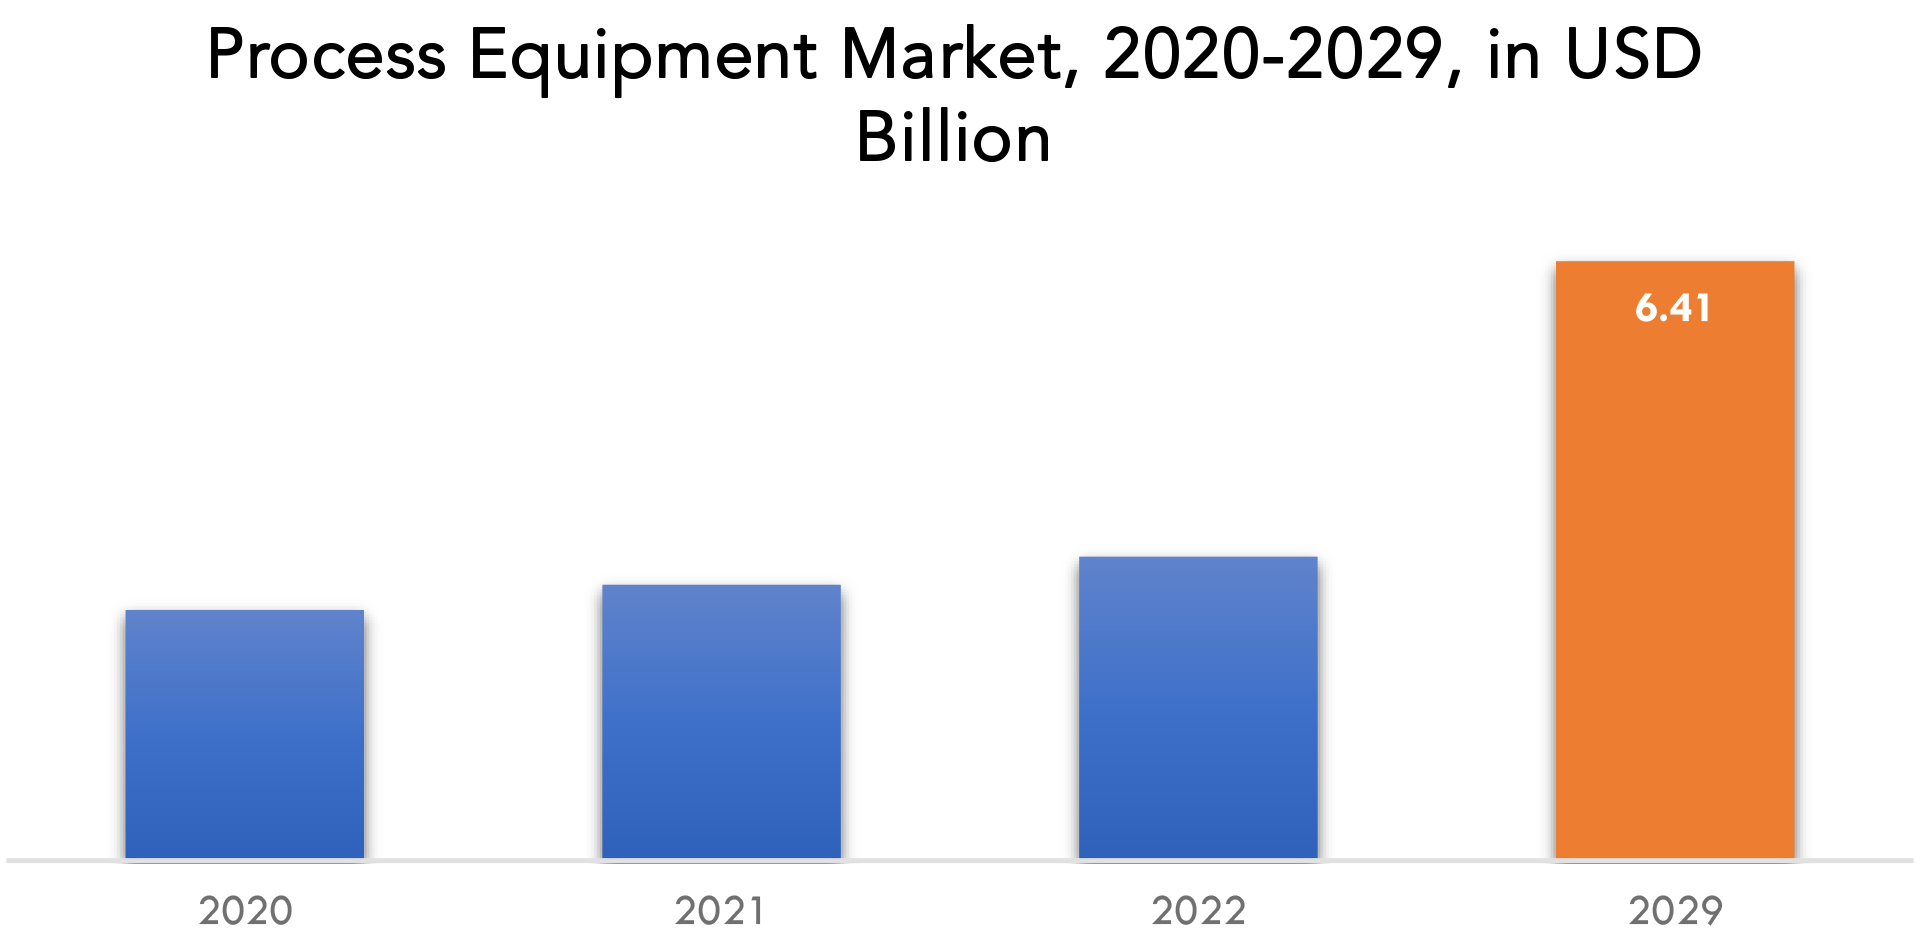
Process Equipment Market Key Players
The process equipment market key players include Syngenta, Bayer, KWS Group, The Dow Chemical Company, Agrosaw, Alvan Blanch Development Company, GroupCimbria, Lewis M. Carter Manufacturing, Spectrum Industries, Westrup, and others.- 06 March 2023: Dow announced the introduction of FINGERPRINT DFDA-7555 NT Bimodal Polyethylene Resin, an evolution of its legacy FINGERPRINT Polyethylene Resins.
- 25 January 2023: Dow and LVMH Beauty, a division of LVMH, the world leader in luxury and home to 75 iconic brands, collaborated to accelerate the use of sustainable packaging across LVMH’s perfume and cosmetic products.
Who Should Buy? Or Key stakeholders
- Agriculture Industry
- Seed Industry
- Government Organizations
- Investors
- Research and development
- Regulatory Authorities
- End-users Companies
- Others
Process Equipment Market Regional Analysis
The process equipment market by region includes North America, Asia-Pacific (APAC), Europe, South America, and Middle East & Africa (MEA).
- North America: includes the US, Canada, Mexico, Rest of North America
- Asia Pacific: includes China, Japan, South Korea, India, Australia, and Rest of APAC
- Europe: includes UK, Germany, France, Italy, Spain, and Rest of Europe
- South America: includes Brazil, Argentina, and Rest of South America
- Middle East & Africa: includes UAE, South Africa, and Rest of MEA
From 2022 to 2029, the North American region is expected to develop significantly, continuing its dominance of the global market. According to estimates, the market in the region with the quickest growth is the United States. The high usage of processed seeds, technological advancements in agriculture, and a growth in the use of genetically modified crops are the key drivers of the processing equipment market in the nation. The market for process equipment for the seed business has advanced significantly thanks to multinational corporations operating in the United States and the constantly developing technologies in the agricultural and food systems.
The Asia-Pacific area is expected to increase at a rapid pace between 2022 and 2029. According to forecasts, China will have the fastest growth in the local economy. According to estimates, China is the region's top producer and consumer of processed seeds and processing machinery. Growing agricultural exports is largely due to increased fruit and vegetable production. The demand for commercial seed and seed processing equipment is rising in China, but the market's expansion is seriously hampered by the high cost of processed seeds.
[caption id="attachment_20527" align="aligncenter" width="1920"]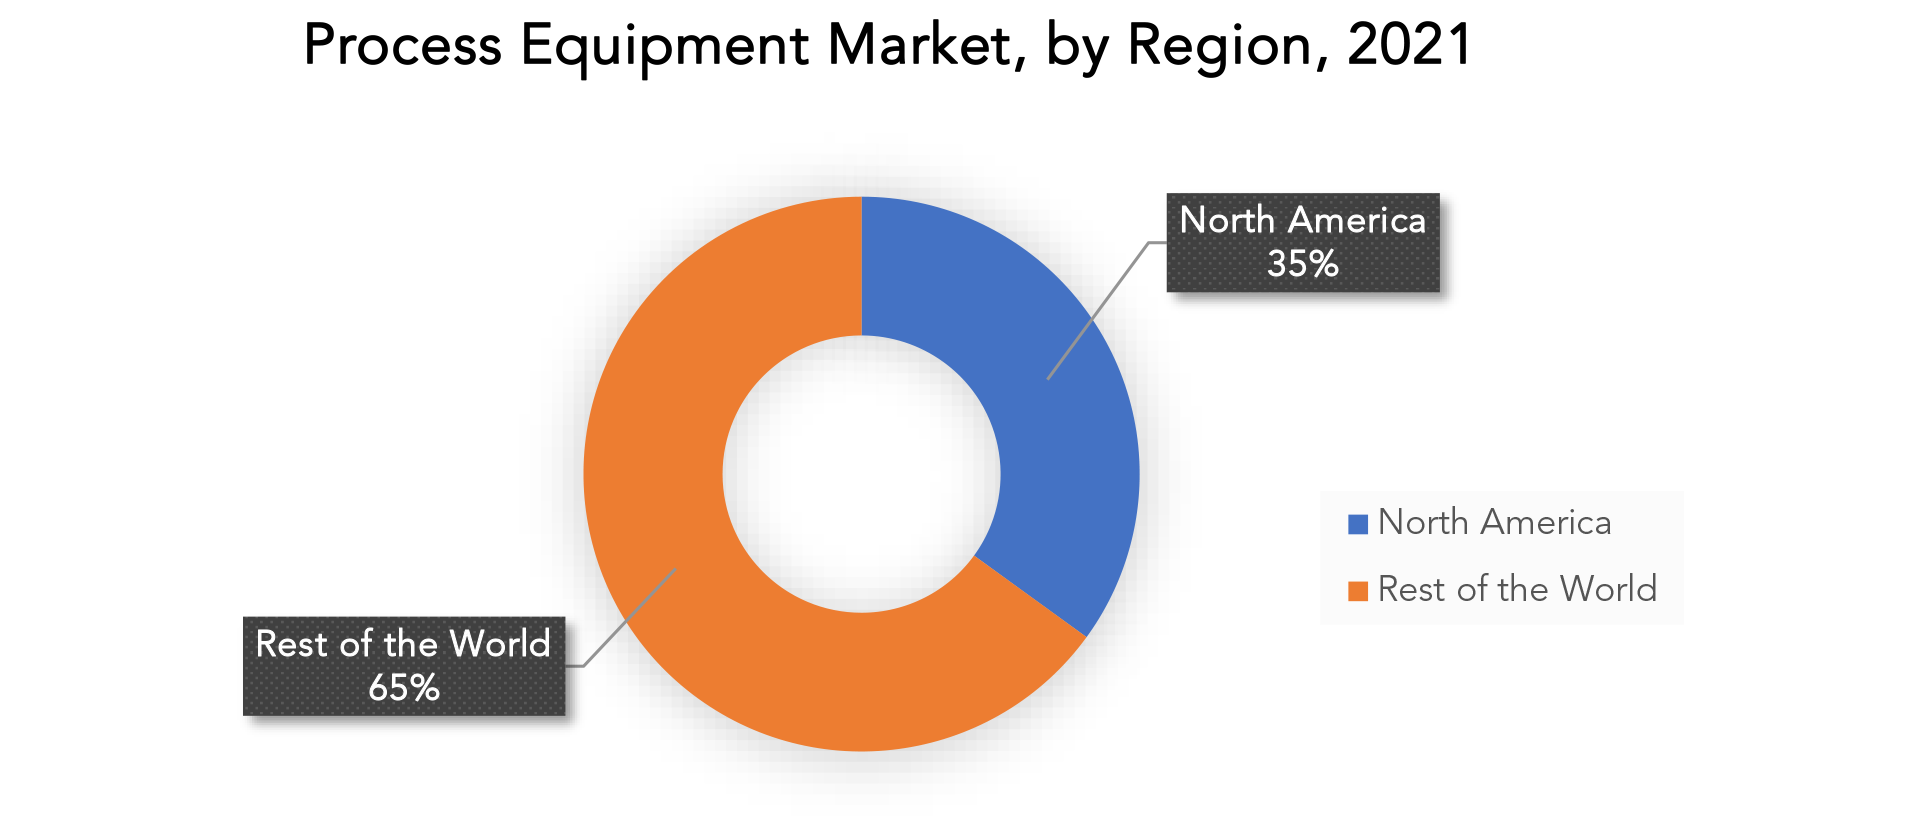
Key Market Segments: Process equipment market
Process Equipment Market By Type, 2020-2029, (USD Billion, Thousand Units)- Cleaners
- Dryers
- Coaters
- Separators
- Polishers
- Others
- Cereals And Grains
- Oilseeds And Pulses
- Fruits And Vegetables
- Others
- North America
- Asia Pacific
- Europe
- South America
- Middle East And Africa
Exactitude Consultancy Services Key Objectives
- Increasing sales and market share
- Developing new technology
- Improving profitability
- Entering new markets
- Enhancing brand reputation
Key Question Answered
- What is the expected growth rate of the process equipment market over the next 7 years?
- Who are the major players in the process equipment market and what is their market share?
- What are the end-user industries driving demand for market and what is their outlook?
- What are the opportunities for growth in emerging markets such as Asia-pacific, Middle East, and Africa?
- How is the economic environment affecting the process equipment market, including factors such as interest rates, inflation, and exchange rates?
- What is the expected impact of government policies and regulations on the process equipment market?
- What is the current and forecasted size and growth rate of the global process equipment market?
- What are the key drivers of growth in the process equipment market?
- Who are the major players in the market and what is their market share?
- What are the distribution channels and supply chain dynamics in the process equipment market?
- What are the technological advancements and innovations in the process equipment market and their impact on product development and growth?
- What are the regulatory considerations and their impact on the market?
- What are the challenges faced by players in the process equipment market and how are they addressing these challenges?
- What are the opportunities for growth and expansion in the process equipment market?
- What are the service offerings and specifications of leading players in the market?
- INTRODUZIONE
- DEFINIZIONE DI MERCATO
- SEGMENTAZIONE DEL MERCATO
- TEMPI DI RICERCA
- ASSUNZIONI E LIMITAZIONI
- METODOLOGIA DI RICERCA
- ESTRAZIONE DATI
- RICERCA SECONDARIA
- RICERCA PRIMARIA
- PARERI DEGLI ESPERTI IN MATERIA
- CONTROLLI DI QUALITÀ
- RECENSIONE FINALE
- TRIANGOLAZIONE DEI DATI
- APPROCCIO DAL BASSO VERSO L'ALTO
- APPROCCIO TOP-DOWN
- FLUSSO DI RICERCA
- FONTI DEI DATI
- ESTRAZIONE DATI
- SINTESI
- PANORAMICA DEL MERCATO
- PROSPETTIVE DEL MERCATO GLOBALE DELLE ATTREZZATURE DI PROCESSO
- FATTORI DI MERCATO
- LIMITAZIONI DI MERCATO
- OPPORTUNITÀ DI MERCATO
- IMPATTO DEL COVID-19 SUL MERCATO DELLE ATTREZZATURE DI PROCESSO
- MODELLO DELLE CINQUE FORZE DI PORTER
- MINACCIA DAI NUOVI ENTRANSI
- MINACCIA DA SOSTITUTI
- POTERE CONTRATTUALE DEI FORNITORI
- POTERE CONTRATTUALE DEI CLIENTI
- GRADO DI COMPETIZIONE
- ANALISI DELLA CATENA DEL VALORE DEL SETTORE
- PROSPETTIVE DEL MERCATO GLOBALE DELLE ATTREZZATURE DI PROCESSO
- MERCATO GLOBALE DELLE ATTREZZATURE DI PROCESSO PER TIPO, (MILIARDI DI USD, MIGLIAIA DI UNITÀ), 2020-2029
- PULITORI
- ESSICCATORI
- RIVESTIMENTI
- SEPARATORI
- LUCIDATRICI
- ALTRI
- MERCATO GLOBALE DELLE ATTREZZATURE DI PROCESSO PER RACCOLTO, (MILIARDI DI USD, MIGLIAIA DI UNITÀ), 2020-2029
- CEREALI E GRANI
- SEMI OLEOSI E LEGUMI
- FRUTTA E VERDURA
- ALTRI
- MERCATO GLOBALE DELLE ATTREZZATURE DI PROCESSO PER REGIONE, (MILIARDI DI USD, MIGLIAIA DI UNITÀ), 2020-2029
- AMERICA DEL NORD
- NOI
- CANADA
- MESSICO
- RESTO DEL NORD AMERICA
- SUD AMERICA
- BRASILE
- ARGENTINA
- RESTO DEL SUD AMERICA
- EUROPA
- GERMANIA
- Regno Unito
- FRANCIA
- ITALIA
- SPAGNA
- RESTO D'EUROPA
- ASIA PACIFICO
- INDIA
- CINA
- GIAPPONE
- COREA DEL SUD
- AUSTRALIA
- RESTO DELL'ASIA PACIFICO
- MEDIO ORIENTE E AFRICA
- Emirati Arabi Uniti
- SUDAFRICA
- RESTO DEL MEDIO ORIENTE E AFRICA
- AMERICA DEL NORD
- PROFILI AZIENDALI* (PANORAMICA AZIENDALE, PANORAMICA AZIENDALE, PRODOTTI OFFERTI, SVILUPPI RECENTI)
- SINTETICA
- BAIERINA
- GRUPPO KWS
- LA SOCIETÀ DOW CHEMICAL
- AGROSAW
- SOCIETÀ DI SVILUPPO ALVAN BLANCH
- GRUPPOCIMBRIA
- LEWIS M. CARTER PRODUZIONE
- INDUSTRIA DELLO SPETTRO
- WESTRUP *L'ELENCO DELLE AZIENDE È INDICATIVO
ELENCO DELLE TABELLE
TABLE 1 GLOBAL PROCESS EQUIPMENT MARKET BY TYPE (USD BILLION), 2020-2029
TABLE 2 GLOBAL PROCESS EQUIPMENT MARKET BY TYPE (THOUSAND UNITS), 2020-2029
TABLE 3 GLOBAL PROCESS EQUIPMENT MARKET BY CROP (USD BILLION), 2020-2029
TABLE 4 GLOBAL PROCESS EQUIPMENT MARKET BY CROP (THOUSAND UNITS), 2020-2029
TABLE 5 GLOBAL PROCESS EQUIPMENT MARKET BY REGION (USD BILLION), 2020-2029
TABLE 6 GLOBAL PROCESS EQUIPMENT MARKET BY REGION (THOUSAND UNITS), 2020-2029
TABLE 7 NORTH AMERICA PROCESS EQUIPMENT MARKET BY TYPE (USD BILLION), 2020-2029
TABLE 8 NORTH AMERICA PROCESS EQUIPMENT MARKET BY TYPE (THOUSAND UNITS), 2020-2029
TABLE 9 NORTH AMERICA PROCESS EQUIPMENT MARKET BY CROP (USD BILLION), 2020-2029
TABLE 10 NORTH AMERICA PROCESS EQUIPMENT MARKET BY CROP (THOUSAND UNITS), 2020-2029
TABLE 11 NORTH AMERICA PROCESS EQUIPMENT MARKET BY COUNTRY (USD BILLION), 2020-2029
TABLE 12 NORTH AMERICA PROCESS EQUIPMENT MARKET BY COUNTRY (THOUSAND UNITS), 2020-2029
TABLE 13 US PROCESS EQUIPMENT MARKET BY TYPE (USD BILLION), 2020-2029
TABLE 14 US PROCESS EQUIPMENT MARKET BY TYPE (THOUSAND UNITS), 2020-2029
TABLE 15 US PROCESS EQUIPMENT MARKET BY CROP (USD BILLION), 2020-2029
TABLE 16 US PROCESS EQUIPMENT MARKET BY CROP (THOUSAND UNITS), 2020-2029
TABLE 17 CANADA PROCESS EQUIPMENT MARKET BY TYPE (BILLION), 2020-2029
TABLE 18 CANADA PROCESS EQUIPMENT MARKET BY TYPE (THOUSAND UNITS), 2020-2029
TABLE 19 CANADA PROCESS EQUIPMENT MARKET BY CROP (USD BILLION), 2020-2029
TABLE 20 CANADA PROCESS EQUIPMENT MARKET BY CROP (THOUSAND UNITS), 2020-2029
TABLE 21 MEXICO PROCESS EQUIPMENT MARKET BY TYPE (USD BILLION), 2020-2029
TABLE 22 MEXICO PROCESS EQUIPMENT MARKET BY TYPE (THOUSAND UNITS), 2020-2029
TABLE 23 MEXICO PROCESS EQUIPMENT MARKET BY CROP (USD BILLION), 2020-2029
TABLE 24 MEXICO PROCESS EQUIPMENT MARKET BY CROP (THOUSAND UNITS), 2020-2029
TABLE 25 REST OF NORTH AMERICA PROCESS EQUIPMENT MARKET BY TYPE (USD BILLION), 2020-2029
TABLE 26 REST OF NORTH AMERICA PROCESS EQUIPMENT MARKET BY TYPE (THOUSAND UNITS), 2020-2029
TABLE 27 REST OF NORTH AMERICA PROCESS EQUIPMENT MARKET BY CROP (USD BILLION), 2020-2029
TABLE 28 REST OF NORTH AMERICA PROCESS EQUIPMENT MARKET BY CROP (THOUSAND UNITS), 2020-2029
TABLE 29 SOUTH AMERICA PROCESS EQUIPMENT MARKET BY TYPE (USD BILLION), 2020-2029
TABLE 30 SOUTH AMERICA PROCESS EQUIPMENT MARKET BY TYPE (THOUSAND UNITS), 2020-2029
TABLE 31 SOUTH AMERICA PROCESS EQUIPMENT MARKET BY CROP (USD BILLION), 2020-2029
TABLE 32 SOUTH AMERICA PROCESS EQUIPMENT MARKET BY CROP (THOUSAND UNITS), 2020-2029
TABLE 33 SOUTH AMERICA PROCESS EQUIPMENT MARKET BY COUNTRY (USD BILLION), 2020-2029
TABLE 34 SOUTH AMERICA PROCESS EQUIPMENT MARKET BY COUNTRY (THOUSAND UNITS), 2020-2029
TABLE 35 BRAZIL PROCESS EQUIPMENT MARKET BY TYPE (USD BILLION), 2020-2029
TABLE 36 BRAZIL PROCESS EQUIPMENT MARKET BY TYPE (THOUSAND UNITS), 2020-2029
TABLE 37 BRAZIL PROCESS EQUIPMENT MARKET BY CROP (USD BILLION), 2020-2029
TABLE 38 BRAZIL PROCESS EQUIPMENT MARKET BY CROP (THOUSAND UNITS), 2020-2029
TABLE 39 ARGENTINA PROCESS EQUIPMENT MARKET BY TYPE (USD BILLION), 2020-2029
TABLE 40 ARGENTINA PROCESS EQUIPMENT MARKET BY TYPE (THOUSAND UNITS), 2020-2029
TABLE 41 ARGENTINA PROCESS EQUIPMENT MARKET BY CROP (USD BILLION), 2020-2029
TABLE 42 ARGENTINA PROCESS EQUIPMENT MARKET BY CROP (THOUSAND UNITS), 2020-2029
TABLE 43 COLOMBIA PROCESS EQUIPMENT MARKET BY TYPE (USD BILLION), 2020-2029
TABLE 44 COLOMBIA PROCESS EQUIPMENT MARKET BY TYPE (THOUSAND UNITS), 2020-2029
TABLE 45 COLOMBIA PROCESS EQUIPMENT MARKET BY CROP (USD BILLION), 2020-2029
TABLE 46 COLOMBIA PROCESS EQUIPMENT MARKET BY CROP (THOUSAND UNITS), 2020-2029
TABLE 47 REST OF SOUTH AMERICA PROCESS EQUIPMENT MARKET BY TYPE (USD BILLION), 2020-2029
TABLE 48 REST OF SOUTH AMERICA PROCESS EQUIPMENT MARKET BY TYPE (THOUSAND UNITS), 2020-2029
TABLE 49 REST OF SOUTH AMERICA PROCESS EQUIPMENT MARKET BY CROP (USD BILLION), 2020-2029
TABLE 50 REST OF SOUTH AMERICA PROCESS EQUIPMENT MARKET BY CROP (THOUSAND UNITS), 2020-2029
TABLE 51 ASIA -PACIFIC PROCESS EQUIPMENT MARKET BY TYPE (USD BILLION), 2020-2029
TABLE 52 ASIA -PACIFIC PROCESS EQUIPMENT MARKET BY TYPE (THOUSAND UNITS), 2020-2029
TABLE 53 ASIA -PACIFIC PROCESS EQUIPMENT MARKET BY CROP (USD BILLION), 2020-2029
TABLE 54 ASIA -PACIFIC PROCESS EQUIPMENT MARKET BY CROP (THOUSAND UNITS), 2020-2029
TABLE 55 ASIA -PACIFIC PROCESS EQUIPMENT MARKET BY COUNTRY (USD BILLION), 2020-2029
TABLE 56 ASIA -PACIFIC PROCESS EQUIPMENT MARKET BY COUNTRY (THOUSAND UNITS), 2020-2029
TABLE 57 INDIA PROCESS EQUIPMENT MARKET BY TYPE (USD BILLION), 2020-2029
TABLE 58 INDIA PROCESS EQUIPMENT MARKET BY TYPE (THOUSAND UNITS), 2020-2029
TABLE 59 INDIA PROCESS EQUIPMENT MARKET BY CROP (USD BILLION), 2020-2029
TABLE 60 INDIA PROCESS EQUIPMENT MARKET BY CROP (THOUSAND UNITS), 2020-2029
TABLE 61 CHINA PROCESS EQUIPMENT MARKET BY TYPE (USD BILLION), 2020-2029
TABLE 62 CHINA PROCESS EQUIPMENT MARKET BY TYPE (THOUSAND UNITS), 2020-2029
TABLE 63 CHINA PROCESS EQUIPMENT MARKET BY CROP (USD BILLION), 2020-2029
TABLE 64 CHINA PROCESS EQUIPMENT MARKET BY CROP (THOUSAND UNITS), 2020-2029
TABLE 65 JAPAN PROCESS EQUIPMENT MARKET BY TYPE (USD BILLION), 2020-2029
TABLE 66 JAPAN PROCESS EQUIPMENT MARKET BY TYPE (THOUSAND UNITS), 2020-2029
TABLE 67 JAPAN PROCESS EQUIPMENT MARKET BY CROP (USD BILLION), 2020-2029
TABLE 68 JAPAN PROCESS EQUIPMENT MARKET BY CROP (THOUSAND UNITS), 2020-2029
TABLE 69 SOUTH KOREA PROCESS EQUIPMENT MARKET BY TYPE (USD BILLION), 2020-2029
TABLE 70 SOUTH KOREA PROCESS EQUIPMENT MARKET BY TYPE (THOUSAND UNITS), 2020-2029
TABLE 71 SOUTH KOREA PROCESS EQUIPMENT MARKET BY CROP (USD BILLION), 2020-2029
TABLE 72 SOUTH KOREA PROCESS EQUIPMENT MARKET BY CROP (THOUSAND UNITS), 2020-2029
TABLE 73 AUSTRALIA PROCESS EQUIPMENT MARKET BY TYPE (USD BILLION), 2020-2029
TABLE 74 AUSTRALIA HYBRID APPLICATIONBY TYPES (THOUSAND UNITS), 2020-2029
TABLE 75 AUSTRALIA PROCESS EQUIPMENT MARKET BY CROP (USD BILLION), 2020-2029
TABLE 76 AUSTRALIA PROCESS EQUIPMENT MARKET BY CROP (THOUSAND UNITS), 2020-2029
TABLE 77 REST OF ASIA PACIFIC PROCESS EQUIPMENT MARKET BY TYPE (USD BILLION), 2020-2029
TABLE 78 REST OF ASIA PACIFIC HYBRID APPLICATIONBY TYPES (THOUSAND UNITS), 2020-2029
TABLE 79 REST OF ASIA PACIFIC PROCESS EQUIPMENT MARKET BY CROP (USD BILLION), 2020-2029
TABLE 80 REST OF ASIA PACIFIC PROCESS EQUIPMENT MARKET BY CROP (THOUSAND UNITS), 2020-2029
TABLE 81 EUROPE PROCESS EQUIPMENT MARKET BY TYPE (USD BILLION), 2020-2029
TABLE 82 EUROPE PROCESS EQUIPMENT MARKET BY TYPE (THOUSAND UNITS), 2020-2029
TABLE 83 EUROPE PROCESS EQUIPMENT MARKET BY CROP (USD BILLION), 2020-2029
TABLE 84 EUROPE PROCESS EQUIPMENT MARKET BY CROP (THOUSAND UNITS), 2020-2029
TABLE 85 EUROPE PROCESS EQUIPMENT MARKET BY COUNTRY (USD BILLION), 2020-2029
TABLE 86 EUROPE PROCESS EQUIPMENT MARKET BY COUNTRY (THOUSAND UNITS), 2020-2029
TABLE 87 GERMANY PROCESS EQUIPMENT MARKET BY TYPE (USD BILLION), 2020-2029
TABLE 88 GERMANY PROCESS EQUIPMENT MARKET BY TYPE (THOUSAND UNITS), 2020-2029
TABLE 89 GERMANY PROCESS EQUIPMENT MARKET BY CROP (USD BILLION), 2020-2029
TABLE 90 GERMANY PROCESS EQUIPMENT MARKET BY CROP (THOUSAND UNITS), 2020-2029
TABLE 91 UK PROCESS EQUIPMENT MARKET BY TYPE (USD BILLION), 2020-2029
TABLE 92 UK PROCESS EQUIPMENT MARKET BY TYPE (THOUSAND UNITS), 2020-2029
TABLE 93 UK PROCESS EQUIPMENT MARKET BY CROP (USD BILLION), 2020-2029
TABLE 94 UK PROCESS EQUIPMENT MARKET BY CROP (THOUSAND UNITS), 2020-2029
TABLE 95 FRANCE PROCESS EQUIPMENT MARKET BY TYPE (USD BILLION), 2020-2029
TABLE 96 FRANCE PROCESS EQUIPMENT MARKET BY TYPE (THOUSAND UNITS), 2020-2029
TABLE 97 FRANCE PROCESS EQUIPMENT MARKET BY CROP (USD BILLION), 2020-2029
TABLE 98 FRANCE PROCESS EQUIPMENT MARKET BY CROP (THOUSAND UNITS), 2020-2029
TABLE 99 ITALY PROCESS EQUIPMENT MARKET BY TYPE (USD BILLION), 2020-2029
TABLE 100 ITALY PROCESS EQUIPMENT MARKET BY TYPE (THOUSAND UNITS), 2020-2029
TABLE 101 ITALY PROCESS EQUIPMENT MARKET BY CROP (USD BILLION), 2020-2029
TABLE 102 ITALY PROCESS EQUIPMENT MARKET BY CROP (THOUSAND UNITS), 2020-2029
TABLE 103 SPAIN PROCESS EQUIPMENT MARKET BY TYPE (USD BILLION), 2020-2029
TABLE 104 SPAIN PROCESS EQUIPMENT MARKET BY TYPE (THOUSAND UNITS), 2020-2029
TABLE 105 SPAIN PROCESS EQUIPMENT MARKET BY CROP (USD BILLION), 2020-2029
TABLE 106 SPAIN PROCESS EQUIPMENT MARKET BY CROP (THOUSAND UNITS), 2020-2029
TABLE 107 RUSSIA PROCESS EQUIPMENT MARKET BY TYPE (USD BILLION), 2020-2029
TABLE 108 RUSSIA PROCESS EQUIPMENT MARKET BY TYPE (THOUSAND UNITS), 2020-2029
TABLE 109 RUSSIA PROCESS EQUIPMENT MARKET BY CROP (USD BILLION), 2020-2029
TABLE 110 RUSSIA PROCESS EQUIPMENT MARKET BY CROP (THOUSAND UNITS), 2020-2029
TABLE 111 REST OF EUROPE PROCESS EQUIPMENT MARKET BY TYPE (USD BILLION), 2020-2029
TABLE 112 REST OF EUROPE PROCESS EQUIPMENT MARKET BY TYPE (THOUSAND UNITS), 2020-2029
TABLE 113 REST OF EUROPE PROCESS EQUIPMENT MARKET BY CROP (USD BILLION), 2020-2029
TABLE 114 REST OF EUROPE PROCESS EQUIPMENT MARKET BY CROP (THOUSAND UNITS), 2020-2029
TABLE 115 MIDDLE EAST AND AFRICA PROCESS EQUIPMENT MARKET BY TYPE (USD BILLION), 2020-2029
TABLE 116 MIDDLE EAST AND AFRICA PROCESS EQUIPMENT MARKET BY TYPE (THOUSAND UNITS), 2020-2029
TABLE 117 MIDDLE EAST AND AFRICA PROCESS EQUIPMENT MARKET BY CROP (USD BILLION), 2020-2029
TABLE 118 MIDDLE EAST AND AFRICA PROCESS EQUIPMENT MARKET BY CROP (THOUSAND UNITS), 2020-2029
TABLE 119 MIDDLE EAST ABD AFRICA PROCESS EQUIPMENT MARKET BY COUNTRY (USD BILLION), 2020-2029
TABLE 120 MIDDLE EAST ABD AFRICA PROCESS EQUIPMENT MARKET BY COUNTRY (THOUSAND UNITS), 2020-2029
TABLE 121 UAE PROCESS EQUIPMENT MARKET BY TYPE (USD BILLION), 2020-2029
TABLE 122 UAE PROCESS EQUIPMENT MARKET BY TYPE (THOUSAND UNITS), 2020-2029
TABLE 123 UAE PROCESS EQUIPMENT MARKET BY CROP (USD BILLION), 2020-2029
TABLE 124 UAE PROCESS EQUIPMENT MARKET BY CROP (THOUSAND UNITS), 2020-2029
TABLE 125 SAUDI ARABIA PROCESS EQUIPMENT MARKET BY TYPE (USD BILLION), 2020-2029
TABLE 126 SAUDI ARABIA PROCESS EQUIPMENT MARKET BY TYPE (THOUSAND UNITS), 2020-2029
TABLE 127 SAUDI ARABIA PROCESS EQUIPMENT MARKET BY CROP (USD BILLION), 2020-2029
TABLE 128 SAUDI ARABIA PROCESS EQUIPMENT MARKET BY CROP (THOUSAND UNITS), 2020-2029
TABLE 129 SOUTH AFRICA PROCESS EQUIPMENT MARKET BY TYPE (USD BILLION), 2020-2029
TABLE 130 SOUTH AFRICA PROCESS EQUIPMENT MARKET BY TYPE (THOUSAND UNITS), 2020-2029
TABLE 131 SOUTH AFRICA PROCESS EQUIPMENT MARKET BY CROP (USD BILLION), 2020-2029
TABLE 132 SOUTH AFRICA PROCESS EQUIPMENT MARKET BY CROP (THOUSAND UNITS), 2020-2029
TABLE 133 REST OF MIDDLE EAST AND AFRICA PROCESS EQUIPMENT MARKET BY TYPE (USD BILLION), 2020-2029
TABLE 134 REST OF MIDDLE EAST AND AFRICA PROCESS EQUIPMENT MARKET BY TYPE (THOUSAND UNITS), 2020-2029
TABLE 135 REST OF MIDDLE EAST AND AFRICA PROCESS EQUIPMENT MARKET BY CROP (USD BILLION), 2020-2029
TABLE 136 REST OF MIDDLE EAST AND AFRICA PROCESS EQUIPMENT MARKET BY CROP (THOUSAND UNITS), 2020-2029
LIST OF FIGURES
FIGURE 1 MARKET DYNAMICS
FIGURE 2 MARKET SEGMENTATION
FIGURE 3 REPORT TIMELINES: YEARS CONSIDERED
FIGURE 4 DATA TRIANGULATION
FIGURE 5 BOTTOM-UP APPROACH
FIGURE 6 TOP-DOWN APPROACH
FIGURE 7 RESEARCH FLOW
FIGURE 8 GLOBAL PROCESS EQUIPMENT MARKET BY TYPE, USD BILLION, 2020-2029
FIGURE 9 GLOBAL PROCESS EQUIPMENT MARKET BY CROP, USD BILLION, 2020-2029
FIGURE 10 GLOBAL PROCESS EQUIPMENT MARKET BY REGION, USD BILLION, 2020-2029
FIGURE 11 PORTER’S FIVE FORCES MODEL
FIGURE 12 GLOBAL PROCESS EQUIPMENT MARKET BY TYPE, USD BILLION, 2021
FIGURE 13 GLOBAL PROCESS EQUIPMENT MARKET BY CROP, USD BILLION, 2021
FIGURE 14 GLOBAL PROCESS EQUIPMENT MARKET BY REGION, USD BILLION, 2021
FIGURE 15 MARKET SHARE ANALYSIS
FIGURE 16 SYNGENTA: COMPANY SNAPSHOT
FIGURE 17 BAYER: COMPANY SNAPSHOT
FIGURE 18 KWS GROUP: COMPANY SNAPSHOT
FIGURE 19 THE DOW CHEMICAL COMPANY: COMPANY SNAPSHOT
FIGURE 20 AGROSAW: COMPANY SNAPSHOT
FIGURE 21 ALVAN BLANCH DEVELOPMENT COMPANY: COMPANY SNAPSHOT
FIGURE 22 GROUPCIMBRIA: COMPANY SNAPSHOT
FIGURE 23 LEWIS M. CARTER MANUFACTURING: COMPANY SNAPSHOT
FIGURE 24 SPECTRUM INDUSTRIES: COMPANY SNAPSHOT
FIGURE 25 WESTRUP: COMPANY SNAPSHOT
DOWNLOAD FREE SAMPLE REPORT
License Type
SPEAK WITH OUR ANALYST
Want to know more about the report or any specific requirement?
WANT TO CUSTOMIZE THE REPORT?
Our Clients Speak
We asked them to research ‘ Equipment market’ all over the world, and their whole arrangement was helpful to us. thehealthanalytics.com insightful analysis and reports contributed to our current analysis and in creating a future strategy. Besides, the te
Yosuke Mitsui
Senior Associate Construction Equipment Sales & Marketing
We asked them to research ‘Equipment market’ all over the world, and their whole arrangement was helpful to us. thehealthanalytics.com insightful analysis and reports contributed to our current analysis and in creating a future strategy. Besides, the te


