

Base Year Value ()
x.x %
x.x %
CAGR ()
x.x %
x.x %
Forecast Year Value ()
x.x %
x.x %
Historical Data Period
Largest Region
Forecast Period
Mercato globale dei chelati metallici per tipo (nutrienti primari, nutrienti secondari, micronutrienti), per modalità di applicazione (suolo, fogliare, fertirrigazione), per tipo di coltura (cereali e granaglie, semi oleosi e legumi, frutta e verdura) e per regione, tendenze globali e previsioni dal 2022 al 2029
Instant access to hundreds of data points and trends
- Market estimates from 2014-2029
- Competitive analysis, industry segmentation, financial benchmarks
- Incorporates SWOT, Porter's Five Forces and risk management frameworks
- PDF report or online database with Word, Excel and PowerPoint export options
- 100% money back guarantee
Panoramica del mercato globale dei chelati metallici
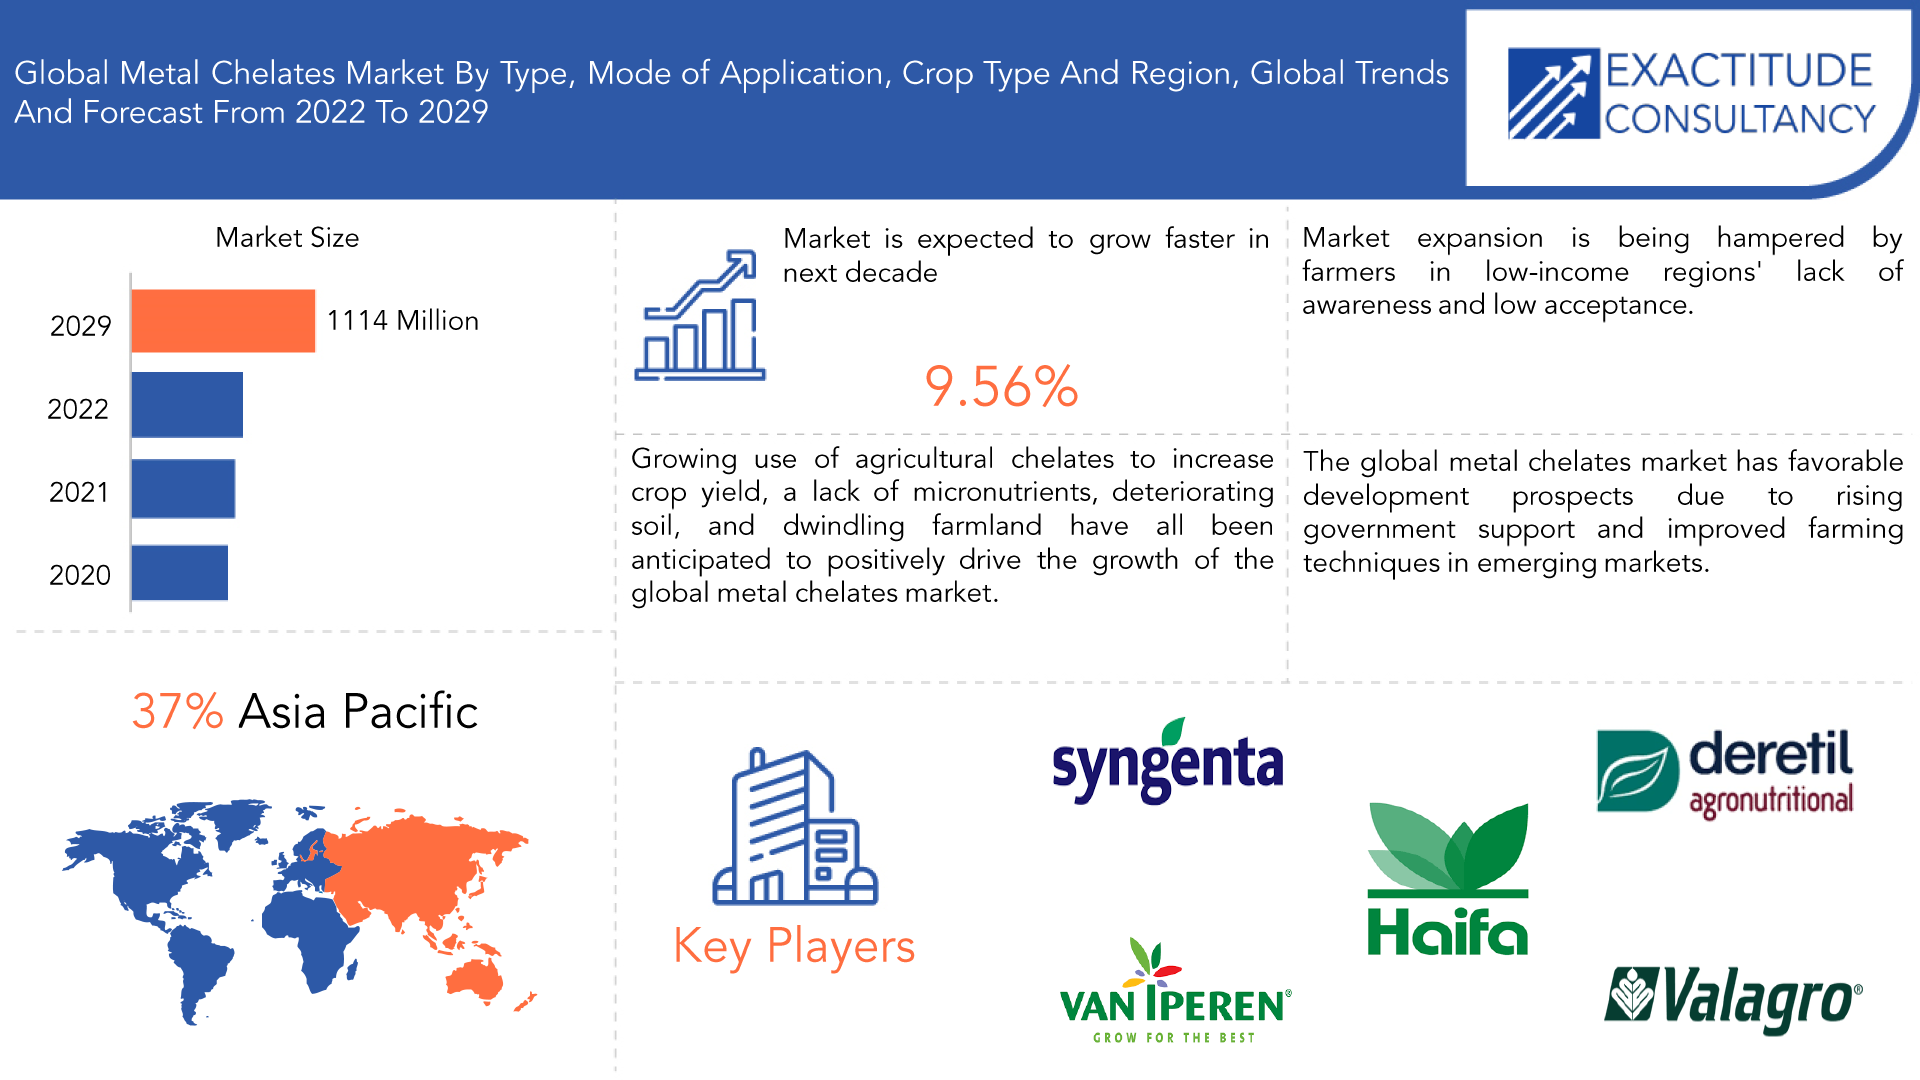
Si prevede che la dimensione del mercato globale dei chelati metallici crescerà a un CAGR superiore al 9,56% dal 2021 al 2029. Si prevede che raggiungerà oltre 1114 milioni di USD entro il 2029 da poco più di 489,8 milioni di USD nel 2020.
Un composto noto come chelato di metallo è uno in cui uno ione metallico ha più siti di legame con un anione. Anche l'equilibrio di sali e micronutrienti del terreno è mantenuto da loro. La chelazione, un processo naturale che impedisce ai minerali assorbiti di precipitare, avviene per evitare che ciò accada. Gli agenti chelanti naturali sono composti organici prodotti da microrganismi e presenti nella terra. Per trasportare e solubilizzare i nutrienti, i microrganismi creano composti organici chiamati siderofori idrossammati. La produzione del raccolto non può essere accelerata dal semplice fatto che esistano agenti chelanti naturali. La maggior parte dei chelati di ferro sintetici viene utilizzata per nutrire le colture carenti di ferro. Il chelato di metallo è utilizzato principalmente come fertilizzante nel settore agricolo. Per promuovere uno sviluppo sano delle piante, vengono anche aggiunti al terreno. EDDHA, EDTA e DTPA sono alcuni dei chelati più apprezzati. I principali utenti finali dei chelati agricoli sono comunità agricole, agricoltori e fornitori di colture. La tecnica della chelazione viene utilizzata anche in campo medico, negli scanner MRI e nelle procedure in cui è necessario rimuovere metalli dal corpo.
Il mercato globale dei chelati metallici ha beneficiato del notevole progresso delle tecniche agricole per un'elevata resa. Come fertilizzanti micronutrienti per l'assorbimento di ioni metallici da parte di diverse piante, i chelati metallici sono utilizzati principalmente nelle aree agricole. Ciò è dovuto al fatto che gli ioni idrossido caricati negativamente (OH-), come quelli prodotti dalle reazioni degli ioni metallici Fe+2, Zn+2, Mn+2 e Cu+2, sono facilmente accessibili alle piante. Per proteggere lo ione metallico dagli ioni OH- vicini, il metallo viene incapsulato in un chelato metallico. Da ciò deriverà un'espansione del mercato. Un ulteriore fattore che spinge la domanda a livello globale è la crescente consapevolezza delle carenze di nutrienti delle colture e il calo della qualità del suolo. Inoltre, si prevede che fattori come il crescente utilizzo di chelati agricoli per aumentare la resa delle colture, la mancanza di micronutrienti nel suolo , il deterioramento della qualità del suolo e la riduzione dei terreni agricoli influenzeranno positivamente lo sviluppo del mercato globale dei chelati metallici.
| ATTRIBUTO | DETTAGLI |
| Periodo di studio | 2020-2029 |
| Anno base | 2021 |
| Anno stimato | 2022 |
| Anno previsto | 2022-2029 |
| Periodo storico | 2018-2020 |
| Unità | Valore (milioni di USD), (chilotoni) |
| Segmentazione | Per tipo, per modalità di applicazione, per tipo di coltura, per regione |
| Per tipo |
|
| Per modalità di applicazione |
|
| Per tipo di coltura |
|
| Per regione |
|
Il mercato non si espanderà così rapidamente nel complesso a causa di alcune restrizioni e difficoltà. L'effetto dei chelati metallici non biodegradabili è solo uno dei fattori che impediscono al mercato di espandersi. Nelle regioni a basso reddito, si prevede anche che ci sarà un lento sviluppo della mancanza di consapevolezza e della bassa accettazione tra gli agricoltori. Il mercato globale dei chelati metallici, tuttavia, potrebbe essere influenzato negli anni a venire dall'innovazione tecnologica e di prodotto. Il mercato globale dei chelati metallici ha anche prospettive di sviluppo favorevoli grazie al crescente sostegno governativo e alle tecniche agricole migliorate nei mercati emergenti.
Quasi ogni settore e industria a livello globale è stato colpito dall'epidemia di COVID-19. Per rallentare la rapida diffusione della pandemia, i governi di tutto il mondo hanno emanato rigide normative di lockdown e standard di segregazione sociale. A causa della pandemia, il governo ha dovuto imporre divieti di viaggio e altre restrizioni e diverse nazioni hanno dovuto entrare in lockdown completo. Durante le prime fasi della pandemia, gli impianti di produzione in tutto il mondo sono stati chiusi. La produzione di fertilizzanti , detersivi, prodotti per la pulizia, tessuti, lavorazione della cellulosa e della carta e soluzioni per la pulizia di bucato e metalli è diminuita a causa di questa lava. Di conseguenza, lo sviluppo del mercato è stato ostacolato e la domanda di chelati metallici è diminuita.
[caption id="allegato_22679" align="aligncenter" width="1920"]
Frequently Asked Questions
Who are the key players in the global metal chelates market?
Some key players operating in the global metal chelates market include BASF SE, Syngenta AG, Haifa Chemicals Ltd., Van Iperen International, Protex International, AkzoNobel N.V., Nufarm Limited, Aries Agro Limited, Valagro SPA, Deretil Agronutritional.
What are the factors driving the global metal chelates market?
Growing use of agricultural chelates to increase crop yield, a lack of micronutrients, deteriorating soil, and dwindling farmland have all been anticipated to positively drive the growth of the global metal chelates market.
How big is the global metal chelates market?
The global metal chelates market size was estimated at USD 4.14 million in 2021 and is expected to reach USD 1114 million in 2029.
What is the global metal chelates market growth?
The global metal chelates market is expected to grow at a compound annual growth rate of 9.56% from 2022 to 2029 to reach USD 1114 million by 2029.
Which region accounted for the largest global metal chelates market share?
The Asia Pacific dominated the global metal chelates market with a share of 37% in 2021.
Global Metal Chelates Market Segment Analysis
Based on source, market is segmented into primary nutrients, secondary nutrients and micronutrients. The metal chelates market makes extensive use of micronutrients. Micronutrients are necessary, irreplaceable nutrients that are crucial in agriculture because they help boost yield and improve product quality.
These nutrients are effectively supplied by complexes comprising chelated substances like ethylenediaminetetraacetic acid (EDTA), diethylenetriaminepentaacetic acid (DTPA), and ethylenediamine-N, N′-bisphosphate, which are used by plants in very small quantities. (EDDHA). With the help of metal chelates, micronutrients like calcium, iron, manganese, and copper are readily chelated. Micronutrients are extremely rare nutrients that are discovered in soil.
Based on livestock type, market is segmented into soil, foliar and fertigation. The Metal Chelates Market was dominated by Fertigation. Metal chelates are used in fertilization, which increases the availability of nutrients at the root level and the effectiveness of fertilizer use. It also enhances the mobility of potassium and phosphorus, in particular.
Fertigation has many benefits, including regular nutrient supply to minimize variations in nutrient concentration in soil, effective nutrient utilization, exact nutrient application in accordance with crop nutritional needs, and many others. Additionally, a well-planned fertilization system can greatly lower the cost of fertilizer application and give nutrients to the wet irrigation zone surrounding the tree, where the active feeder roots are concentrated in precise and uniform amounts.
Based on the form, market is segmented into cereals & grains, oilseeds & pulses and fruits & vegetables. In the market for metal chelates, fruits and veggies are frequently used. The formulators of food have unique skills thanks to chelating agents made for food. In particular, food degradation reactions are catalyzed by trace quantities of pro-oxidant metal ions, like copper and iron. The oxidation of flavor and color is specifically catalyzed and started by metal chelates.
Moreover, trace metal ions shorten the quality and storage life of food and beverages by causing a number of spoilage reactions. The extremely pure food-grade chelate stops unfavorable responses to food deterioration by forming a stable complex with trace metal ions. Trace metal ions, which are found in all processed food products due to raw materials, process water, and equipment, contribute to the spoilage reactions that affect many processed food products.
[caption id="attachment_22681" align="aligncenter" width="1920"]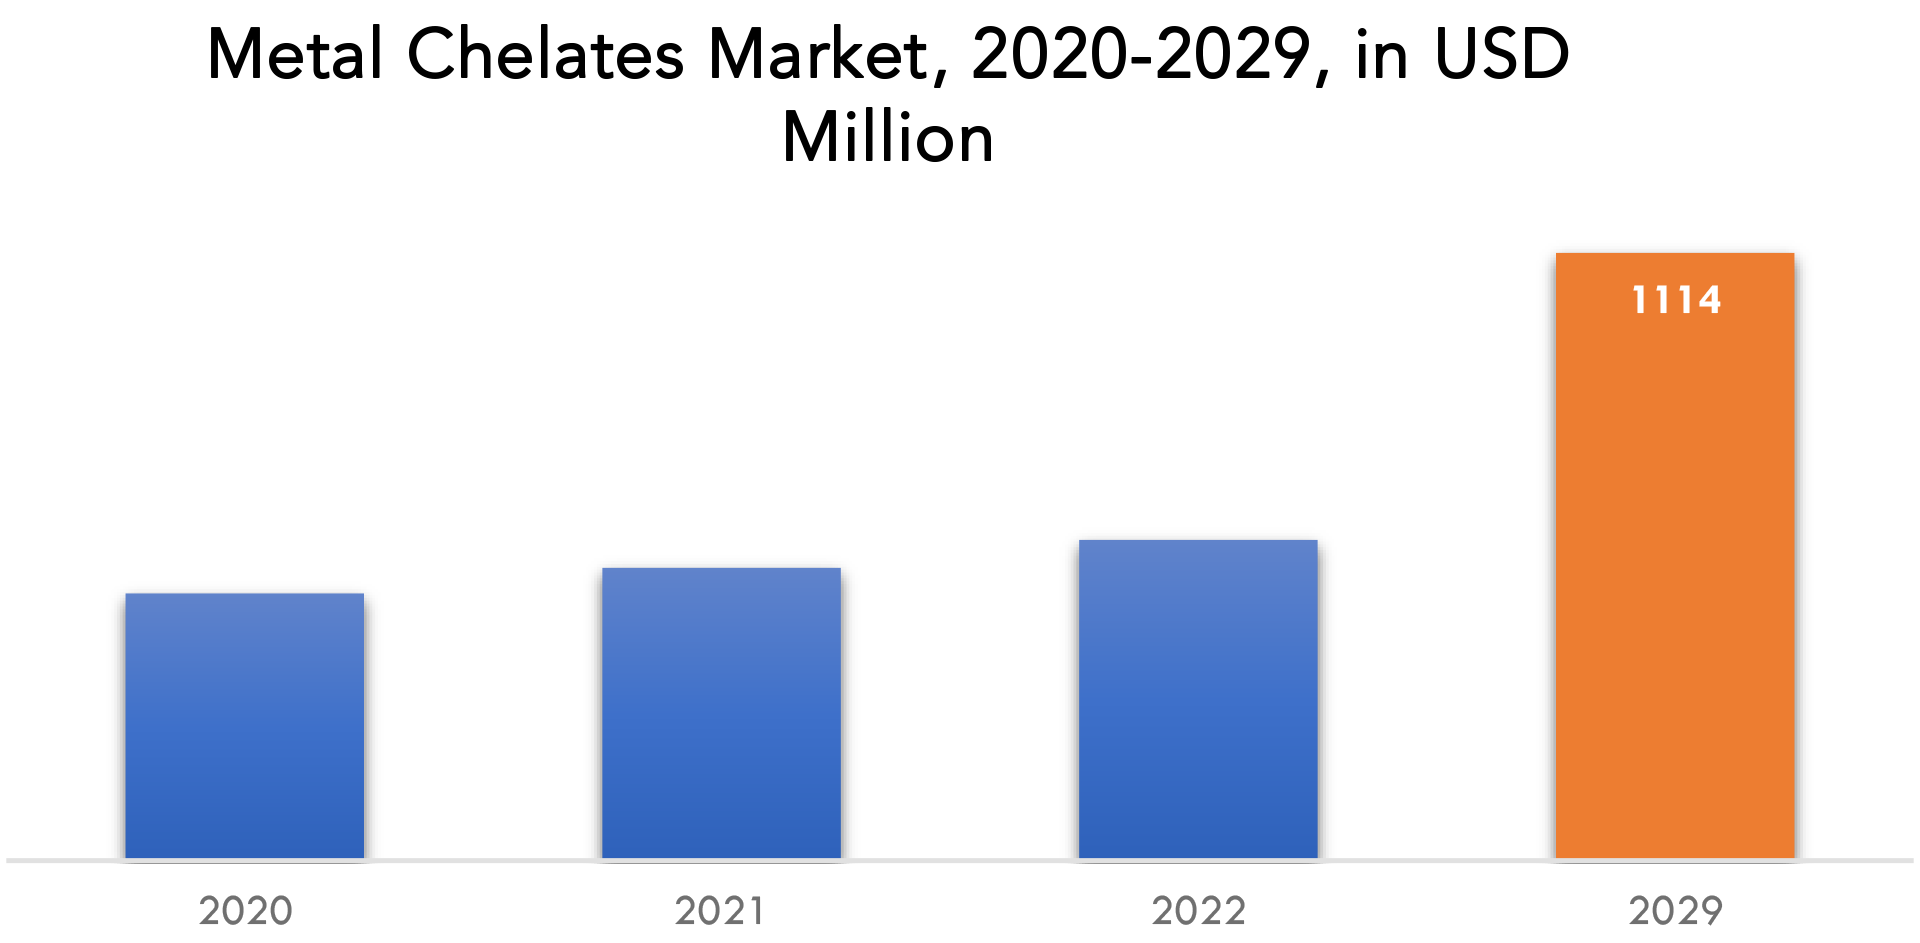
Global Metal Chelates Market Key Players:
Key competitors from both domestic and international markets compete fiercely in the worldwide global Metal Chelates industry are BASF SE, Syngenta AG, Haifa Chemicals Ltd., Van Iperen International, Protex International, AkzoNobel N.V., Nufarm Limited, Aries Agro Limited, Valagro SPA, Deretil Agronutritional.
Recent News: 6th October 2020: Valagro, a pioneer in the research, production and commercialization of biostimulants and specialty nutrients for crops, signed an agreement to transfer 100% of its ownership and assets to Syngenta Crop Protection. 2nd December 2022: AkzoNobel completed the acquisition of the wheel liquid coatings business of Lankwitzer Lackfabrik GmbH, a deal which strengthens the company’s performance coatings portfolio.Who Should Buy? Or Key stakeholders
- Global Metal Chelates Suppliers
- Investors
- Metal Chelates Manufacturer
- Regulatory Authorities
- Consultants
- Research and Development Organizations
- Farmers
- Government
- Others
Global Metal Chelates Market Regional Analysis
The global metal chelates market by region includes North America, Asia-Pacific (APAC), Europe, South America, and Middle East & Africa (MEA).
- North America: includes the US, Canada, Mexico
- Asia Pacific: includes China, Japan, South Korea, India, Australia, ASEAN and Rest of APAC
- Europe: includes UK, Germany, France, Italy, Spain, Russia, and Rest of Europe
- South America: includes Brazil, Argentina and Rest of South America
- Middle East & Africa: includes Turkey, UAE, Saudi Arabia, South Africa, and Rest of MEA

In terms of market dominance for metal chelates, Asia Pacific was in the lead. A result of the region's expanding population, available land, and micronutrient-deficient soil, the Asia Pacific is predicted to lead the global market for metal chelates. Asia Pacific farmers are being pressured to cultivate high yield crops through the use of external growth-promoting agents as a result of the region's rapidly growing population and higher food demand. An important portion of the global market for metal chelates is anticipated to be held by the Asia Pacific region.
Due to increased investments in agricultural infrastructure, including irrigation systems, warehousing, and cold storage, the agriculture industry in India is predicted to gain more momentum in the coming years, according to the India Brand Equity Foundation. Additionally, the increased use of genetically modified crops is probably going to increase the yields of Indian producers. The quickly increasing population, the accessibility of arable land, and the zinc-deficient soils in China and India are the main causes of the high growth in the APAC market for metal chelates.
Key Market Segments: Global Metal Chelates Market
Global Metal Chelates Market By Type, 2020-2029, (USD Million), (Kilotons)- Primary Nutrients
- Secondary Nutrients
- Micronutrients
- Soil
- Foliar
- Fertigation
- Cereals & Grains
- Oilseeds & Pulses
- Fruits & Vegetables
- North America
- Europe
- Asia Pacific
- South America
- Middle East And Africa
Exactitude Consultancy Services Key Objectives:
- Increasing sales and market share
- Developing new technology
- Improving profitability
- Entering new markets
- Enhancing brand reputation
Key Question Answered
- What is the expected growth rate of the metal chelates market over the next 7 years?
- Who are the major players in the metal chelates market and what is their market share?
- What are the end-user industries driving demand for market and what is their outlook?
- What are the opportunities for growth in emerging markets such as Asia-Pacific, Middle East, and Africa?
- How is the economic environment affecting the metal chelates market, including factors such as interest rates, inflation, and exchange rates?
- What is the expected impact of government policies and regulations on the metal chelates market?
- What is the current and forecasted size and growth rate of the global metal chelates market?
- What are the key drivers of growth in the metal chelates market?
- What are the distribution channels and supply chain dynamics in the metal chelates market?
- What are the technological advancements and innovations in the metal chelates market and their impact on product development and growth?
- What are the regulatory considerations and their impact on the market?
- What are the challenges faced by players in the metal chelates market and how are they addressing these challenges?
- What are the opportunities for growth and expansion in the metal chelates market?
- What are the product offerings and specifications of leading players in the market?
- What is the pricing trend of Metal Chelates’ in the market and what is the impact of raw material prices on the price trend?
- INTRODUZIONE
- DEFINIZIONE DI MERCATO
- SEGMENTAZIONE DEL MERCATO
- TEMPI DI RICERCA
- ASSUNZIONI E LIMITAZIONI
- METODOLOGIA DI RICERCA
- ESTRAZIONE DATI
- RICERCA SECONDARIA
- RICERCA PRIMARIA
- PARERI DEGLI ESPERTI IN MATERIA
- CONTROLLI DI QUALITÀ
- RECENSIONE FINALE
- TRIANGOLAZIONE DEI DATI
- APPROCCIO DAL BASSO VERSO L'ALTO
- APPROCCIO TOP-DOWN
- FLUSSO DI RICERCA
- FONTI DEI DATI
- ESTRAZIONE DATI
- SINTESI
- PANORAMICA DEL MERCATO
- PROSPETTIVE DEL MERCATO GLOBALE DEI CHELATI METALLICI
- FATTORI DI MERCATO
- LIMITAZIONI DI MERCATO
- OPPORTUNITÀ DI MERCATO
- IMPATTO DEL COVID-19 SUL MERCATO GLOBALE DEI CHELATI METALLICI
- MODELLO DELLE CINQUE FORZE DI PORTER
- MINACCIA DAI NUOVI ENTRANSI
- MINACCIA DA SOSTITUTI
- POTERE CONTRATTUALE DEI FORNITORI
- POTERE CONTRATTUALE DEI CLIENTI
- GRADO DI COMPETIZIONE
- ANALISI DELLA CATENA DEL VALORE DEL SETTORE
- PROSPETTIVE DEL MERCATO GLOBALE DEI CHELATI METALLICI
- MERCATO GLOBALE DEI CHELATI METALLICI PER TIPO, 2020-2029, (MILIONI DI USD), (KILOTONI)
- NUTRIENTI PRIMARI
- NUTRIENTI SECONDARI
- MICRONUTRIENTI
- MERCATO GLOBALE DEI CHELATI METALLICI PER MODALITÀ DI APPLICAZIONE, 2020-2029, (MILIONI DI USD), (KILOTONI)
- SUOLO
- FOGLIARE
- FERTIRRIGAZIONE
- GLOBAL METAL CHELATES MARKET BY CROP TYPE, 2020-2029, (USD MILLION), (KILOTONS)
- CEREALS & GRAIN
- OILSEEDS & PULSES
- FRUITS & VEGETABLES
- GLOBAL METAL CHELATES MARKET BY REGION, 2020-2029, (USD MILLION), (KILOTONS)
- NORTH AMERICA
- US
- CANADA
- MEXICO
- SOUTH AMERICA
- BRAZIL
- ARGENTINA
- COLOMBIA
- REST OF SOUTH AMERICA
- EUROPE
- GERMANY
- UK
- FRANCE
- ITALY
- SPAIN
- RUSSIA
- REST OF EUROPE
- ASIA PACIFIC
- INDIA
- CHINA
- JAPAN
- SOUTH KOREA
- AUSTRALIA
- SOUTH-EAST ASIA
- REST OF ASIA PACIFIC
- MIDDLE EAST AND AFRICA
- UAE
- SAUDI ARABIA
- SOUTH AFRICA
- REST OF MIDDLE EAST AND AFRICA
- NORTH AMERICA
- COMPANY PROFILES* (BUSINESS OVERVIEW, COMPANY SNAPSHOT, PRODUCTS OFFERED, RECENT DEVELOPMENTS)
- BASF SE
- SYNGENTA AG
- HAIFA CHEMICALS LTD.
- VAN IPEREN INTERNATIONAL
- PROTEX INTERNATIONAL
- AKZONOBEL N.V.
- DERETIL AGRONUTRITIONAL
- NUFARM LIMITED
- ARIES AGRO LIMITED
- VALAGRO SPA *THE COMPANY LIST IS INDICATIVE
LIST OF TABLES
TABLE 1 GLOBAL METAL CHELATES MARKET BY TYPE (USD MILLION) 2020-2029
TABLE 2 GLOBAL METAL CHELATES MARKET BY TYPE (KILOTONS) 2020-2029
TABLE 3 GLOBAL METAL CHELATES MARKET BY CROP TYPE (USD MILLION) 2020-2029
TABLE 4 GLOBAL METAL CHELATES MARKET BY CROP TYPE (KILOTONS) 2020-2029
TABLE 5 GLOBAL METAL CHELATES MARKET BY MODE OF APPLICATION (USD MILLION) 2020-2029
TABLE 6 GLOBAL METAL CHELATES MARKET BY MODE OF APPLICATION (KILOTONS) 2020-2029
TABLE 7 GLOBAL METAL CHELATES MARKET BY REGION (USD MILLION) 2020-2029
TABLE 8 GLOBAL METAL CHELATES MARKET BY REGION (KILOTONS) 2020-2029
TABLE 9 NORTH AMERICA METAL CHELATES MARKET BY COUNTRY (USD MILLION) 2020-2029
TABLE 10 NORTH AMERICA METAL CHELATES MARKET BY COUNTRY (KILOTONS) 2020-2029
TABLE 11 NORTH AMERICA METAL CHELATES MARKET BY TYPE (USD MILLION) 2020-2029
TABLE 12 NORTH AMERICA METAL CHELATES MARKET BY TYPE (KILOTONS) 2020-2029
TABLE 13 NORTH AMERICA METAL CHELATES MARKET BY CROP TYPE (USD MILLION) 2020-2029
TABLE 14 NORTH AMERICA METAL CHELATES MARKET BY CROP TYPE (KILOTONS) 2020-2029
TABLE 15 NORTH AMERICA METAL CHELATES MARKET BY MODE OF APPLICATION (USD MILLION) 2020-2029
TABLE 16 NORTH AMERICA METAL CHELATES MARKET BY MODE OF APPLICATION (KILOTONS) 2020-2029
TABLE 17 US METAL CHELATES MARKET BY TYPE (USD MILLION) 2020-2029
TABLE 18 US METAL CHELATES MARKET BY TYPE (KILOTONS) 2020-2029
TABLE 19 US METAL CHELATES MARKET BY CROP TYPE (USD MILLION) 2020-2029
TABLE 20 US METAL CHELATES MARKET BY CROP TYPE (KILOTONS) 2020-2029
TABLE 21 US METAL CHELATES MARKET BY MODE OF APPLICATION (USD MILLION) 2020-2029
TABLE 22 US METAL CHELATES MARKET BY MODE OF APPLICATION (KILOTONS) 2020-2029
TABLE 23 CANADA METAL CHELATES MARKET BY TYPE (USD MILLION) 2020-2029
TABLE 24 CANADA METAL CHELATES MARKET BY TYPE (KILOTONS) 2020-2029
TABLE 25 CANADA METAL CHELATES MARKET BY CROP TYPE (USD MILLION) 2020-2029
TABLE 26 CANADA METAL CHELATES MARKET BY CROP TYPE (KILOTONS) 2020-2029
TABLE 27 CANADA METAL CHELATES MARKET BY MODE OF APPLICATION (USD MILLION) 2020-2029
TABLE 28 CANADA METAL CHELATES MARKET BY MODE OF APPLICATION (KILOTONS) 2020-2029
TABLE 29 MEXICO METAL CHELATES MARKET BY TYPE (USD MILLION) 2020-2029
TABLE 30 MEXICO METAL CHELATES MARKET BY TYPE (KILOTONS) 2020-2029
TABLE 31 MEXICO METAL CHELATES MARKET BY CROP TYPE (USD MILLION) 2020-2029
TABLE 32 MEXICO METAL CHELATES MARKET BY CROP TYPE (KILOTONS) 2020-2029
TABLE 33 MEXICO METAL CHELATES MARKET BY MODE OF APPLICATION (USD MILLION) 2020-2029
TABLE 34 MEXICO METAL CHELATES MARKET BY MODE OF APPLICATION (KILOTONS) 2020-2029
TABLE 35 SOUTH AMERICA METAL CHELATES MARKET BY COUNTRY (USD MILLION) 2020-2029
TABLE 36 SOUTH AMERICA METAL CHELATES MARKET BY COUNTRY (KILOTONS) 2020-2029
TABLE 37 SOUTH AMERICA METAL CHELATES MARKET BY TYPE (USD MILLION) 2020-2029
TABLE 38 SOUTH AMERICA METAL CHELATES MARKET BY TYPE (KILOTONS) 2020-2029
TABLE 39 SOUTH AMERICA METAL CHELATES MARKET BY CROP TYPE (USD MILLION) 2020-2029
TABLE 40 SOUTH AMERICA METAL CHELATES MARKET BY CROP TYPE (KILOTONS) 2020-2029
TABLE 41 SOUTH AMERICA METAL CHELATES MARKET BY MODE OF APPLICATION (USD MILLION) 2020-2029
TABLE 42 SOUTH AMERICA METAL CHELATES MARKET BY MODE OF APPLICATION (KILOTONS) 2020-2029
TABLE 43 BRAZIL METAL CHELATES MARKET BY TYPE (USD MILLION) 2020-2029
TABLE 44 BRAZIL METAL CHELATES MARKET BY TYPE (KILOTONS) 2020-2029
TABLE 45 BRAZIL METAL CHELATES MARKET BY CROP TYPE (USD MILLION) 2020-2029
TABLE 46 BRAZIL METAL CHELATES MARKET BY CROP TYPE (KILOTONS) 2020-2029
TABLE 47 BRAZIL METAL CHELATES MARKET BY MODE OF APPLICATION (USD MILLION) 2020-2029
TABLE 48 BRAZIL METAL CHELATES MARKET BY MODE OF APPLICATION (KILOTONS) 2020-2029
TABLE 49 ARGENTINA METAL CHELATES MARKET BY TYPE (USD MILLION) 2020-2029
TABLE 50 ARGENTINA METAL CHELATES MARKET BY TYPE (KILOTONS) 2020-2029
TABLE 51 ARGENTINA METAL CHELATES MARKET BY CROP TYPE (USD MILLION) 2020-2029
TABLE 52 ARGENTINA METAL CHELATES MARKET BY CROP TYPE (KILOTONS) 2020-2029
TABLE 53 ARGENTINA METAL CHELATES MARKET BY MODE OF APPLICATION (USD MILLION) 2020-2029
TABLE 54 ARGENTINA METAL CHELATES MARKET BY MODE OF APPLICATION (KILOTONS) 2020-2029
TABLE 55 COLOMBIA METAL CHELATES MARKET BY TYPE (USD MILLION) 2020-2029
TABLE 56 COLOMBIA METAL CHELATES MARKET BY TYPE (KILOTONS) 2020-2029
TABLE 57 COLOMBIA METAL CHELATES MARKET BY CROP TYPE (USD MILLION) 2020-2029
TABLE 58 COLOMBIA METAL CHELATES MARKET BY CROP TYPE (KILOTONS) 2020-2029
TABLE 59 COLOMBIA METAL CHELATES MARKET BY MODE OF APPLICATION (USD MILLION) 2020-2029
TABLE 60 COLOMBIA METAL CHELATES MARKET BY MODE OF APPLICATION (KILOTONS) 2020-2029
TABLE 61 REST OF SOUTH AMERICA METAL CHELATES MARKET BY TYPE (USD MILLION) 2020-2029
TABLE 62 REST OF SOUTH AMERICA METAL CHELATES MARKET BY TYPE (KILOTONS) 2020-2029
TABLE 63 REST OF SOUTH AMERICA METAL CHELATES MARKET BY CROP TYPE (USD MILLION) 2020-2029
TABLE 64 REST OF SOUTH AMERICA METAL CHELATES MARKET BY CROP TYPE (KILOTONS) 2020-2029
TABLE 65 REST OF SOUTH AMERICA METAL CHELATES MARKET BY MODE OF APPLICATION (USD MILLION) 2020-2029
TABLE 66 REST OF SOUTH AMERICA METAL CHELATES MARKET BY MODE OF APPLICATION (KILOTONS) 2020-2029
TABLE 67 ASIA-PACIFIC METAL CHELATES MARKET BY COUNTRY (USD MILLION) 2020-2029
TABLE 68 ASIA-PACIFIC METAL CHELATES MARKET BY COUNTRY (KILOTONS) 2020-2029
TABLE 69 ASIA-PACIFIC METAL CHELATES MARKET BY TYPE (USD MILLION) 2020-2029
TABLE 70 ASIA-PACIFIC METAL CHELATES MARKET BY TYPE (KILOTONS) 2020-2029
TABLE 71 ASIA-PACIFIC METAL CHELATES MARKET BY CROP TYPE (USD MILLION) 2020-2029
TABLE 72 ASIA-PACIFIC METAL CHELATES MARKET BY CROP TYPE (KILOTONS) 2020-2029
TABLE 73 ASIA-PACIFIC METAL CHELATES MARKET BY MODE OF APPLICATION (USD MILLION) 2020-2029
TABLE 74 ASIA-PACIFIC METAL CHELATES MARKET BY MODE OF APPLICATION (KILOTONS) 2020-2029
TABLE 75 INDIA METAL CHELATES MARKET BY TYPE (USD MILLION) 2020-2029
TABLE 76 INDIA METAL CHELATES MARKET BY TYPE (KILOTONS) 2020-2029
TABLE 77 INDIA METAL CHELATES MARKET BY CROP TYPE (USD MILLION) 2020-2029
TABLE 78 INDIA METAL CHELATES MARKET BY CROP TYPE (KILOTONS) 2020-2029
TABLE 79 INDIA METAL CHELATES MARKET BY MODE OF APPLICATION (USD MILLION) 2020-2029
TABLE 80 INDIA METAL CHELATES MARKET BY MODE OF APPLICATION (KILOTONS) 2020-2029
TABLE 81 CHINA METAL CHELATES MARKET BY TYPE (USD MILLION) 2020-2029
TABLE 82 CHINA METAL CHELATES MARKET BY TYPE (KILOTONS) 2020-2029
TABLE 83 CHINA METAL CHELATES MARKET BY CROP TYPE (USD MILLION) 2020-2029
TABLE 84 CHINA METAL CHELATES MARKET BY CROP TYPE (KILOTONS) 2020-2029
TABLE 85 CHINA METAL CHELATES MARKET BY MODE OF APPLICATION (USD MILLION) 2020-2029
TABLE 86 CHINA METAL CHELATES MARKET BY MODE OF APPLICATION (KILOTONS) 2020-2029
TABLE 87 JAPAN METAL CHELATES MARKET BY TYPE (USD MILLION) 2020-2029
TABLE 88 JAPAN METAL CHELATES MARKET BY TYPE (KILOTONS) 2020-2029
TABLE 89 JAPAN METAL CHELATES MARKET BY CROP TYPE (USD MILLION) 2020-2029
TABLE 90 JAPAN METAL CHELATES MARKET BY CROP TYPE (KILOTONS) 2020-2029
TABLE 91 JAPAN METAL CHELATES MARKET BY MODE OF APPLICATION (USD MILLION) 2020-2029
TABLE 92 JAPAN METAL CHELATES MARKET BY MODE OF APPLICATION (KILOTONS) 2020-2029
TABLE 93 SOUTH KOREA METAL CHELATES MARKET BY TYPE (USD MILLION) 2020-2029
TABLE 94 SOUTH KOREA METAL CHELATES MARKET BY TYPE (KILOTONS) 2020-2029
TABLE 95 SOUTH KOREA METAL CHELATES MARKET BY CROP TYPE (USD MILLION) 2020-2029
TABLE 96 SOUTH KOREA METAL CHELATES MARKET BY CROP TYPE (KILOTONS) 2020-2029
TABLE 97 SOUTH KOREA METAL CHELATES MARKET BY MODE OF APPLICATION (USD MILLION) 2020-2029
TABLE 98 SOUTH KOREA METAL CHELATES MARKET BY MODE OF APPLICATION (KILOTONS) 2020-2029
TABLE 99 AUSTRALIA METAL CHELATES MARKET BY TYPE (USD MILLION) 2020-2029
TABLE 100 AUSTRALIA METAL CHELATES MARKET BY TYPE (KILOTONS) 2020-2029
TABLE 101 AUSTRALIA METAL CHELATES MARKET BY CROP TYPE (USD MILLION) 2020-2029
TABLE 102 AUSTRALIA METAL CHELATES MARKET BY CROP TYPE (KILOTONS) 2020-2029
TABLE 103 AUSTRALIA METAL CHELATES MARKET BY MODE OF APPLICATION (USD MILLION) 2020-2029
TABLE 104 AUSTRALIA METAL CHELATES MARKET BY MODE OF APPLICATION (KILOTONS) 2020-2029
TABLE 105 SOUTH-EAST ASIA METAL CHELATES MARKET BY TYPE (USD MILLION) 2020-2029
TABLE 106 SOUTH-EAST ASIA METAL CHELATES MARKET BY TYPE (KILOTONS) 2020-2029
TABLE 107 SOUTH-EAST ASIA METAL CHELATES MARKET BY CROP TYPE (USD MILLION) 2020-2029
TABLE 108 SOUTH-EAST ASIA METAL CHELATES MARKET BY CROP TYPE (KILOTONS) 2020-2029
TABLE 109 SOUTH-EAST ASIA METAL CHELATES MARKET BY MODE OF APPLICATION (USD MILLION) 2020-2029
TABLE 110 SOUTH-EAST ASIA METAL CHELATES MARKET BY MODE OF APPLICATION (KILOTONS) 2020-2029
TABLE 111 REST OF ASIA PACIFIC METAL CHELATES MARKET BY TYPE (USD MILLION) 2020-2029
TABLE 112 REST OF ASIA PACIFIC METAL CHELATES MARKET BY TYPE (KILOTONS) 2020-2029
TABLE 113 REST OF ASIA PACIFIC METAL CHELATES MARKET BY CROP TYPE (USD MILLION) 2020-2029
TABLE 114 REST OF ASIA PACIFIC METAL CHELATES MARKET BY CROP TYPE (KILOTONS) 2020-2029
TABLE 115 REST OF ASIA PACIFIC METAL CHELATES MARKET BY MODE OF APPLICATION (USD MILLION) 2020-2029
TABLE 116 REST OF ASIA PACIFIC METAL CHELATES MARKET BY MODE OF APPLICATION (KILOTONS) 2020-2029
TABLE 117 EUROPE METAL CHELATES MARKET BY COUNTRY (USD MILLION) 2020-2029
TABLE 118 EUROPE METAL CHELATES MARKET BY COUNTRY (KILOTONS) 2020-2029
TABLE 119 EUROPE METAL CHELATES MARKET BY TYPE (USD MILLION) 2020-2029
TABLE 120 EUROPE METAL CHELATES MARKET BY TYPE (KILOTONS) 2020-2029
TABLE 121 EUROPE METAL CHELATES MARKET BY CROP TYPE (USD MILLION) 2020-2029
TABLE 122 EUROPE METAL CHELATES MARKET BY CROP TYPE (KILOTONS) 2020-2029
TABLE 123 EUROPE METAL CHELATES MARKET BY MODE OF APPLICATION (USD MILLION) 2020-2029
TABLE 124 EUROPE METAL CHELATES MARKET BY MODE OF APPLICATION (KILOTONS) 2020-2029
TABLE 125 GERMANY METAL CHELATES MARKET BY TYPE (USD MILLION) 2020-2029
TABLE 126 GERMANY METAL CHELATES MARKET BY TYPE (KILOTONS) 2020-2029
TABLE 127 GERMANY METAL CHELATES MARKET BY CROP TYPE (USD MILLION) 2020-2029
TABLE 128 GERMANY METAL CHELATES MARKET BY CROP TYPE (KILOTONS) 2020-2029
TABLE 129 GERMANY METAL CHELATES MARKET BY MODE OF APPLICATION (USD MILLION) 2020-2029
TABLE 130 GERMANY METAL CHELATES MARKET BY MODE OF APPLICATION (KILOTONS) 2020-2029
TABLE 131 UK METAL CHELATES MARKET BY TYPE (USD MILLION) 2020-2029
TABLE 132 UK METAL CHELATES MARKET BY TYPE (KILOTONS) 2020-2029
TABLE 133 UK METAL CHELATES MARKET BY CROP TYPE (USD MILLION) 2020-2029
TABLE 134 UK METAL CHELATES MARKET BY CROP TYPE (KILOTONS) 2020-2029
TABLE 135 UK METAL CHELATES MARKET BY MODE OF APPLICATION (USD MILLION) 2020-2029
TABLE 136 UK METAL CHELATES MARKET BY MODE OF APPLICATION (KILOTONS) 2020-2029
TABLE 137 FRANCE METAL CHELATES MARKET BY TYPE (USD MILLION) 2020-2029
TABLE 138 FRANCE METAL CHELATES MARKET BY TYPE (KILOTONS) 2020-2029
TABLE 139 FRANCE METAL CHELATES MARKET BY CROP TYPE (USD MILLION) 2020-2029
TABLE 140 FRANCE METAL CHELATES MARKET BY CROP TYPE (KILOTONS) 2020-2029
TABLE 141 FRANCE METAL CHELATES MARKET BY MODE OF APPLICATION (USD MILLION) 2020-2029
TABLE 142 FRANCE METAL CHELATES MARKET BY MODE OF APPLICATION (KILOTONS) 2020-2029
TABLE 143 ITALY METAL CHELATES MARKET BY TYPE (USD MILLION) 2020-2029
TABLE 144 ITALY METAL CHELATES MARKET BY TYPE (KILOTONS) 2020-2029
TABLE 145 ITALY METAL CHELATES MARKET BY CROP TYPE (USD MILLION) 2020-2029
TABLE 146 ITALY METAL CHELATES MARKET BY CROP TYPE (KILOTONS) 2020-2029
TABLE 147 ITALY METAL CHELATES MARKET BY MODE OF APPLICATION (USD MILLION) 2020-2029
TABLE 148 ITALY METAL CHELATES MARKET BY MODE OF APPLICATION (KILOTONS) 2020-2029
TABLE 149 SPAIN METAL CHELATES MARKET BY TYPE (USD MILLION) 2020-2029
TABLE 150 SPAIN METAL CHELATES MARKET BY TYPE (KILOTONS) 2020-2029
TABLE 151 SPAIN METAL CHELATES MARKET BY CROP TYPE (USD MILLION) 2020-2029
TABLE 152 SPAIN METAL CHELATES MARKET BY CROP TYPE (KILOTONS) 2020-2029
TABLE 153 SPAIN METAL CHELATES MARKET BY MODE OF APPLICATION (USD MILLION) 2020-2029
TABLE 154 SPAIN METAL CHELATES MARKET BY MODE OF APPLICATION (KILOTONS) 2020-2029
TABLE 155 RUSSIA METAL CHELATES MARKET BY TYPE (USD MILLION) 2020-2029
TABLE 156 RUSSIA METAL CHELATES MARKET BY TYPE (KILOTONS) 2020-2029
TABLE 157 RUSSIA METAL CHELATES MARKET BY CROP TYPE (USD MILLION) 2020-2029
TABLE 158 RUSSIA METAL CHELATES MARKET BY CROP TYPE (KILOTONS) 2020-2029
TABLE 159 RUSSIA METAL CHELATES MARKET BY MODE OF APPLICATION (USD MILLION) 2020-2029
TABLE 160 RUSSIA METAL CHELATES MARKET BY MODE OF APPLICATION (KILOTONS) 2020-2029
TABLE 161 REST OF EUROPE METAL CHELATES MARKET BY TYPE (USD MILLION) 2020-2029
TABLE 162 REST OF EUROPE METAL CHELATES MARKET BY TYPE (KILOTONS) 2020-2029
TABLE 163 REST OF EUROPE METAL CHELATES MARKET BY CROP TYPE (USD MILLION) 2020-2029
TABLE 164 REST OF EUROPE METAL CHELATES MARKET BY CROP TYPE (KILOTONS) 2020-2029
TABLE 165 REST OF EUROPE METAL CHELATES MARKET BY MODE OF APPLICATION (USD MILLION) 2020-2029
TABLE 166 REST OF EUROPE METAL CHELATES MARKET BY MODE OF APPLICATION (KILOTONS) 2020-2029
TABLE 167 MIDDLE EAST AND AFRICA METAL CHELATES MARKET BY COUNTRY (USD MILLION) 2020-2029
TABLE 168 MIDDLE EAST AND AFRICA METAL CHELATES MARKET BY COUNTRY (KILOTONS) 2020-2029
TABLE 169 MIDDLE EAST AND AFRICA METAL CHELATES MARKET BY TYPE (USD MILLION) 2020-2029
TABLE 170 MIDDLE EAST AND AFRICA METAL CHELATES MARKET BY TYPE (KILOTONS) 2020-2029
TABLE 171 MIDDLE EAST AND AFRICA METAL CHELATES MARKET BY CROP TYPE (USD MILLION) 2020-2029
TABLE 172 MIDDLE EAST AND AFRICA METAL CHELATES MARKET BY CROP TYPE (KILOTONS) 2020-2029
TABLE 173 MIDDLE EAST AND AFRICA METAL CHELATES MARKET BY MODE OF APPLICATION (USD MILLION) 2020-2029
TABLE 174 MIDDLE EAST AND AFRICA METAL CHELATES MARKET BY MODE OF APPLICATION (KILOTONS) 2020-2029
TABLE 175 UAE METAL CHELATES MARKET BY TYPE (USD MILLION) 2020-2029
TABLE 176 UAE METAL CHELATES MARKET BY TYPE (KILOTONS) 2020-2029
TABLE 177 UAE METAL CHELATES MARKET BY CROP TYPE (USD MILLION) 2020-2029
TABLE 178 UAE METAL CHELATES MARKET BY CROP TYPE (KILOTONS) 2020-2029
TABLE 179 UAE METAL CHELATES MARKET BY MODE OF APPLICATION (USD MILLION) 2020-2029
TABLE 180 UAE METAL CHELATES MARKET BY MODE OF APPLICATION (KILOTONS) 2020-2029
TABLE 181 SAUDI ARABIA METAL CHELATES MARKET BY TYPE (USD MILLION) 2020-2029
TABLE 182 SAUDI ARABIA METAL CHELATES MARKET BY TYPE (KILOTONS) 2020-2029
TABLE 183 SAUDI ARABIA METAL CHELATES MARKET BY CROP TYPE (USD MILLION) 2020-2029
TABLE 184 SAUDI ARABIA METAL CHELATES MARKET BY CROP TYPE (KILOTONS) 2020-2029
TABLE 185 SAUDI ARABIA METAL CHELATES MARKET BY MODE OF APPLICATION (USD MILLION) 2020-2029
TABLE 186 SAUDI ARABIA METAL CHELATES MARKET BY MODE OF APPLICATION (KILOTONS) 2020-2029
TABLE 187 SOUTH AFRICA METAL CHELATES MARKET BY TYPE (USD MILLION) 2020-2029
TABLE 188 SOUTH AFRICA METAL CHELATES MARKET BY TYPE (KILOTONS) 2020-2029
TABLE 189 SOUTH AFRICA METAL CHELATES MARKET BY CROP TYPE (USD MILLION) 2020-2029
TABLE 190 SOUTH AFRICA METAL CHELATES MARKET BY CROP TYPE (KILOTONS) 2020-2029
TABLE 191 SOUTH AFRICA METAL CHELATES MARKET BY MODE OF APPLICATION (USD MILLION) 2020-2029
TABLE 192 SOUTH AFRICA METAL CHELATES MARKET BY MODE OF APPLICATION (KILOTONS) 2020-2029
TABLE 193 REST OF MIDDLE EAST AND AFRICA METAL CHELATES MARKET BY TYPE (USD MILLION) 2020-2029
TABLE 194 REST OF MIDDLE EAST AND AFRICA METAL CHELATES MARKET BY TYPE (KILOTONS) 2020-2029
TABLE 195 REST OF MIDDLE EAST AND AFRICA METAL CHELATES MARKET BY CROP TYPE (USD MILLION) 2020-2029
TABLE 196 REST OF MIDDLE EAST AND AFRICA METAL CHELATES MARKET BY CROP TYPE (KILOTONS) 2020-2029
TABLE 197 REST OF MIDDLE EAST AND AFRICA METAL CHELATES MARKET BY MODE OF APPLICATION (USD MILLION) 2020-2029
TABLE 198 REST OF MIDDLE EAST AND AFRICA METAL CHELATES MARKET BY MODE OF APPLICATION (KILOTONS) 2020-2029
LIST OF FIGURES
FIGURE 1 MARKET DYNAMICS
FIGURE 2 MARKET SEGMENTATION
FIGURE 3 REPORT TIMELINES: YEARS CONSIDERED
FIGURE 4 DATA TRIANGULATION
FIGURE 5 BOTTOM-UP APPROACH
FIGURE 6 TOP-DOWN APPROACH
FIGURE 7 RESEARCH FLOW
FIGURE 8 GLOBAL METAL CHELATES MARKET BY TYPE, USD MILLION, 2020-2029
FIGURE 9 GLOBAL METAL CHELATES MARKET BY MODE OF APPLICATION, USD MILLION, 2020-2029
FIGURE 10 GLOBAL METAL CHELATES MARKET BY CROP TYPE, USD MILLION, 2020-2029
FIGURE 11 GLOBAL METAL CHELATES MARKET BY REGION, USD MILLION, 2020-2029
FIGURE 12 PORTER’S FIVE FORCES MODEL
FIGURE 13 GLOBAL METAL CHELATES MARKET BY TYPE, USD MILLION, 2021
FIGURE 14 GLOBAL METAL CHELATES MARKET BY MODE OF APPLICATION, USD MILLION, 2021
FIGURE 15 GLOBAL METAL CHELATES MARKET BY CROP TYPE, USD MILLION, 2021
FIGURE 16 GLOBAL METAL CHELATES MARKET BY REGION, USD MILLION, 2021
FIGURE 17 NORTH AMERICA METAL CHELATES MARKET SNAPSHOT
FIGURE 18 EUROPE METAL CHELATES MARKET SNAPSHOT
FIGURE 19 SOUTH AMERICA METAL CHELATES MARKET SNAPSHOT
FIGURE 20 ASIA PACIFIC METAL CHELATES MARKET SNAPSHOT
FIGURE 21 MIDDLE EAST ASIA AND AFRICA METAL CHELATES MARKET SNAPSHOT
FIGURE 22 MARKET SHARE ANALYSIS
FIGURE 23 BASF SE: COMPANY SNAPSHOT
FIGURE 24 SYNGENTA AG: COMPANY SNAPSHOT
FIGURE 25 HAIFA CHEMICALS LTD.: COMPANY SNAPSHOT
FIGURE 26 VAN IPEREN INTERNATIONAL: COMPANY SNAPSHOT
FIGURE 27 PROTEX INTERNATIONAL: COMPANY SNAPSHOT
FIGURE 28 AKZONOBEL N.V.: COMPANY SNAPSHOT
FIGURE 29 DERETIL AGRONUTRITIONAL: COMPANY SNAPSHOT
FIGURE 30 NUFARM LIMITED: COMPANY SNAPSHOT
FIGURE 31 ARIES AGRO LIMITED: COMPANY SNAPSHOT
FIGURE 32 VALAGRO SPA: COMPANY SNAPSHOT
DOWNLOAD FREE SAMPLE REPORT
License Type
SPEAK WITH OUR ANALYST
Want to know more about the report or any specific requirement?
WANT TO CUSTOMIZE THE REPORT?
Our Clients Speak
We asked them to research ‘ Equipment market’ all over the world, and their whole arrangement was helpful to us. thehealthanalytics.com insightful analysis and reports contributed to our current analysis and in creating a future strategy. Besides, the te
Yosuke Mitsui
Senior Associate Construction Equipment Sales & Marketing
We asked them to research ‘Equipment market’ all over the world, and their whole arrangement was helpful to us. thehealthanalytics.com insightful analysis and reports contributed to our current analysis and in creating a future strategy. Besides, the te


