

Base Year Value ()
x.x %
x.x %
CAGR ()
x.x %
x.x %
Forecast Year Value ()
x.x %
x.x %
Historical Data Period
Largest Region
Forecast Period
Mercato della canapa industriale per tipo (semi di canapa, olio di semi di canapa, olio di canapa CBD, tiglio di canapa, scaglie di canapa), per fonte (convenzionale, biologica), per applicazione (alimenti e bevande, tessili, prodotti farmaceutici, prodotti per la cura della persona, nutrizione animale, carta, materiali da costruzione, altre applicazioni) e regione, tendenze globali e previsioni dal 2022 al 2029
Instant access to hundreds of data points and trends
- Market estimates from 2014-2029
- Competitive analysis, industry segmentation, financial benchmarks
- Incorporates SWOT, Porter's Five Forces and risk management frameworks
- PDF report or online database with Word, Excel and PowerPoint export options
- 100% money back guarantee
Panoramica del mercato della canapa industriale
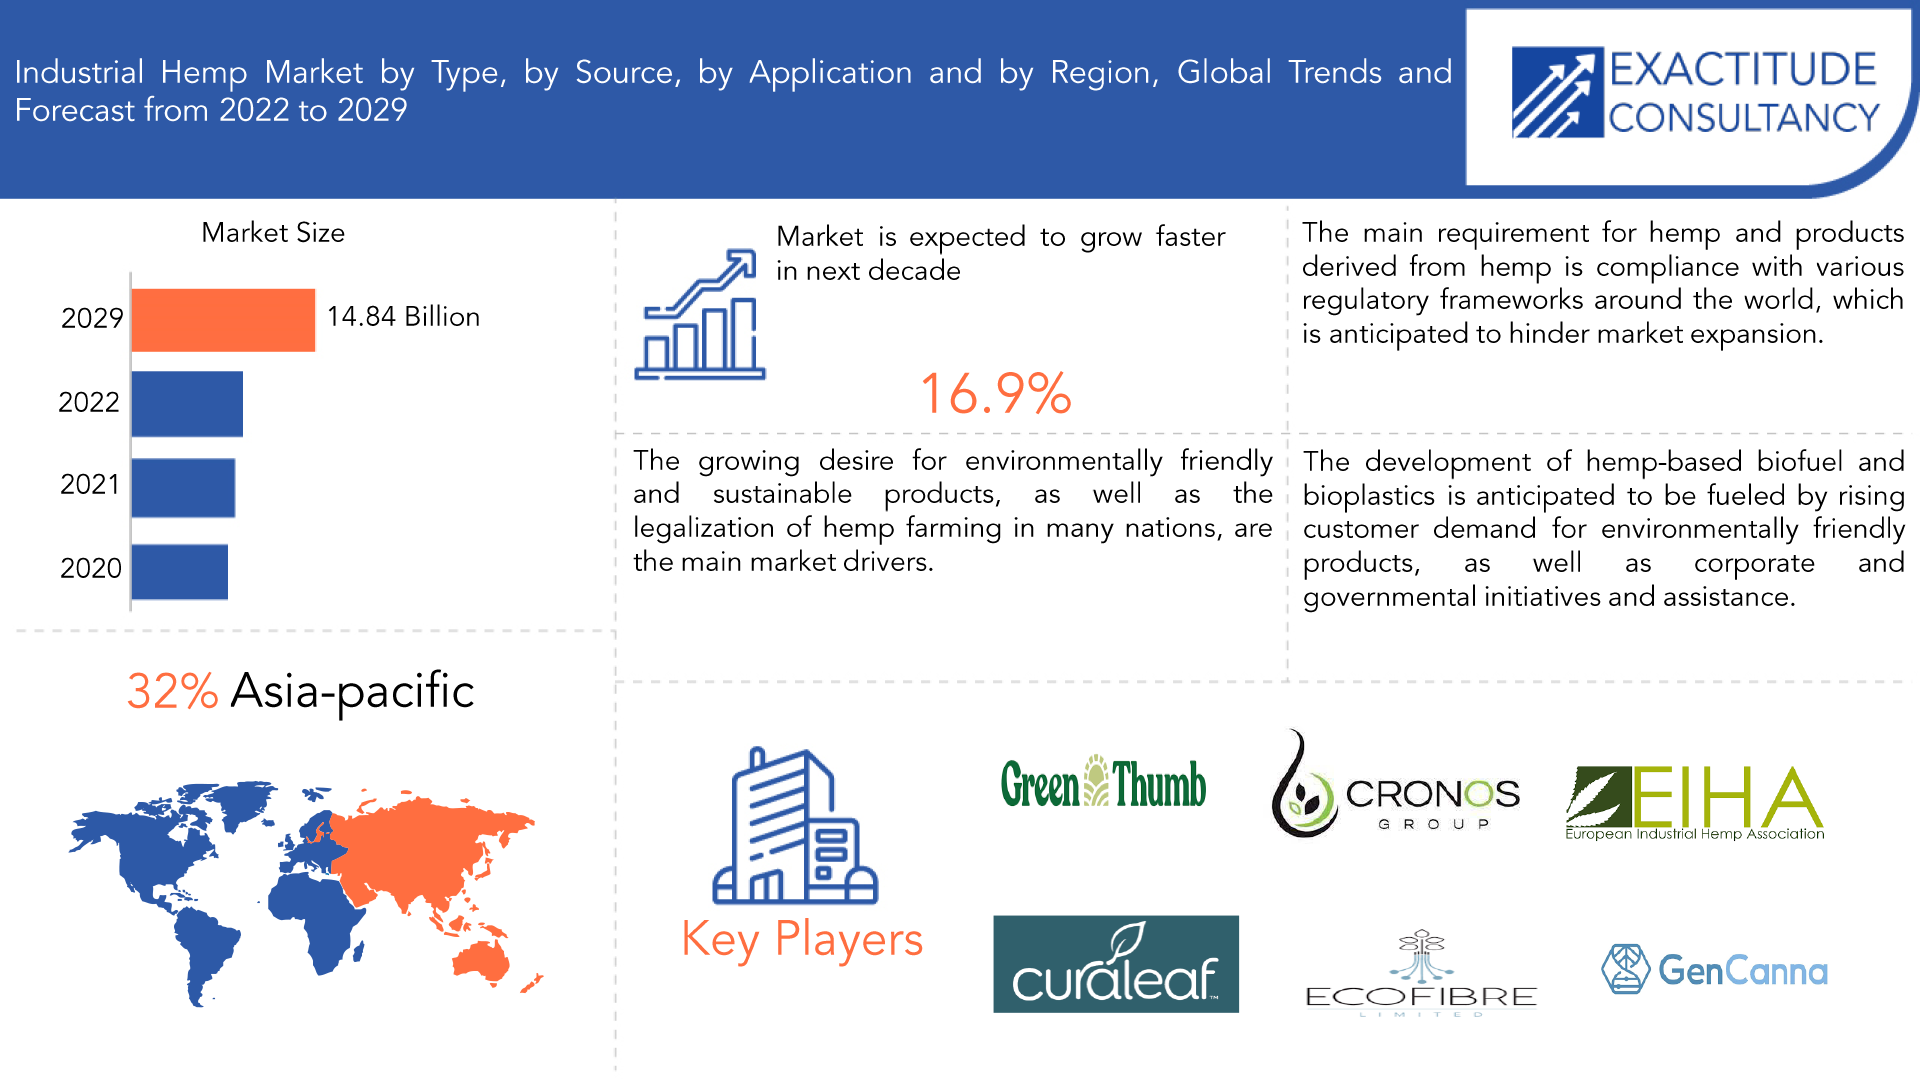
Si prevede che il mercato della canapa industriale crescerà al 16,9% di CAGR dal 2022 al 2029. Si prevede che raggiungerà oltre 14,84 miliardi di USD entro il 2029 dai 3,64 miliardi di USD del 2020.
Una varietà di pianta di Cannabis sativa posizionata per l'applicazione commerciale è chiamata canapa industriale. La cannabis industriale è una specie poco costosa e a crescita rapida che apporta benefici all'ambiente. È anche una delle colture più adattabili esistenti. La cannabis , spesso nota come canapa, è una pianta che viene utilizzata per produrre sostanze psicoattive. Esistono sia usi terapeutici che ricreativi della canapa. La canapa riduce il dolore alterando i circuiti di percezione del dolore del cervello. Inoltre, la maggiore prevalenza di malattie come l'epilessia e altri disturbi del sonno, nonché il crescente utilizzo di prodotti a base di canapa per i suoi vari benefici per la salute, alimentano l'espansione di questo mercato. I semi di canapa ricavati dalla pianta di cannabis sativa contengono pochissimo tetraidrocannabinolo (THC). Tra questi, i due acidi grassi essenziali linoleico e linolenico.
Inoltre, contengono quantità significative di vitamina D, calcio, magnesio, potassio, vitamina E, vitamine B1, B2 e B6. Pochi alimenti di origine vegetale sono fonti proteiche complete; tuttavia, i semi offrono abbastanza proteine da essere considerati un'aggiunta benefica a una dieta vegana. Poiché gli acidi grassi essenziali non possono essere prodotti dagli esseri umani, i semi ricchi di acido linoleico (omega-6) e linolenico (omega-3) possono essere benefici. Inoltre, hanno pochi grassi saturi e nessun grasso trans. Questi sono alcuni componenti importanti che probabilmente sosterranno la futura espansione dell'industria della cannabis. L'ascesa del business della canapa industriale, tuttavia, si prevede che sarà ostacolata dalle complicate leggi che circondano l'uso della cannabis in molti paesi.
| ATTRIBUTO | DETTAGLI |
| Periodo di studio | 2020-2029 |
| Anno base | 2021 |
| Anno stimato | 2022 |
| Anno previsto | 2022-2029 |
| Periodo storico | 2018-2020 |
| Unità | Valore (miliardi di USD) (chilotoni) |
| Segmentazione | Per tipo, per fonte, per applicazione, per regione |
| Per tipo |
|
| Per fonte |
|
| Per applicazione |
|
| Per regione |
|
In tutto il mondo è consentita la coltivazione della canapa e la domanda di fibre di tiglio per la produzione di tessuti di alta qualità è in aumento. Il Canada era solito concentrarsi principalmente sulla coltivazione della canapa per produrre semi per l'industria alimentare e cosmetica. Questa coltura, le cui fibre saranno utilizzate nei materiali da costruzione, nell'isolamento e nei biocompositi, è stata coltivata solo di recente nella nazione. Inoltre, un numero crescente di stati negli Stati Uniti sta legalizzando la coltivazione della canapa, il che suggerisce che la domanda di fibre e semi di canapa aumenterà in tutta la nazione. Inoltre, la Cina è la nazione più significativa in termini di coltivazione della canapa per le fibre. La nazione produce sia fibre lunghe convenzionali che fibre di canapa cotonate utilizzando un processo enzimatico per l'esportazione in Europa e Nord America.
L'epidemia di COVID-19 ha avuto un'influenza significativa sul business della canapa industriale. A seguito delle limitazioni di lockdown messe in atto per contenere lo scoppio della pandemia di COVID-19, numerosi progetti di produzione e costruzione sono stati sospesi. Lo scoppio del COVID-19 ha avuto alcuni effetti immediati e a lungo termine sul settore edile. La chiusura ha danneggiato la produzione nazionale e peggiorerà le incertezze commerciali e l'attuale crisi manifatturiera. In termini comparativi, la pandemia ha avuto scarsi effetti sulle operazioni del settore alimentare e delle bevande, ma la sua catena di fornitura globale è stata gravemente interrotta, il che ha impedito un'ulteriore crescita.
[caption id="allegato_22797" align="aligncenter" width="1920"]
Frequently Asked Questions
•What is the worth of industrial hemp market?
The industrial hemp market is expected to grow at 16.9% CAGR from 2022 to 2029. It is expected to reach above USD 14.84 Billion by 2029 from USD 3.64 Billion in 2020.
•What is the size of the asia pacific in industrial hemp market?
Asia Pacific held more than 32% of the industrial hemp market revenue share in 2021 and will witness expansion in the forecast period.
•What are some of the industrial hemp market's driving forces?
Compared to paper made from wood pulp, paper made from hemp fibre requires less chemicals to process. Consequently, it is anticipated that increased consumer knowledge of the advantages of the products will help the market expand.
•Which are the top companies to hold the market share in industrial hemp market?
The Market research report covers the analysis of Market players. Key companies profiled in the report include Green Thumb Industries Inc., Curaleaf Holdings, Inc., Cronos Group Inc., Ecofibre Limited, GenCanna, HempFlax BV, Konoplex Group, Hemp Oil Canada, BAFA, Dun Agro Hemp Group
•Which is the largest regional market for industrial hemp market?
Due to the region's emerging nations' rising demand for hemp-based food goods and supplements, as well as the region's burgeoning cosmetics and personal care products sector, Asia-Pacific currently controls the majority of the global industrial hemp market.
Industrial Hemp Market Segment Analysis
Industrial hemp market is segmented based on type, source, application, and region.
Based on type, a significant portion of the market was made up of hemp seed. Cannabis sativa, from which hemp seeds are derived, only has a very small quantity of tetrahydrocannabinol in them (THC) Both linoleic (omega-6) and linolenic (omega-3), two necessary fatty acids, as well as the vitamins E, 81, 82, 86, and D, calcium, magnesium, and potassium are abundant in these. Hemp seed includes a lot of lipids, a lot of easily absorbed protein, polyunsaturated fatty acids (PUFA), a lot of carbs, and a lot of insoluble fibre. Alpha-linolenic acid (ALA omega 3), a rich source of PUFA, and linoleic acid (LA omega 6), regarded to be advantageous and balanced for human nutrition.
Based on source, a significant portion of the market was made up of organic. A non-GMO crop grown without the use of pesticides is hemp farmed conventionally. Unlike to certified organic hemp, conventional hemp does not require the same exacting inspections and regulations. They are therefore less expensive than Hamp organic products. The textile and pulp and paper sectors are increasingly using hemp that has been cultivated conventionally. Their demand has also grown as a result of their application in bioplastics, furniture, construction materials, and biofuel. Many conventional hemp-based goods are offered by the German company Hemp Factory. Among the products offered are whole, unpeeled hemp seeds and nuts, peeled hemp seeds and nuts, cold-pressed homo seed oil, refined hemp seed oil, and hemp flour.
Based on application, a significant portion of the market was made up of food & beverages. Due it includes vital fatty acids (linoleic and linolenic acid), vitamin E, and minerals including phosphorus, potassium, salt, magnesium, calcium, zinc, iron, and protein, hemp is being employed in food items more and more. The most common form of hemp consumption is as raw or roasted hemp seed. It can be found in salads, smoothies, yoghurt, and cereals. The demand for processed food made from hemp, such as bars, flour, snacks, and cheese, is anticipated to rise as a result of the growing consumption of plant-based protein brought on by the global popularity of veganism. Also, due highly digestible fibre is present, its role in enhancing digestion is anticipated to increase demand for food goods.
[caption id="attachment_22799" align="aligncenter" width="1920"]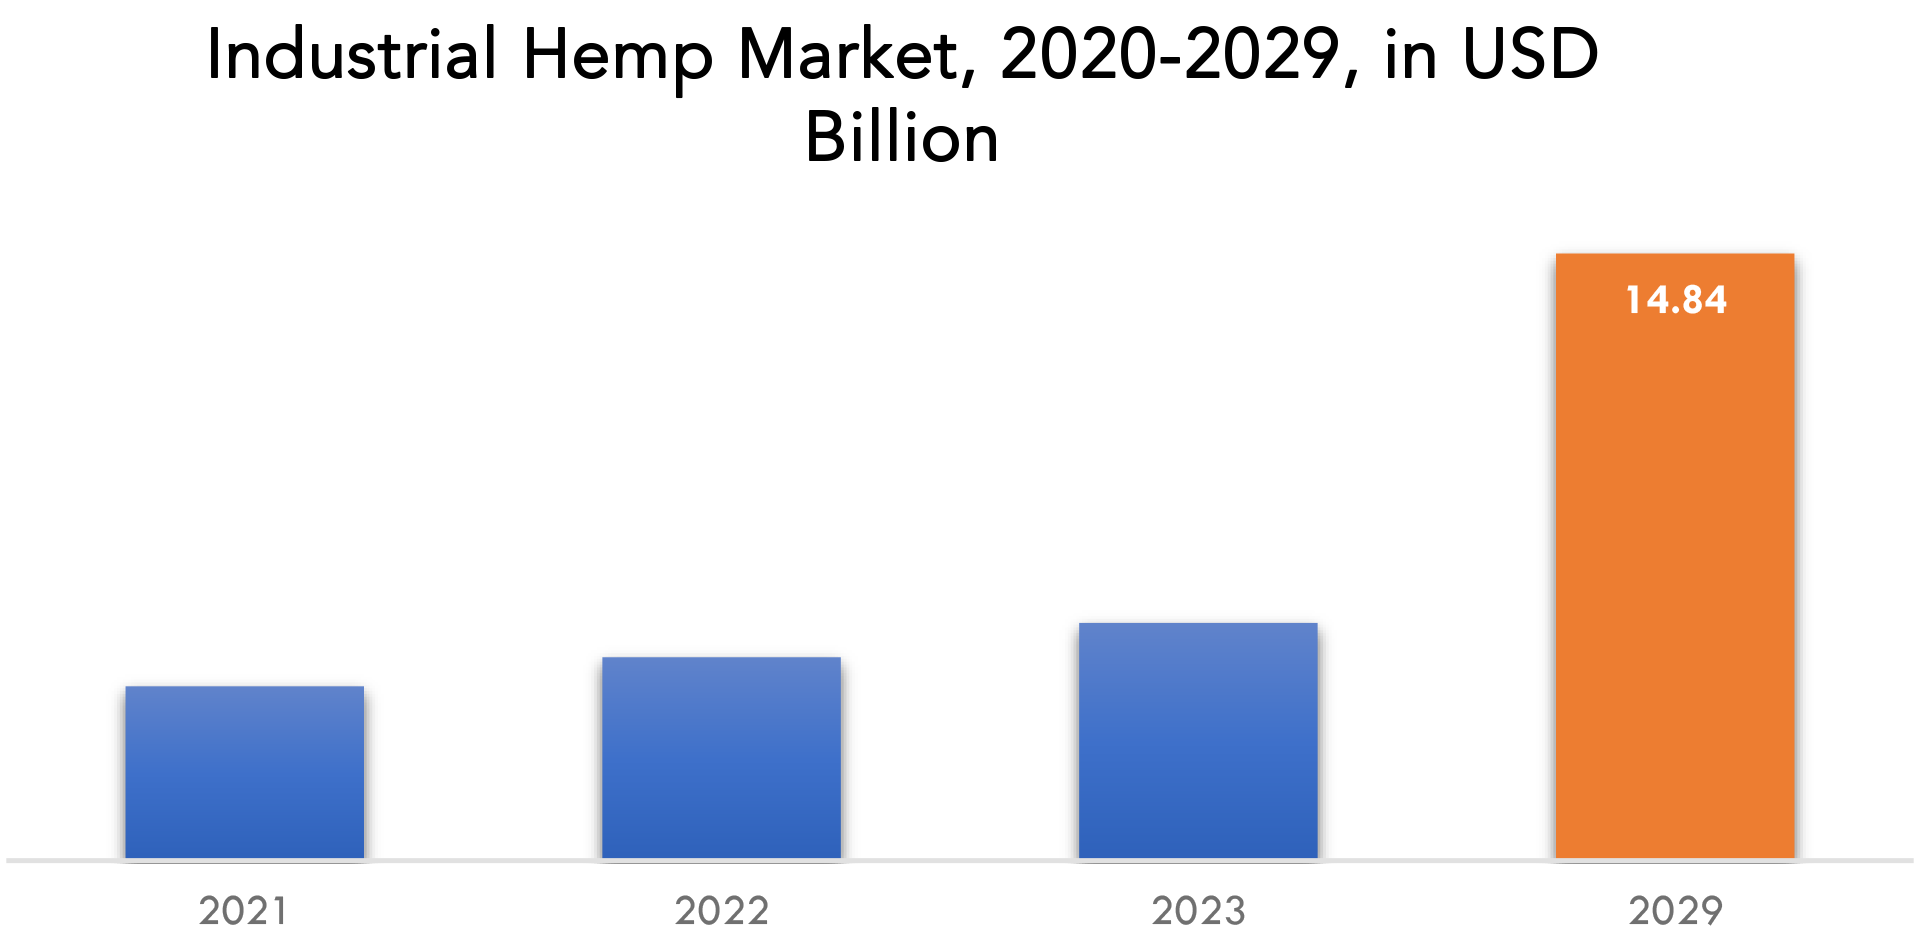
Industrial Hemp Market Players
The Market research report covers the analysis of Market players. Key companies profiled in the report include Green Thumb Industries Inc., Curaleaf Holdings, Inc., Cronos Group Inc., Ecofibre Limited, GenCanna, HempFlax BV, Konoplex Group, Hemp Oil Canada, BAFA, Dun Agro Hemp Group
Recent developments:-
On December 2021, Green Thumb Industries Inc. (Green Thumb) (CSE: GTII) (OTCQX: GTBIF), a leading national cannabis consumer packaged goods company and owner of RYTHM, Good Green and incredibles branded cannabis products, announced it has closed on an acquisition of LeafLine Industries (“LeafLine”).
-
On March 2021, Curaleaf Holdings, Inc.(CSE: CURA) (OTCQX: CURLF) ("Curaleaf" or the "Company"), a leading U.S. provider of consumer products in cannabis, announced that it has signed a definitive agreement to acquire EMMAC Life Sciences Limited ("EMMAC"), the largest vertically integrated independent cannabis company in Europe for base consideration of approximately USD 286 million to be paid 85% in Curaleaf subordinate voting shares and 15% in cash.
Who Should Buy? Or Key stakeholders
- Industrial hemp producers, suppliers, distributors
- Importers and exporters
- Construction material, animal nutrition manufactures
- National Hemp Association
- Regulatory bodies Government agencies
- Non-governmental organizations (NGO)
Industrial Hemp Market Regional Analysis
The industrial hemp market by region includes North America, Asia-Pacific (APAC), Europe, South America, and Middle East & Africa (MEA).
- North America: includes the US, Canada, Mexico
- Asia Pacific: includes China, Japan, South Korea, India, Australia, ASEAN, and Rest of APAC
- Europe: includes UK, Germany, France, Italy, Spain, Russia, and Rest of Europe
- South America: includes Brazil, Argentina, and Rest of South America
- Middle East & Africa: includes Turkey, UAE, Saudi Arabia, South Africa, and Rest of MEA
The greatest revenue share in 2021 over 32% was accounted for by asia pacific. Industrial hemp and its products, including fibre, seed, hurds, and oil, are produced and consumed actively in a number of economies, including China, India, Japan, Korea, Australia, New Zealand, and Thailand. The region's hemp production is changing as a result of rising worldwide product demand, developing technologies, and innovation that make harvesting simpler for growers. Throughout the course of the forecast period, the regional market is anticipated to be driven by rising elderly population levels in developing economies with rising hemp-based food and supplement consumption.
[caption id="attachment_22801" align="aligncenter" width="1920"]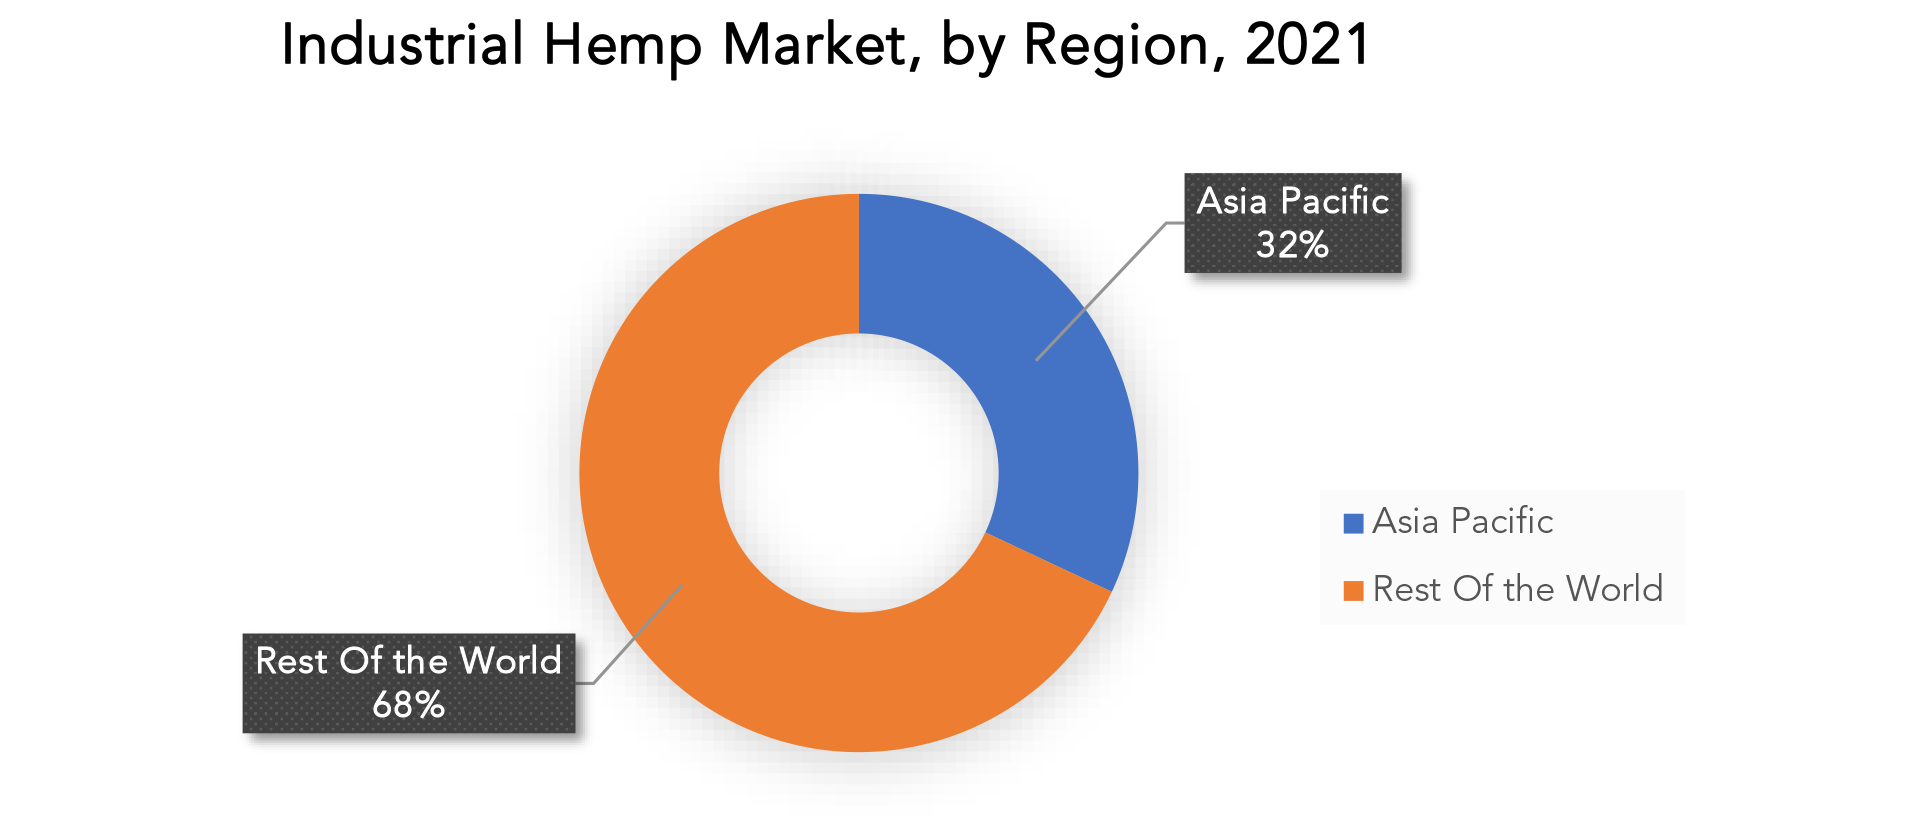
Target Audience for the Industrial Hemp Market
Key Market Segments: Industrial Hemp Market
Industrial Hemp Market By Type, 2020-2029, (USD Billion), (Kilotons)- Hemp Seed
- Hemp Seed Oil
- Cbd Hemp Oil
- Hemp Bast
- Hemp Hurds
- Conventional
- Organic
- Food & Beverages
- Textiles
- Pharmaceuticals
- Personal Care Products
- Animal Nutrition
- Paper
- Construction Materials
- Other Applications
- North America
- Asia Pacific
- Europe
- South America
- Middle East And Africa
Exactitude Consultancy Services Key Objectives:
- Increasing sales and Market share
- Developing new technology
- Improving profitability
- Entering new markets
- Enhancing brand reputation
Key Question Answered
- What is the expected growth rate of the industrial hemp market over the next 7 years?
- Who are the major players in the industrial hemp market and what is their market share?
- What are the end-user industries driving demand for market and what is their outlook?
- What are the opportunities for growth in emerging markets such as Asia-Pacific, Middle East, And Africa?
- How is the economic environment affecting the industrial hemp market, including factors such as interest rates, inflation, and exchange rates?
- What is the expected impact of government policies and regulations on the industrial hemp market?
- What is the current and forecasted size and growth rate of the global industrial hemp market?
- What are the key drivers of growth in the industrial hemp market?
- Who are the major players in the market and what is their market share?
- What are the distribution channels and supply chain dynamics in the industrial hemp market?
- What are the technological advancements and innovations in the industrial hemp market and their impact on source development and growth?
- What are the regulatory considerations and their impact on the market?
- What are the challenges faced by players in the industrial hemp market and how are they addressing these challenges?
- What are the opportunities for growth and expansion in the industrial hemp market?
- What are the products offerings and specifications of leading players in the market?
- INTRODUZIONE
- DEFINIZIONE DI MERCATO
- SEGMENTAZIONE DEL MERCATO
- TEMPI DI RICERCA
- ASSUNZIONI E LIMITAZIONI
- METODOLOGIA DI RICERCA
- ESTRAZIONE DATI
- RICERCA SECONDARIA
- RICERCA PRIMARIA
- PARERI DEGLI ESPERTI IN MATERIA
- CONTROLLI DI QUALITÀ
- RECENSIONE FINALE
- TRIANGOLAZIONE DEI DATI
- APPROCCIO DAL BASSO VERSO L'ALTO
- APPROCCIO TOP-DOWN
- FLUSSO DI RICERCA
- FONTI DEI DATI
- ESTRAZIONE DATI
- SINTESI
- PANORAMICA DEL MERCATO
- PROSPETTIVE DEL MERCATO INDUSTRIALE GLOBALE DELLA CANAPA
- FATTORI DI MERCATO
- LIMITAZIONI DI MERCATO
- OPPORTUNITÀ DI MERCATO
- IMPATTO DEL COVID-19 SUL MERCATO DELLA CANAPA INDUSTRIALE
- MODELLO DELLE CINQUE FORZE DI PORTER
- MINACCIA DAI NUOVI ENTRANSI
- MINACCIA DA SOSTITUTI
- POTERE CONTRATTUALE DEI FORNITORI
- POTERE CONTRATTUALE DEI CLIENTI
- GRADO DI COMPETIZIONE
- ANALISI DELLA CATENA DEL VALORE DEL SETTORE
- PROSPETTIVE DEL MERCATO INDUSTRIALE GLOBALE DELLA CANAPA
- MERCATO GLOBALE DELLA CANAPA INDUSTRIALE PER TIPO, 2020-2029, (MILIARDI DI USD), (KILOTONI)
- SEMI DI CANAPA
- OLIO DI SEMI DI CANAPA
- OLIO DI CANAPA CBD
- LIBBRA DI CANAPA
- CANAPA
- MERCATO GLOBALE DELLA CANAPA INDUSTRIALE PER FONTE, 2020-2029, (MILIARDI DI USD), (KILOTONI)
- CONVENZIONALE
- ORGANICO
- MERCATO GLOBALE DELLA CANAPA INDUSTRIALE PER APPLICAZIONE, 2020-2029, (MILIARDI DI USD), (KILOTONI)
- CIBO E BEVANDE
- TESSUTI
- PRODOTTI FARMACEUTICI
- PRODOTTI PER LA CURA DELLA PERSONA
- NUTRIZIONE ANIMALE
- CARTA
- MATERIALI DA COSTRUZIONE
- ALTRE APPLICAZIONI
- MERCATO GLOBALE DELLA CANAPA INDUSTRIALE PER REGIONE, 2020-2029, (MILIARDI DI USD), (KILOTONI)
- AMERICA DEL NORD
- NOI
- CANADA
- MESSICO
- SUD AMERICA
- BRASILE
- ARGENTINA
- COLOMBIA
- RESTO DEL SUD AMERICA
- EUROPA
- GERMANIA
- Regno Unito
- FRANCIA
- ITALIA
- SPAGNA
- RUSSIA
- RESTO D'EUROPA
- ASIA PACIFICO
- INDIA
- CINA
- GIAPPONE
- COREA DEL SUD
- AUSTRALIA
- ASIA SUD-ORIENTALE
- RESTO DELL'ASIA PACIFICO
- MIDDLE EAST AND AFRICA
- UAE
- SAUDI ARABIA
- SOUTH AFRICA
- REST OF MIDDLE EAST AND AFRICA
- AMERICA DEL NORD
9.COMPANY PROFILES*(BUSINESS OVERVIEW, COMPANY SNAPSHOT, PRODUCTS OFFERED, RECENT DEVELOPMENTS)
- GREEN THUMB INDUSTRIES INC
- CURALEAF HOLDINGS, INC.
- CRONOS GROUP INC.,
- ECOFIBRE LIMITED
- GENCANNA
- HEMPFLAX BV
- KONOPLEX GROUP
- HEMP OIL CANADA
- BAFA
- DUN AGRO HEMP GROUP *THE COMPANY LIST IS INDICATIVE
LIST OF TABLES
TABLE 1 GLOBAL INDUSTRIAL HEMP MARKET BY TYPE (USD BILLION) 2020-2029
TABLE 2 GLOBAL INDUSTRIAL HEMP MARKET BY TYPE (KILOTONS) 2020-2029
TABLE 3 GLOBAL INDUSTRIAL HEMP MARKET BY SOURCE (USD BILLION) 2020-2029
TABLE 4 GLOBAL INDUSTRIAL HEMP MARKET BY SOURCE (KILOTONS) 2020-2029
TABLE 5 GLOBAL INDUSTRIAL HEMP MARKET BY APPLICATION (USD BILLION) 2020-2029
TABLE 6 GLOBAL INDUSTRIAL HEMP MARKET BY APPLICATION (KILOTONS) 2020-2029
TABLE 7 GLOBAL INDUSTRIAL HEMP MARKET BY REGION (USD BILLION) 2020-2029
TABLE 8 GLOBAL INDUSTRIAL HEMP MARKET BY REGION (KILOTONS) 2020-2029
TABLE 9 NORTH AMERICA INDUSTRIAL HEMP MARKET BY COUNTRY (USD BILLION) 2020-2029
TABLE 10 NORTH AMERICA INDUSTRIAL HEMP MARKET BY COUNTRY (KILOTONS) 2020-2029
TABLE 11 NORTH AMERICA INDUSTRIAL HEMP MARKET BY TYPE (USD BILLION) 2020-2029
TABLE 12 NORTH AMERICA INDUSTRIAL HEMP MARKET BY TYPE (KILOTONS) 2020-2029
TABLE 13 NORTH AMERICA INDUSTRIAL HEMP MARKET BY SOURCE (USD BILLION) 2020-2029
TABLE 14 NORTH AMERICA INDUSTRIAL HEMP MARKET BY SOURCE (KILOTONS) 2020-2029
TABLE 15 NORTH AMERICA INDUSTRIAL HEMP MARKET BY APPLICATION (USD BILLION) 2020-2029
TABLE 16 NORTH AMERICA INDUSTRIAL HEMP MARKET BY APPLICATION (KILOTONS) 2020-2029
TABLE 17 US INDUSTRIAL HEMP MARKET BY TYPE (USD BILLION) 2020-2029
TABLE 18 US INDUSTRIAL HEMP MARKET BY TYPE (KILOTONS) 2020-2029
TABLE 19 US INDUSTRIAL HEMP MARKET BY SOURCE (USD BILLION) 2020-2029
TABLE 20 US INDUSTRIAL HEMP MARKET BY SOURCE (KILOTONS) 2020-2029
TABLE 21 US INDUSTRIAL HEMP MARKET BY APPLICATION (USD BILLION) 2020-2029
TABLE 22 US INDUSTRIAL HEMP MARKET BY APPLICATION (KILOTONS) 2020-2029
TABLE 23 CANADA INDUSTRIAL HEMP MARKET BY TYPE (USD BILLION) 2020-2029
TABLE 24 CANADA INDUSTRIAL HEMP MARKET BY TYPE (KILOTONS) 2020-2029
TABLE 25 CANADA INDUSTRIAL HEMP MARKET BY SOURCE (USD BILLION) 2020-2029
TABLE 26 CANADA INDUSTRIAL HEMP MARKET BY SOURCE (KILOTONS) 2020-2029
TABLE 27 CANADA INDUSTRIAL HEMP MARKET BY APPLICATION (USD BILLION) 2020-2029
TABLE 28 CANADA INDUSTRIAL HEMP MARKET BY APPLICATION (KILOTONS) 2020-2029
TABLE 29 MEXICO INDUSTRIAL HEMP MARKET BY TYPE (USD BILLION) 2020-2029
TABLE 30 MEXICO INDUSTRIAL HEMP MARKET BY TYPE (KILOTONS) 2020-2029
TABLE 31 MEXICO INDUSTRIAL HEMP MARKET BY SOURCE (USD BILLION) 2020-2029
TABLE 32 MEXICO INDUSTRIAL HEMP MARKET BY SOURCE (KILOTONS) 2020-2029
TABLE 33 MEXICO INDUSTRIAL HEMP MARKET BY APPLICATION (USD BILLION) 2020-2029
TABLE 34 MEXICO INDUSTRIAL HEMP MARKET BY APPLICATION (KILOTONS) 2020-2029
TABLE 35 SOUTH AMERICA INDUSTRIAL HEMP MARKET BY COUNTRY (USD BILLION) 2020-2029
TABLE 36 SOUTH AMERICA INDUSTRIAL HEMP MARKET BY COUNTRY (KILOTONS) 2020-2029
TABLE 37 SOUTH AMERICA INDUSTRIAL HEMP MARKET BY TYPE (USD BILLION) 2020-2029
TABLE 38 SOUTH AMERICA INDUSTRIAL HEMP MARKET BY TYPE (KILOTONS) 2020-2029
TABLE 39 SOUTH AMERICA INDUSTRIAL HEMP MARKET BY SOURCE (USD BILLION) 2020-2029
TABLE 40 SOUTH AMERICA INDUSTRIAL HEMP MARKET BY SOURCE (KILOTONS) 2020-2029
TABLE 41 SOUTH AMERICA INDUSTRIAL HEMP MARKET BY APPLICATION (USD BILLION) 2020-2029
TABLE 42 SOUTH AMERICA INDUSTRIAL HEMP MARKET BY APPLICATION (KILOTONS) 2020-2029
TABLE 43 BRAZIL INDUSTRIAL HEMP MARKET BY TYPE (USD BILLION) 2020-2029
TABLE 44 BRAZIL INDUSTRIAL HEMP MARKET BY TYPE (KILOTONS) 2020-2029
TABLE 45 BRAZIL INDUSTRIAL HEMP MARKET BY SOURCE (USD BILLION) 2020-2029
TABLE 46 BRAZIL INDUSTRIAL HEMP MARKET BY SOURCE (KILOTONS) 2020-2029
TABLE 47 BRAZIL INDUSTRIAL HEMP MARKET BY APPLICATION (USD BILLION) 2020-2029
TABLE 48 BRAZIL INDUSTRIAL HEMP MARKET BY APPLICATION (KILOTONS) 2020-2029
TABLE 49 ARGENTINA INDUSTRIAL HEMP MARKET BY TYPE (USD BILLION) 2020-2029
TABLE 50 ARGENTINA INDUSTRIAL HEMP MARKET BY TYPE (KILOTONS) 2020-2029
TABLE 51 ARGENTINA INDUSTRIAL HEMP MARKET BY SOURCE (USD BILLION) 2020-2029
TABLE 52 ARGENTINA INDUSTRIAL HEMP MARKET BY SOURCE (KILOTONS) 2020-2029
TABLE 53 ARGENTINA INDUSTRIAL HEMP MARKET BY APPLICATION (USD BILLION) 2020-2029
TABLE 54 ARGENTINA INDUSTRIAL HEMP MARKET BY APPLICATION (KILOTONS) 2020-2029
TABLE 55 COLOMBIA INDUSTRIAL HEMP MARKET BY TYPE (USD BILLION) 2020-2029
TABLE 56 COLOMBIA INDUSTRIAL HEMP MARKET BY TYPE (KILOTONS) 2020-2029
TABLE 57 COLOMBIA INDUSTRIAL HEMP MARKET BY SOURCE (USD BILLION) 2020-2029
TABLE 58 COLOMBIA INDUSTRIAL HEMP MARKET BY SOURCE (KILOTONS) 2020-2029
TABLE 59 COLOMBIA INDUSTRIAL HEMP MARKET BY APPLICATION (USD BILLION) 2020-2029
TABLE 60 COLOMBIA INDUSTRIAL HEMP MARKET BY APPLICATION (KILOTONS) 2020-2029
TABLE 61 REST OF SOUTH AMERICA INDUSTRIAL HEMP MARKET BY TYPE (USD BILLION) 2020-2029
TABLE 62 REST OF SOUTH AMERICA INDUSTRIAL HEMP MARKET BY TYPE (KILOTONS) 2020-2029
TABLE 63 REST OF SOUTH AMERICA INDUSTRIAL HEMP MARKET BY SOURCE (USD BILLION) 2020-2029
TABLE 64 REST OF SOUTH AMERICA INDUSTRIAL HEMP MARKET BY SOURCE (KILOTONS) 2020-2029
TABLE 65 REST OF SOUTH AMERICA INDUSTRIAL HEMP MARKET BY APPLICATION (USD BILLION) 2020-2029
TABLE 66 REST OF SOUTH AMERICA INDUSTRIAL HEMP MARKET BY APPLICATION (KILOTONS) 2020-2029
TABLE 67 ASIA-PACIFIC INDUSTRIAL HEMP MARKET BY COUNTRY (USD BILLION) 2020-2029
TABLE 68 ASIA-PACIFIC INDUSTRIAL HEMP MARKET BY COUNTRY (KILOTONS) 2020-2029
TABLE 69 ASIA-PACIFIC INDUSTRIAL HEMP MARKET BY TYPE (USD BILLION) 2020-2029
TABLE 70 ASIA-PACIFIC INDUSTRIAL HEMP MARKET BY TYPE (KILOTONS) 2020-2029
TABLE 71 ASIA-PACIFIC INDUSTRIAL HEMP MARKET BY SOURCE (USD BILLION) 2020-2029
TABLE 72 ASIA-PACIFIC INDUSTRIAL HEMP MARKET BY SOURCE (KILOTONS) 2020-2029
TABLE 73 ASIA-PACIFIC INDUSTRIAL HEMP MARKET BY APPLICATION (USD BILLION) 2020-2029
TABLE 74 ASIA-PACIFIC INDUSTRIAL HEMP MARKET BY APPLICATION (KILOTONS) 2020-2029
TABLE 75 INDIA INDUSTRIAL HEMP MARKET BY TYPE (USD BILLION) 2020-2029
TABLE 76 INDIA INDUSTRIAL HEMP MARKET BY TYPE (KILOTONS) 2020-2029
TABLE 77 INDIA INDUSTRIAL HEMP MARKET BY SOURCE (USD BILLION) 2020-2029
TABLE 78 INDIA INDUSTRIAL HEMP MARKET BY SOURCE (KILOTONS) 2020-2029
TABLE 79 INDIA INDUSTRIAL HEMP MARKET BY APPLICATION (USD BILLION) 2020-2029
TABLE 80 INDIA INDUSTRIAL HEMP MARKET BY APPLICATION (KILOTONS) 2020-2029
TABLE 81 CHINA INDUSTRIAL HEMP MARKET BY TYPE (USD BILLION) 2020-2029
TABLE 82 CHINA INDUSTRIAL HEMP MARKET BY TYPE (KILOTONS) 2020-2029
TABLE 83 CHINA INDUSTRIAL HEMP MARKET BY SOURCE (USD BILLION) 2020-2029
TABLE 84 CHINA INDUSTRIAL HEMP MARKET BY SOURCE (KILOTONS) 2020-2029
TABLE 85 CHINA INDUSTRIAL HEMP MARKET BY APPLICATION (USD BILLION) 2020-2029
TABLE 86 CHINA INDUSTRIAL HEMP MARKET BY APPLICATION (KILOTONS) 2020-2029
TABLE 87 JAPAN INDUSTRIAL HEMP MARKET BY TYPE (USD BILLION) 2020-2029
TABLE 88 JAPAN INDUSTRIAL HEMP MARKET BY TYPE (KILOTONS) 2020-2029
TABLE 89 JAPAN INDUSTRIAL HEMP MARKET BY SOURCE (USD BILLION) 2020-2029
TABLE 90 JAPAN INDUSTRIAL HEMP MARKET BY SOURCE (KILOTONS) 2020-2029
TABLE 91 JAPAN INDUSTRIAL HEMP MARKET BY APPLICATION (USD BILLION) 2020-2029
TABLE 92 JAPAN INDUSTRIAL HEMP MARKET BY APPLICATION (KILOTONS) 2020-2029
TABLE 93 SOUTH KOREA INDUSTRIAL HEMP MARKET BY TYPE (USD BILLION) 2020-2029
TABLE 94 SOUTH KOREA INDUSTRIAL HEMP MARKET BY TYPE (KILOTONS) 2020-2029
TABLE 95 SOUTH KOREA INDUSTRIAL HEMP MARKET BY SOURCE (USD BILLION) 2020-2029
TABLE 96 SOUTH KOREA INDUSTRIAL HEMP MARKET BY SOURCE (KILOTONS) 2020-2029
TABLE 97 SOUTH KOREA INDUSTRIAL HEMP MARKET BY APPLICATION (USD BILLION) 2020-2029
TABLE 98 SOUTH KOREA INDUSTRIAL HEMP MARKET BY APPLICATION (KILOTONS) 2020-2029
TABLE 99 AUSTRALIA INDUSTRIAL HEMP MARKET BY TYPE (USD BILLION) 2020-2029
TABLE 100 AUSTRALIA INDUSTRIAL HEMP MARKET BY TYPE (KILOTONS) 2020-2029
TABLE 101 AUSTRALIA INDUSTRIAL HEMP MARKET BY SOURCE (USD BILLION) 2020-2029
TABLE 102 AUSTRALIA INDUSTRIAL HEMP MARKET BY SOURCE (KILOTONS) 2020-2029
TABLE 103 AUSTRALIA INDUSTRIAL HEMP MARKET BY APPLICATION (USD BILLION) 2020-2029
TABLE 104 AUSTRALIA INDUSTRIAL HEMP MARKET BY APPLICATION (KILOTONS) 2020-2029
TABLE 105 SOUTH-EAST ASIA INDUSTRIAL HEMP MARKET BY TYPE (USD BILLION) 2020-2029
TABLE 106 SOUTH-EAST ASIA INDUSTRIAL HEMP MARKET BY TYPE (KILOTONS) 2020-2029
TABLE 107 SOUTH-EAST ASIA INDUSTRIAL HEMP MARKET BY SOURCE (USD BILLION) 2020-2029
TABLE 108 SOUTH-EAST ASIA INDUSTRIAL HEMP MARKET BY SOURCE (KILOTONS) 2020-2029
TABLE 109 SOUTH-EAST ASIA INDUSTRIAL HEMP MARKET BY APPLICATION (USD BILLION) 2020-2029
TABLE 110 SOUTH-EAST ASIA INDUSTRIAL HEMP MARKET BY APPLICATION (KILOTONS) 2020-2029
TABLE 111 REST OF ASIA PACIFIC INDUSTRIAL HEMP MARKET BY TYPE (USD BILLION) 2020-2029
TABLE 112 REST OF ASIA PACIFIC INDUSTRIAL HEMP MARKET BY TYPE (KILOTONS) 2020-2029
TABLE 113 REST OF ASIA PACIFIC INDUSTRIAL HEMP MARKET BY SOURCE (USD BILLION) 2020-2029
TABLE 114 REST OF ASIA PACIFIC INDUSTRIAL HEMP MARKET BY SOURCE (KILOTONS) 2020-2029
TABLE 115 REST OF ASIA PACIFIC INDUSTRIAL HEMP MARKET BY APPLICATION (USD BILLION) 2020-2029
TABLE 116 REST OF ASIA PACIFIC INDUSTRIAL HEMP MARKET BY APPLICATION (KILOTONS) 2020-2029
TABLE 117 EUROPE INDUSTRIAL HEMP MARKET BY COUNTRY (USD BILLION) 2020-2029
TABLE 118 EUROPE INDUSTRIAL HEMP MARKET BY COUNTRY (KILOTONS) 2020-2029
TABLE 119 EUROPE INDUSTRIAL HEMP MARKET BY TYPE (USD BILLION) 2020-2029
TABLE 120 EUROPE INDUSTRIAL HEMP MARKET BY TYPE (KILOTONS) 2020-2029
TABLE 121 EUROPE INDUSTRIAL HEMP MARKET BY SOURCE (USD BILLION) 2020-2029
TABLE 122 EUROPE INDUSTRIAL HEMP MARKET BY SOURCE (KILOTONS) 2020-2029
TABLE 123 EUROPE INDUSTRIAL HEMP MARKET BY APPLICATION (USD BILLION) 2020-2029
TABLE 124 EUROPE INDUSTRIAL HEMP MARKET BY APPLICATION (KILOTONS) 2020-2029
TABLE 125 GERMANY INDUSTRIAL HEMP MARKET BY TYPE (USD BILLION) 2020-2029
TABLE 126 GERMANY INDUSTRIAL HEMP MARKET BY TYPE (KILOTONS) 2020-2029
TABLE 127 GERMANY INDUSTRIAL HEMP MARKET BY SOURCE (USD BILLION) 2020-2029
TABLE 128 GERMANY INDUSTRIAL HEMP MARKET BY SOURCE (KILOTONS) 2020-2029
TABLE 129 GERMANY INDUSTRIAL HEMP MARKET BY APPLICATION (USD BILLION) 2020-2029
TABLE 130 GERMANY INDUSTRIAL HEMP MARKET BY APPLICATION (KILOTONS) 2020-2029
TABLE 131 UK INDUSTRIAL HEMP MARKET BY TYPE (USD BILLION) 2020-2029
TABLE 132 UK INDUSTRIAL HEMP MARKET BY TYPE (KILOTONS) 2020-2029
TABLE 133 UK INDUSTRIAL HEMP MARKET BY SOURCE (USD BILLION) 2020-2029
TABLE 134 UK INDUSTRIAL HEMP MARKET BY SOURCE (KILOTONS) 2020-2029
TABLE 135 UK INDUSTRIAL HEMP MARKET BY APPLICATION (USD BILLION) 2020-2029
TABLE 136 UK INDUSTRIAL HEMP MARKET BY APPLICATION (KILOTONS) 2020-2029
TABLE 137 FRANCE INDUSTRIAL HEMP MARKET BY TYPE (USD BILLION) 2020-2029
TABLE 138 FRANCE INDUSTRIAL HEMP MARKET BY TYPE (KILOTONS) 2020-2029
TABLE 139 FRANCE INDUSTRIAL HEMP MARKET BY SOURCE (USD BILLION) 2020-2029
TABLE 140 FRANCE INDUSTRIAL HEMP MARKET BY SOURCE (KILOTONS) 2020-2029
TABLE 141 FRANCE INDUSTRIAL HEMP MARKET BY APPLICATION (USD BILLION) 2020-2029
TABLE 142 FRANCE INDUSTRIAL HEMP MARKET BY APPLICATION (KILOTONS) 2020-2029
TABLE 143 ITALY INDUSTRIAL HEMP MARKET BY TYPE (USD BILLION) 2020-2029
TABLE 144 ITALY INDUSTRIAL HEMP MARKET BY TYPE (KILOTONS) 2020-2029
TABLE 145 ITALY INDUSTRIAL HEMP MARKET BY SOURCE (USD BILLION) 2020-2029
TABLE 146 ITALY INDUSTRIAL HEMP MARKET BY SOURCE (KILOTONS) 2020-2029
TABLE 147 ITALY INDUSTRIAL HEMP MARKET BY APPLICATION (USD BILLION) 2020-2029
TABLE 148 ITALY INDUSTRIAL HEMP MARKET BY APPLICATION (KILOTONS) 2020-2029
TABLE 149 SPAIN INDUSTRIAL HEMP MARKET BY TYPE (USD BILLION) 2020-2029
TABLE 150 SPAIN INDUSTRIAL HEMP MARKET BY TYPE (KILOTONS) 2020-2029
TABLE 151 SPAIN INDUSTRIAL HEMP MARKET BY SOURCE (USD BILLION) 2020-2029
TABLE 152 SPAIN INDUSTRIAL HEMP MARKET BY SOURCE (KILOTONS) 2020-2029
TABLE 153 SPAIN INDUSTRIAL HEMP MARKET BY APPLICATION (USD BILLION) 2020-2029
TABLE 154 SPAIN INDUSTRIAL HEMP MARKET BY APPLICATION (KILOTONS) 2020-2029
TABLE 155 RUSSIA INDUSTRIAL HEMP MARKET BY TYPE (USD BILLION) 2020-2029
TABLE 156 RUSSIA INDUSTRIAL HEMP MARKET BY TYPE (KILOTONS) 2020-2029
TABLE 157 RUSSIA INDUSTRIAL HEMP MARKET BY SOURCE (USD BILLION) 2020-2029
TABLE 158 RUSSIA INDUSTRIAL HEMP MARKET BY SOURCE (KILOTONS) 2020-2029
TABLE 159 RUSSIA INDUSTRIAL HEMP MARKET BY APPLICATION (USD BILLION) 2020-2029
TABLE 160 RUSSIA INDUSTRIAL HEMP MARKET BY APPLICATION (KILOTONS) 2020-2029
TABLE 161 REST OF EUROPE INDUSTRIAL HEMP MARKET BY TYPE (USD BILLION) 2020-2029
TABLE 162 REST OF EUROPE INDUSTRIAL HEMP MARKET BY TYPE (KILOTONS) 2020-2029
TABLE 163 REST OF EUROPE INDUSTRIAL HEMP MARKET BY SOURCE (USD BILLION) 2020-2029
TABLE 164 REST OF EUROPE INDUSTRIAL HEMP MARKET BY SOURCE (KILOTONS) 2020-2029
TABLE 165 REST OF EUROPE INDUSTRIAL HEMP MARKET BY APPLICATION (USD BILLION) 2020-2029
TABLE 166 REST OF EUROPE INDUSTRIAL HEMP MARKET BY APPLICATION (KILOTONS) 2020-2029
TABLE 167 MIDDLE EAST AND AFRICA INDUSTRIAL HEMP MARKET BY COUNTRY (USD BILLION) 2020-2029
TABLE 168 MIDDLE EAST AND AFRICA INDUSTRIAL HEMP MARKET BY COUNTRY (KILOTONS) 2020-2029
TABLE 169 MIDDLE EAST AND AFRICA INDUSTRIAL HEMP MARKET BY TYPE (USD BILLION) 2020-2029
TABLE 170 MIDDLE EAST AND AFRICA INDUSTRIAL HEMP MARKET BY TYPE (KILOTONS) 2020-2029
TABLE 171 MIDDLE EAST AND AFRICA INDUSTRIAL HEMP MARKET BY SOURCE (USD BILLION) 2020-2029
TABLE 172 MIDDLE EAST AND AFRICA INDUSTRIAL HEMP MARKET BY SOURCE (KILOTONS) 2020-2029
TABLE 173 MIDDLE EAST AND AFRICA INDUSTRIAL HEMP MARKET BY APPLICATION (USD BILLION) 2020-2029
TABLE 174 MIDDLE EAST AND AFRICA INDUSTRIAL HEMP MARKET BY APPLICATION (KILOTONS) 2020-2029
TABLE 175 UAE INDUSTRIAL HEMP MARKET BY TYPE (USD BILLION) 2020-2029
TABLE 176 UAE INDUSTRIAL HEMP MARKET BY TYPE (KILOTONS) 2020-2029
TABLE 177 UAE INDUSTRIAL HEMP MARKET BY SOURCE (USD BILLION) 2020-2029
TABLE 178 UAE INDUSTRIAL HEMP MARKET BY SOURCE (KILOTONS) 2020-2029
TABLE 179 UAE INDUSTRIAL HEMP MARKET BY APPLICATION (USD BILLION) 2020-2029
TABLE 180 UAE INDUSTRIAL HEMP MARKET BY APPLICATION (KILOTONS) 2020-2029
TABLE 181 SAUDI ARABIA INDUSTRIAL HEMP MARKET BY TYPE (USD BILLION) 2020-2029
TABLE 182 SAUDI ARABIA INDUSTRIAL HEMP MARKET BY TYPE (KILOTONS) 2020-2029
TABLE 183 SAUDI ARABIA INDUSTRIAL HEMP MARKET BY SOURCE (USD BILLION) 2020-2029
TABLE 184 SAUDI ARABIA INDUSTRIAL HEMP MARKET BY SOURCE (KILOTONS) 2020-2029
TABLE 185 SAUDI ARABIA INDUSTRIAL HEMP MARKET BY APPLICATION (USD BILLION) 2020-2029
TABLE 186 SAUDI ARABIA INDUSTRIAL HEMP MARKET BY APPLICATION (KILOTONS) 2020-2029
TABLE 187 SOUTH AFRICA INDUSTRIAL HEMP MARKET BY TYPE (USD BILLION) 2020-2029
TABLE 188 SOUTH AFRICA INDUSTRIAL HEMP MARKET BY TYPE (KILOTONS) 2020-2029
TABLE 189 SOUTH AFRICA INDUSTRIAL HEMP MARKET BY SOURCE (USD BILLION) 2020-2029
TABLE 190 SOUTH AFRICA INDUSTRIAL HEMP MARKET BY SOURCE (KILOTONS) 2020-2029
TABLE 191 SOUTH AFRICA INDUSTRIAL HEMP MARKET BY APPLICATION (USD BILLION) 2020-2029
TABLE 192 SOUTH AFRICA INDUSTRIAL HEMP MARKET BY APPLICATION (KILOTONS) 2020-2029
TABLE 193 REST OF MIDDLE EAST AND AFRICA INDUSTRIAL HEMP MARKET BY TYPE (USD BILLION) 2020-2029
TABLE 194 REST OF MIDDLE EAST AND AFRICA INDUSTRIAL HEMP MARKET BY TYPE (KILOTONS) 2020-2029
TABLE 195 REST OF MIDDLE EAST AND AFRICA INDUSTRIAL HEMP MARKET BY SOURCE (USD BILLION) 2020-2029
TABLE 196 REST OF MIDDLE EAST AND AFRICA INDUSTRIAL HEMP MARKET BY SOURCE (KILOTONS) 2020-2029
TABLE 197 REST OF MIDDLE EAST AND AFRICA INDUSTRIAL HEMP MARKET BY APPLICATION (USD BILLION) 2020-2029
TABLE 198 REST OF MIDDLE EAST AND AFRICA INDUSTRIAL HEMP MARKET BY APPLICATION (KILOTONS) 2020-2029
LIST OF FIGURES
FIGURE 1 MARKET DYNAMICS
FIGURE 2 MARKET SEGMENTATION
FIGURE 3 REPORT TIMELINES: YEARS CONSIDERED
FIGURE 4 DATA TRIANGULATION
FIGURE 5 BOTTOM-UP APPROACH
FIGURE 6 TOP-DOWN APPROACH
FIGURE 7 RESEARCH FLOW
FIGURE 8 GLOBAL INDUSTRIAL HEMP MARKET BY TYPE, USD BILLION, 2020-2029
FIGURE 9 GLOBAL INDUSTRIAL HEMP MARKET BY SOURCE, USD BILLION, 2020-2029
FIGURE 10 GLOBAL INDUSTRIAL HEMP MARKET BY APPLICATION, USD BILLION, 2020-2029
FIGURE 11 GLOBAL INDUSTRIAL HEMP MARKET BY REGION, USD BILLION, 2020-2029
FIGURE 12 PORTER’S FIVE FORCES MODEL
FIGURE 13 GLOBAL INDUSTRIAL HEMP MARKET BY TYPE, USD BILLION, 2021
FIGURE 14 GLOBAL INDUSTRIAL HEMP MARKET BY SOURCE, USD BILLION, 2021
FIGURE 15 GLOBAL INDUSTRIAL HEMP MARKET BY APPLICATION, USD BILLION, 2021
FIGURE 16 GLOBAL INDUSTRIAL HEMP MARKET BY REGION, USD BILLION, 2021
FIGURE 17 NORTH AMERICA INDUSTRIAL HEMP MARKETSNAPSHOT
FIGURE 18 EUROPE INDUSTRIAL HEMP MARKETSNAPSHOT
FIGURE 19 SOUTH AMERICA INDUSTRIAL HEMP MARKETSNAPSHOT
FIGURE 20 ASIA PACIFIC INDUSTRIAL HEMP MARKETSNAPSHOT
FIGURE 21 MIDDLE EAST ASIA AND AFRICA INDUSTRIAL HEMP MARKETSNAPSHOT
FIGURE 22 MARKET SHARE ANALYSIS
FIGURE 23 GREEN THUMB INDUSTRIES INC.: COMPANY SNAPSHOT
FIGURE 24 CURALEAF HOLDINGS, INC.: COMPANY SNAPSHOT
FIGURE 25 CRONOS GROUP INC.: COMPANY SNAPSHOT
FIGURE 26 ECOFIBRE LIMITED: COMPANY SNAPSHOT
FIGURE 27 GENCANNA: COMPANY SNAPSHOT
FIGURE 28 HEMPFLAX BV: COMPANY SNAPSHOT
FIGURE 29 KONOPLEX GROUP: COMPANY SNAPSHOT
FIGURE 30 HEMP OIL CANADA: COMPANY SNAPSHOT
FIGURE 31 BAFA: COMPANY SNAPSHOT
FIGURE 32 DUN AGRO HEMP GROUP: COMPANY SNAPSHOT
DOWNLOAD FREE SAMPLE REPORT
License Type
SPEAK WITH OUR ANALYST
Want to know more about the report or any specific requirement?
WANT TO CUSTOMIZE THE REPORT?
Our Clients Speak
We asked them to research ‘ Equipment market’ all over the world, and their whole arrangement was helpful to us. thehealthanalytics.com insightful analysis and reports contributed to our current analysis and in creating a future strategy. Besides, the te
Yosuke Mitsui
Senior Associate Construction Equipment Sales & Marketing
We asked them to research ‘Equipment market’ all over the world, and their whole arrangement was helpful to us. thehealthanalytics.com insightful analysis and reports contributed to our current analysis and in creating a future strategy. Besides, the te


