

Base Year Value ()
x.x %
x.x %
CAGR ()
x.x %
x.x %
Forecast Year Value ()
x.x %
x.x %
Historical Data Period
Largest Region
Forecast Period
Mercato dei regolatori della crescita degli insetti per tipo di prodotto (inibitori della sintesi della chitina, analoghi e imitatori dell'ormone giovanile e agenti anti-ormone giovanile), forma (esca, liquido e aerosol), applicazione (agricoltura e giardini, controllo dei parassiti del bestiame, controllo dei parassiti commerciali, altri) e settore di utilizzo finale (agricoltura, controllo dei parassiti, altri) e regione, tendenze globali e previsioni dal 2022 al 2029
Instant access to hundreds of data points and trends
- Market estimates from 2014-2029
- Competitive analysis, industry segmentation, financial benchmarks
- Incorporates SWOT, Porter's Five Forces and risk management frameworks
- PDF report or online database with Word, Excel and PowerPoint export options
- 100% money back guarantee
Panoramica del mercato dei regolatori della crescita degli insetti
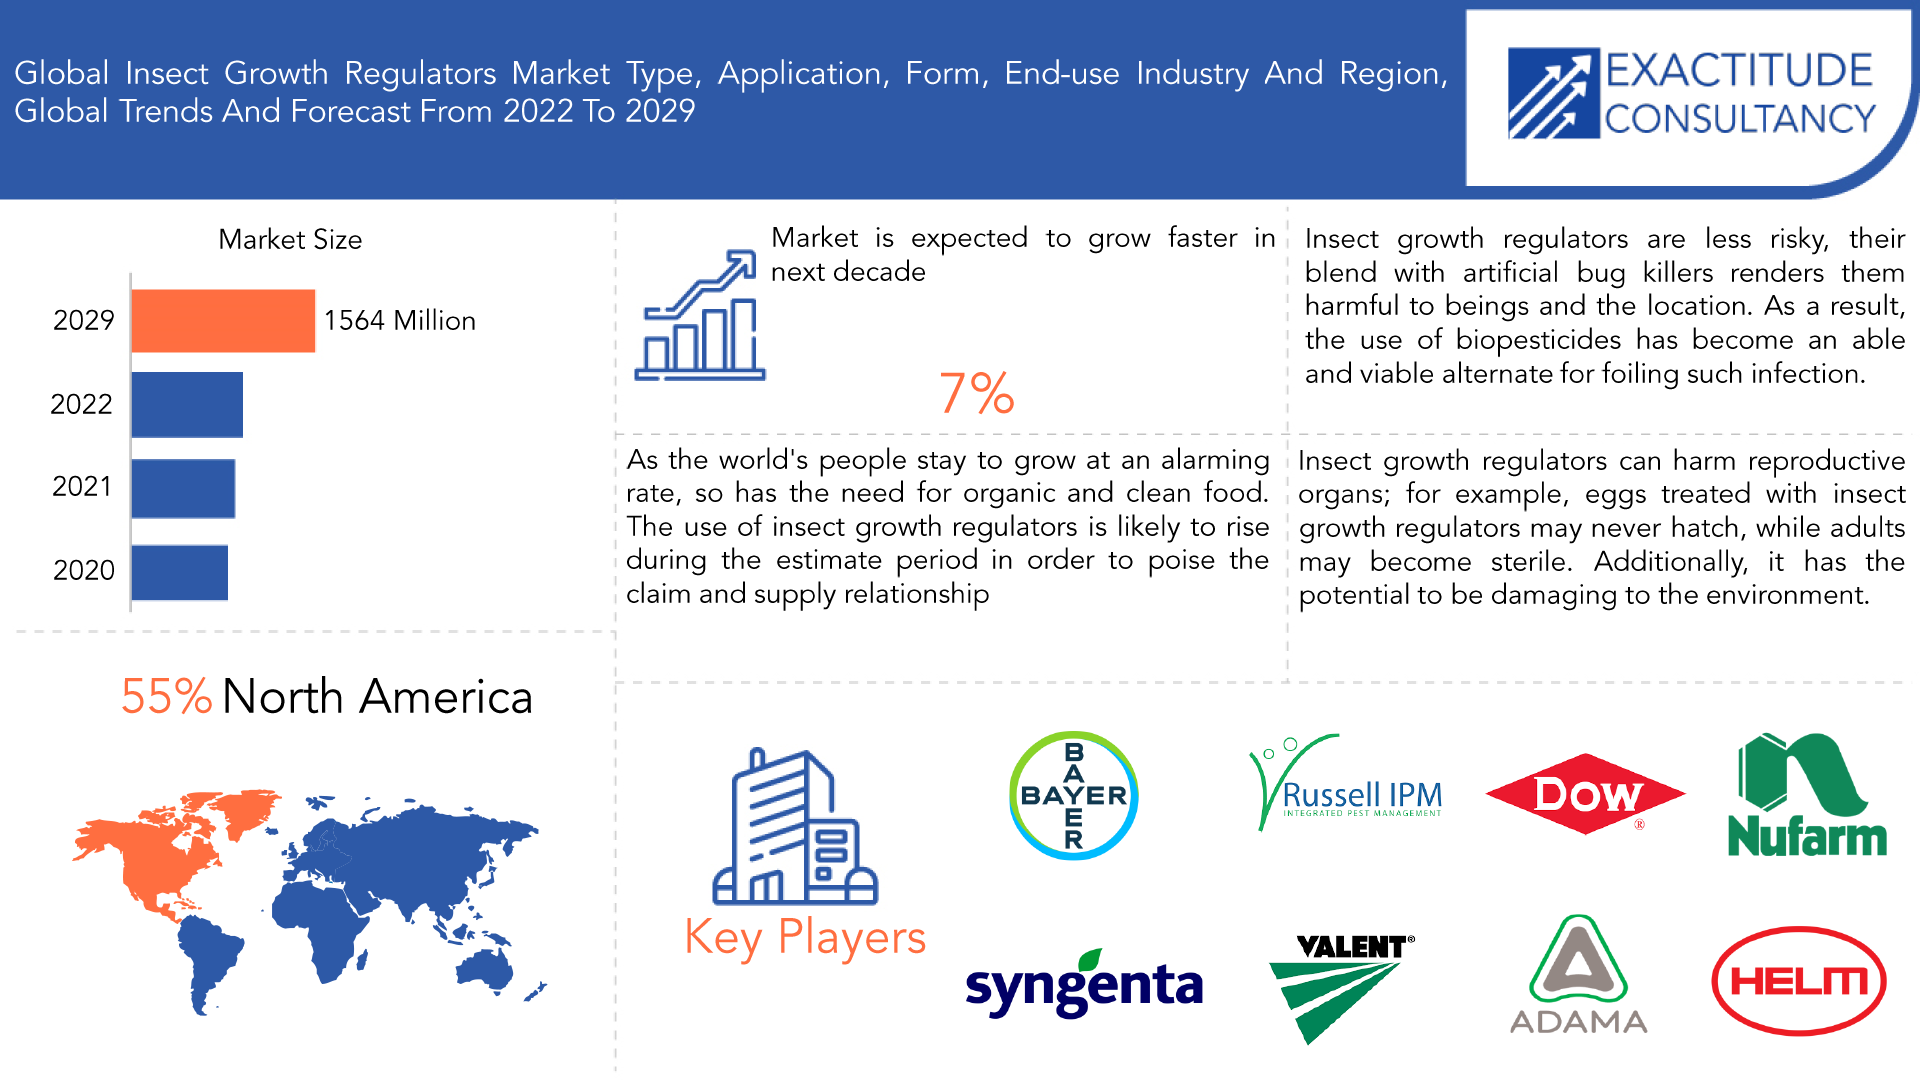
Si prevede che il mercato globale dei regolatori della crescita degli insetti crescerà al 7% di CAGR dal 2022 al 2029. Si prevede che raggiungerà oltre 1564 milioni di USD entro il 2029 dai 1037 milioni di USD del 2022.
I regolatori della crescita degli insetti (IGR) sono sostanze chimiche che inibiscono la crescita, lo sviluppo e la metamorfosi degli insetti. Tra queste ci sono analoghi sintetici di ormoni degli insetti come ecdisi e juvenoidi, nonché sostanze chimiche non ormonali come inibitori precoci (anti JH) e della produzione di chitina. Imitano gli ormoni presenti nel corpo degli insetti e ostacolano la riproduzione, la schiusa delle uova e la muta in una varietà di insetti, tra cui pulci, scarafaggi e zanzare. Gli IGR sono molto richiesti perché sono economici, biodegradabili, non persistenti, non inquinanti e non tossici per gli esseri umani, gli animali e le piante.
Con l'espansione della popolazione, la limitata terra arabile e la crescente necessità di cibo, gli agricoltori stanno aumentando l'applicazione di pesticidi per aumentare la produzione agricola. Di conseguenza, il suolo e le falde acquifere sono stati contaminati. Inoltre, la resistenza degli insetti all'uso ripetuto di pesticidi sintetici, nonché una maggiore conoscenza dell'impatto dannoso dei pesticidi sulla terra arabile e sulla salute umana, stanno aumentando positivamente le vendite di IGR in tutto il mondo.
| ATTRIBUTO | DETTAGLI |
| Periodo di studio | 2022-2029 |
| Anno base | 2021 |
| Anno stimato | 2022 |
| Anno previsto | 2022-2029 |
| Periodo storico | 2018-2022 |
| Unità | Valore (MILIONI DI USD) |
| Segmentazione | Per tipo di prodotto, forma, applicazione, settore dell'utente finale e regione. |
| Per tipo di prodotto |
|
| Per modulo |
|
| Per applicazione |
|
| Per settore dell'utente finale |
|
| Per regione |
|
Inoltre, c'è un aumento nell'uso di prodotti per la produzione di colture ecocompatibili, che sta aumentando le vendite di Igrs poiché sono estremamente facili da usare su colture come cotone, grano, pomodori e mais. Inoltre, data la loro grande efficienza, gli Igrs vengono sempre più utilizzati nei settori agricolo, residenziale e commerciale. Questo, insieme all'uso globale in espansione di pratiche agricole biologiche, sta anche contribuendo alla crescita del mercato. Si prevede che fattori aggiuntivi, come le crescenti preoccupazioni ambientali e la maggiore consapevolezza dei servizi professionali di controllo dei parassiti , guideranno l'espansione del mercato.
I regolatori della crescita degli insetti sono composti che impediscono agli insetti di crescere e svilupparsi. Sono usati per fermare il ciclo di vita degli insetti fastidiosi impedendo loro di raggiungere la maturità e quindi di riprodursi. Gli insetti sviluppano resistenza ai pesticidi, quindi gli agricoltori ora impiegano insetticidi ad ampio spettro, che alla fine portano alla perdita di resistenza. Di conseguenza, gli agricoltori si stanno rivolgendo ai regolatori della crescita degli insetti come alternativa ai pesticidi ad ampio spettro.
I regolatori della crescita degli insetti sono anche più selettivi e meno dannosi per l'ambiente. Sono utilizzati principalmente in applicazioni residenziali, commerciali e agricole e gli agricoltori preferiscono i regolatori degli insetti agli insetticidi ad ampio spettro. Analoghi e imitatori dell'ormone giovanile, inibitori della sintesi della chitina e agenti anti-ormone giovanile sono i tre tipi di regolatori dello sviluppo degli insetti.
In alcuni insetti, la chitina è essenziale per la formazione dell'esoscheletro. L'inibitore chimico della sintesi della chitina limita la creazione di chitina, che aiuta nello sviluppo dell'esoscheletro in alcuni insetti. È noto che lo sviluppo degli insetti è interrotto da analoghi e imitatori dell'ormone giovanile. L'uso di IGR provoca sterilizzazione, interruzione del comportamento e interruzione della diapausa.
[caption id="allegato_22814" align="aligncenter" width="1920"]
Frequently Asked Questions
•What Is The Worth Of The Global Insect Growth Regulators Market?
The Global Insect Growth Regulators Market Is Expected To Grow At 7% CAGR From 2022 To 2029. It Is Expected To Reach Above USD 1564 Million By 2029 From USD 1037 Million In 2022.
•What Are Some Of The Market's Driving Forces?
Insect Growth Regulators (Igrs) Are Chemicals That Inhibit The Growth, Development, And Metamorphosis Of Insects. These Include Synthetic Analogs Of Insect Hormones Like Ecdysis And Juvenoids, As Well As Non-Hormonal Chemicals Such As Precocious (Anti JH) And Chitin Production Inhibitors. They Imitate The Hormones Found Within The Insect's Body And Hinder Reproduction, Egg Hatching, And Molting In A Variety Of Insects, Including Fleas, Cockroaches, And Mosquitoes. Igrs Are In High Demand As They Are Cheap, Biodegradable, Non-Persistent, Non-Polluting, And Non-Toxic To Humans, Animals, And Plants.
•Which Are The Top Companies To Hold The Market Share In The Insect Growth Regulators Market?
The Insect Growth Regulators Market Key Players Include Bayer AG, Central Life Sciences, Syngenta AG, Dow Agrosciences, Helm Agro Us, Nufarm, Russell IPM, Valent U.S.A LLC, Mclaughlin Gormley King Co. Inc, Sumitomo Chemical Company, Control Solutions Inc, Central Garden & Pet Company And ADAMA India Private Limited.
•What Is The Leading Application Of The Insect Growth Regulators Market?
Insect Growth Regulators Are Compounds That Prevent Insects From Growing And Developing. It Is Used To Stop The Life Cycle Of Nuisance Insects By Preventing Them From Reaching Maturity And So Preventing Them From Reproducing. Insects Develop Resistance To Pesticides; Thus, Farmers Now Employ Broad-Spectrum Insecticides, Which Eventually Lead To Resistance Loss. As A Result, Farmers Are Turning To Insect Growth Regulators As An Alternative To Broad-Spectrum Pesticides.
•Which Is The Largest Regional Market For Insect Growth Regulators Market?
The Market’s Largest Share Is In The North American Region.
Insect Growth Regulators Market Segment Analysis
The Market Is Divided Into Three Types Juvenile Hormone Analogs And Mimics, Chitin Synthesis Inhibitors, And Anti-Juvenile Hormone Agents. Over The Projection Period, The Chitin Synthesis Inhibitors Segment Will Have The Biggest Market Share. The Potential Of Chitin Synthesis Inhibitors To Restrict Early Growth In Insects By Inactivating Chitin Synthesis, Which Is Crucial For Exoskeleton Development, Is One Of The Aspects That Can Be Ascribed To Their Increased Need For The Chitin Synthesis Inhibitors Section.
The Market Is Divided Into Three Sections Based On The Application Of Livestock Pests, Agricultural Applications, And Commercial Pest Control. Agriculture Applications Will Account For The Majority Of Market Share Over The Projection Period. The Elements That May Be Linked To A Paradigm Change As A Result Of Increased Consumer Awareness Are Boosting Demand For This Market.
The Market Is Divided Into Three Types Based On The Form Aerosol, Bait, And Liquid. The Sector Of Liquid Insect Growth Regulators Has The Biggest Market Share. These Types Of Concentrates Have A Longer Shelf Life Due To The Considerations Mentioned Above. Insect Growth Regulator Chemicals Are Available In A Variety Of Concentrate Forms And Are Often Juvenile Hormone Analogs And Mimics. They Prevent The Larvae From Developing Into Adults. As A Result, The Liquid Form Sector Is Rapidly Expanding.
[caption id="attachment_22818" align="aligncenter" width="1920"]
Insect Growth Regulators Market Players
The Insect Growth Regulators Market Key Players Include Bayer AG, Central Life Sciences, Syngenta AG, Dow Agrosciences, Helm Agro Us, Nufarm, Russell IPM, Valent U.S.A. LLC, Mclaughlin Gormley King Co. Inc, Sumitomo Chemical Company, Control Solutions Inc, Central Garden & Pet Company And ADAMA India Private Limited. For Corporate Expansion, These Key Leaders Are Implementing Strategic Formulations Such As New Product Development And Commercialization, Commercial Expansion, And Distribution Agreements. Moreover, These Participants Are Substantially Spending On Product Development, Which Is Fueling Revenue Generation. Recent Developments:- March 2023 - Bayer Revealed The Latest Developments In The Continuing Transformation Of Its Pharmaceutical Company At Its Annual Pharma Media Day 2023, Concentrating On Advancing Innovative Healthcare Solutions For The Benefit Of Patients And Providing Long-Term, Sustainable Business Success.
- April 2022 - Syngenta Seed Care And Biocare’s Crop Solutions Announced To Work Together To Bring New Biological Seed Treatments To Market.
- March 2023 - Dow (NYSE: Dow) Showcased Its Most Recent Revolutionary Ingredients At In-Cosmetics Global 2023, Which Takes Place March 28-30 In Barcelona, Spain (Booth N90). The New Product Released, Which Includes The Introduction Of The E-Collaboration 2.0 Concepts Collection, Commemorates One Of The Broadest Portfolios In The Personal Care Market That Focused On Sustainable And High-Performance Solutions.
Who Should Buy? Or Key Stakeholders
- Investors
- Food And Beverage Industry
- Medical Technology Companies
- Healthcare And Personal Care Firms
- Research Organizations
- Regulatory Authorities
- Institutional & Retail Players
- Others
Insect Growth Regulators Market Regional Analysis
The Insect Growth Regulators Market By Region Includes North America, Asia-Pacific (APAC), Europe, South America, And Middle East & Africa (MEA).
- North America: Includes The US, Canada, Mexico
- Asia Pacific: Includes China, Japan, South Korea, India, Australia, ASEAN, And Rest Of APAC
- Europe: Includes The UK, Germany, France, Italy, Spain, Russia, And The Rest Of Europe
- South America: Includes Brazil, Argentina, And Rest Of South America
- Middle East & Africa: Includes Turkey, UAE, Saudi Arabia, South Africa, And The Rest Of MEA
North America Leads The Global Market, Followed By Europe. The Demand In North America Is Mostly Driven By Health Concerns, Which Have Resulted In A Greater Acceptance Of Safer, Eco-Friendly Alternatives To Pesticides. Moreover, New Packaging, As Well As Product Developments Along With High Living Standards, Are Complementing Product Demand. The Use Of Environmentally Friendly Crop Production Products Is Increasing, Which Is Driving The Sales Of Igrs Since They Are Very Convenient For Use On Crops Such As Cotton, Wheat, Tomatoes, And Maize. Furthermore, Since Their Great Efficiency, Igrs Are Increasingly Being Used In The Agriculture, Residential, And Commercial Sectors. This, Together With The Expanding Global Use Of Organic Agricultural Practices, Is Also Contributing To Market Growth. Additional Factors, Such As Rising Environmental Concerns And Increased Awareness Of Professional Pest Control Services, Are Expected To Drive Market Expansion.
Throughout The Predicted Period, Asia Pacific Is Expected To Expand The Quickest. Increasing Demand Is Being Driven By Increased Knowledge Of Professional Pest Control Services, A Better Standard Of Life, An Expanding Middle-Income Class Population, And Increased Health Awareness. Various Research And Development Efforts Carried Out In The Region Would Contribute To A Growing Interest In Igrs Among Farmers, Resulting In Increased Demand For The Worldwide Market.
[caption id="attachment_22819" align="aligncenter" width="1920"]
Key Market Segments: Insects Growth Regulators Market
Insect Growth Regulators Market By Product Type, 2022-2029, (USD Million)- Chitin Synthesis Inhibitors
- Juvenile Hormone Analogs
- Mimics
- Anti-Juvenile Hormone Agents
- Bait
- Liquid
- Aerosol
- Agricultural & Gardens
- Livestock Pest Control
- Commercial Pest Control
- Others
- Agriculture
- Pest Control
- Others
- North America
- Asia Pacific
- Europe
- South America
- Middle East And Africa
Exactitude Consultancy Services Key Objectives:
- Increasing Sales And Market Share
- Developing New Technology
- Improving Profitability
- Entering New Markets
- Enhancing Brand Reputation
Key Question Answered
- What Is The Expected Growth Rate Of The Insect Growth Regulators Market Over The Next 7 Years?
- What Are The End-User Industries Driving Demand For The Market And What Is Their Outlook?
- What Are The Opportunities For Growth In Emerging Markets Such As Asia-Pacific, The Middle East, And Africa?
- How Is The Economic Environment Affecting The Insect Growth Regulators Market, Including Factors Such As Interest Rates, Inflation, And Exchange Rates?
- What Is The Expected Impact Of Government Policies And Regulations On The Insect Growth Regulators Market?
- What Are The Key Drivers Of Growth In The Insect Growth Regulators Market?
- Who Are The Market’s Major Players, And What Is Their Market Share?
- What Are The Insect Growth Regulators Market's Distribution Channels And Supply Chain Dynamics?
- What Are The Technological Advancements And Innovations In The Insect Growth Regulators Market And Their Impact On Product Development And Growth?
- What Are The Regulatory Considerations And Their Impact On The Market?
- What Are The Challenges Faced By Players In The Insect Growth Regulators Market And How Are They Addressing These Challenges?
- What Are The Opportunities For Growth And Expansion In The Insect Growth Regulators Market?
- What Are The Market's Product Offerings/ Service Offerings And Specifications Of Leading Players?
- What Is The Pricing Trend Of Insect Growth Regulators In The Market And What Is The Impact Of Raw Material Prices On The Price Trend?
- INTRODUZIONE
- DEFINIZIONE DI MERCATO
- SEGMENTAZIONE DEL MERCATO
- TEMPI DI RICERCA
- ASSUNZIONI E LIMITAZIONI
- METODOLOGIA DI RICERCA
- ESTRAZIONE DATI
- RICERCA SECONDARIA
- RICERCA PRIMARIA
- PARERI DEGLI ESPERTI IN MATERIA
- CONTROLLI DI QUALITÀ
- RECENSIONE FINALE
- TRIANGOLAZIONE DEI DATI
- APPROCCIO DAL BASSO VERSO L'ALTO
- APPROCCIO TOP-DOWN
- FLUSSO DI RICERCA
- FONTI DEI DATI
- ESTRAZIONE DATI
- SINTESI
- PANORAMICA DEL MERCATO
- PROSPETTIVE DEL MERCATO GLOBALE DEI REGOLATORI DELLA CRESCITA DEGLI INSETTI
- FATTORI DI MERCATO
- LIMITAZIONI DI MERCATO
- OPPORTUNITÀ DI MERCATO
- IMPATTO DEL COVID-19 SUL MERCATO DEI REGOLATORI DELLA CRESCITA DEGLI INSETTI
- MODELLO DELLE CINQUE FORZE DI PORTER
- MINACCIA DAI NUOVI ENTRANSI
- MINACCIA DA SOSTITUTI
- POTERE CONTRATTUALE DEI FORNITORI
- POTERE CONTRATTUALE DEI CLIENTI
- GRADO DI COMPETIZIONE
- ANALISI DELLA CATENA DEL VALORE DEL SETTORE
- PROSPETTIVE DEL MERCATO GLOBALE DEI REGOLATORI DELLA CRESCITA DEGLI INSETTI
- MERCATO GLOBALE DEI REGOLATORI DELLA CRESCITA DEGLI INSETTI PER TIPO DI PRODOTTO, 2022-2029, (MILIONI DI USD)
- INIBITORI DELLA SINTESI DELLA CHITINA
- ANALOGHI DEGLI ORMONI GIOVANILI
- IMMIGRAZIONI
- AGENTI ORMONI ANTI-GIOVANILI
- GLOBAL INSECT GROWTH REGULATORS MARKET BY FORM, 2022-2029, (USD MILLION)
- BAIT
- LIQUID
- AEROSOL
- GLOBAL INSECT GROWTH REGULATORS MARKET BY APPLICATION, 2022-2029, (USD MILLION)
- AGRICULTURAL & GARDENS
- LIVESTOCK PEST CONTROL
- COMMERCIAL PEST CONTROL
- OTHERS
- GLOBAL INSECT GROWTH REGULATORS MARKET BY END-USER INDUSTRY, 2022-2029, (USD MILLION)
- AGRICULTURE
- PEST CONTROL
- OTHERS
- GLOBAL INSECT GROWTH REGULATORS MARKET BY REGION, 2022-2029, (USD BILLION)
- NORTH AMERICA
- US
- CANADA
- MEXICO
- SOUTH AMERICA
- BRAZIL
- ARGENTINA
- COLOMBIA
- REST OF SOUTH AMERICA
- EUROPE
- GERMANY
- UK
- FRANCE
- ITALY
- SPAIN
- RUSSIA
- REST OF EUROPE
- ASIA PACIFIC
- INDIA
- CHINA
- JAPAN
- SOUTH KOREA
- AUSTRALIA
- SOUTH-EAST ASIA
- REST OF ASIA PACIFIC
- MIDDLE EAST AND AFRICA
- UAE
- SAUDI ARABIA
- SOUTH AFRICA
- REST OF MIDDLE EAST AND AFRICA
- NORTH AMERICA
- COMPANY PROFILES* (BUSINESS OVERVIEW, COMPANY SNAPSHOT, PRODUCTS OFFERED, RECENT DEVELOPMENTS)
- BAYER AG
- CENTRAL LIFE SCIENCE
- SYNGENTA AG
- DOW AGROSCIENCES
- HELM AGRO US
- NUFARM
- RUSSELL IPM
- VALENT U.S.A. LLC
- MCLAUGHLIN GORMLEY KING CO. INC
- SUMITOMO CHEMICAL COMPANY
- CONTROL SOLUTIONS INC
- CENTRAL GARDEN & PET COMPANY
- ADAMA INDIA PRIVATE LIMITED *THE COMPANY LIST IS INDICATIVE
LIST OF TABLES
TABLE 1 GLOBAL INSECT GROWTH REGULATORS MARKET BY TYPE (USD MILLION) 2022-2029
TABLE 2 GLOBAL INSECT GROWTH REGULATORS MARKET BY APPLICATION (USD MILLION) 2022-2029
TABLE 3 GLOBAL INSECT GROWTH REGULATORS MARKET BY END-USER (USD MILLION) 2022-202
TABLE 4 GLOBAL INSECT GROWTH REGULATORS MARKET BY FORM (USD MILLION) 2022-2029
TABLE 5 GLOBAL INSECT GROWTH REGULATORS MARKET BY REGION (USD MILLION) 2022-2029
TABLE 6 NORTH AMERICA INSECT GROWTH REGULATORS MARKET BY COUNTRY (USD MILLION) 2022-2029
TABLE 7 NORTH AMERICA INSECT GROWTH REGULATORS MARKET BY TYPE (USD MILLION) 2022-2029
TABLE 8 NORTH AMERICA INSECT GROWTH REGULATORS MARKET BY APPLICATION (USD MILLION) 2022-2029
TABLE 9 NORTH AMERICA INSECT GROWTH REGULATORS MARKET BY END-USER (USD MILLION) 2022-2029
TABLE 10 NORTH AMERICA INSECT GROWTH REGULATORS MARKET BY FORM (USD MILLION) 2022-2029
TABLE 11 US INSECT GROWTH REGULATORS MARKET BY TYPE (USD MILLION) 2022-2029
TABLE 12 US INSECT GROWTH REGULATORS MARKET BY APPLICATION (USD MILLION) 2022-2029
TABLE 13 US INSECT GROWTH REGULATORS MARKET BY END-USER (USD MILLION) 2022-2029
TABLE 14 US INSECT GROWTH REGULATORS MARKET BY FORM (USD MILLION) 2022-2029
TABLE 15 CANADA INSECT GROWTH REGULATORS MARKET BY TYPE (USD MILLION) 2022-2029
TABLE 16 CANADA INSECT GROWTH REGULATORS MARKET BY APPLICATION (USD MILLION) 2022-2029
TABLE 17 CANADA INSECT GROWTH REGULATORS MARKET BY END-USER (USD MILLION) 2022-2029
TABLE 18 CANADA INSECT GROWTH REGULATORS MARKET BY FORM (USD MILLION) 2022-2029
TABLE 19 MEXICO INSECT GROWTH REGULATORS MARKET BY TYPE (USD MILLION) 2022-2029
TABLE 20 MEXICO INSECT GROWTH REGULATORS MARKET BY APPLICATION (USD MILLION) 2022-2029
TABLE 21 MEXICO INSECT GROWTH REGULATORS MARKET BY END-USER (USD MILLION) 2022-2029
TABLE 22 MEXICO INSECT GROWTH REGULATORS MARKET BY FORM (USD MILLION) 2022-2029
TABLE 23 SOUTH AMERICA INSECT GROWTH REGULATORS MARKET BY COUNTRY (USD MILLION) 2022-2029
TABLE 24 SOUTH AMERICA INSECT GROWTH REGULATORS MARKET BY TYPE (USD MILLION) 2022-2029
TABLE 25 SOUTH AMERICA INSECT GROWTH REGULATORS MARKET BY APPLICATION (USD MILLION) 2022-2029
TABLE 26 SOUTH AMERICA INSECT GROWTH REGULATORS MARKET BY END-USER (USD MILLION) 2022-2029
TABLE 27 SOUTH AMERICA INSECT GROWTH REGULATORS MARKET BY FORM (USD MILLION) 2022-2029
TABLE 28 BRAZIL INSECT GROWTH REGULATORS MARKET BY TYPE (USD MILLION) 2022-2029
TABLE 29 BRAZIL INSECT GROWTH REGULATORS MARKET BY APPLICATION (USD MILLION) 2022-2029
TABLE 30 BRAZIL INSECT GROWTH REGULATORS MARKET BY END-USER (USD MILLION) 2022-2029
TABLE 31 BRAZIL INSECT GROWTH REGULATORS MARKET BY FORM (USD MILLION) 2022-2029
TABLE 32 ARGENTINA INSECT GROWTH REGULATORS MARKET BY TYPE (USD MILLION) 2022-2029
TABLE 33 ARGENTINA INSECT GROWTH REGULATORS MARKET BY APPLICATION (USD MILLION) 2022-2029
TABLE 34 ARGENTINA INSECT GROWTH REGULATORS MARKET BY END-USER (USD MILLION) 2022-2029
TABLE 35 ARGENTINA INSECT GROWTH REGULATORS MARKET BY FORM (USD MILLION) 2022-2029
TABLE 36 COLOMBIA INSECT GROWTH REGULATORS MARKET BY TYPE (USD MILLION) 2022-2029
TABLE 37 COLOMBIA INSECT GROWTH REGULATORS MARKET BY APPLICATION (USD MILLION) 2022-2029
TABLE 38 COLOMBIA INSECT GROWTH REGULATORS MARKET BY END-USER (USD MILLION) 2022-2029
TABLE 39 COLOMBIA INSECT GROWTH REGULATORS MARKET BY FORM (USD MILLION) 2022-2029
TABLE 40 REST OF SOUTH AMERICA INSECT GROWTH REGULATORS MARKET BY TYPE (USD MILLION) 2022-2029
TABLE 41 REST OF SOUTH AMERICA INSECT GROWTH REGULATORS MARKET BY APPLICATION (USD MILLION) 2022-2029
TABLE 42 REST OF SOUTH AMERICA INSECT GROWTH REGULATORS MARKET BY END-USER (USD MILLION) 2022-2029
TABLE 43 REST OF SOUTH AMERICA INSECT GROWTH REGULATORS MARKET BY FORM (USD MILLION) 2022-2029
TABLE 44 ASIA-PACIFIC INSECT GROWTH REGULATORS MARKET BY COUNTRY (USD MILLION) 2022-2029
TABLE 45 ASIA-PACIFIC INSECT GROWTH REGULATORS MARKET BY TYPE (USD MILLION) 2022-2029
TABLE 46 ASIA-PACIFIC INSECT GROWTH REGULATORS MARKET BY APPLICATION (USD MILLION) 2022-2029
TABLE 47 ASIA-PACIFIC INSECT GROWTH REGULATORS MARKET BY END-USER (USD MILLION) 2022-2029
TABLE 48 ASIA-PACIFIC INSECT GROWTH REGULATORS MARKET BY FORM (USD MILLION) 2022-2029
TABLE 49 INDIA INSECT GROWTH REGULATORS MARKET BY TYPE (USD MILLION) 2022-2029
TABLE 50 INDIA INSECT GROWTH REGULATORS MARKET BY APPLICATION (USD MILLION) 2022-2029
TABLE 51 INDIA INSECT GROWTH REGULATORS MARKET BY END-USER (USD MILLION) 2022-2029
TABLE 52 INDIA INSECT GROWTH REGULATORS MARKET BY FORM (USD MILLION) 2022-2029
TABLE 53 CHINA INSECT GROWTH REGULATORS MARKET BY TYPE (USD MILLION) 2022-2029
TABLE 54 CHINA INSECT GROWTH REGULATORS MARKET BY APPLICATION (USD MILLION) 2022-2029
TABLE 55 CHINA INSECT GROWTH REGULATORS MARKET BY END-USER (USD MILLION) 2022-2029
TABLE 56 CHINA INSECT GROWTH REGULATORS MARKET BY FORM (USD MILLION) 2022-2029
TABLE 57 JAPAN INSECT GROWTH REGULATORS MARKET BY TYPE (USD MILLION) 2022-2029
TABLE 58 JAPAN INSECT GROWTH REGULATORS MARKET BY APPLICATION (USD MILLION) 2022-2029
TABLE 59 JAPAN INSECT GROWTH REGULATORS MARKET BY END-USER (USD MILLION) 2022-2029
TABLE 60 JAPAN INSECT GROWTH REGULATORS MARKET BY FORM (USD MILLION) 2022-2029
TABLE 61 SOUTH KOREA INSECT GROWTH REGULATORS MARKET BY TYPE (USD MILLION) 2022-2029
TABLE 62 SOUTH KOREA INSECT GROWTH REGULATORS MARKET BY APPLICATION (USD MILLION) 2022-2029
TABLE 63 SOUTH KOREA INSECT GROWTH REGULATORS MARKET BY END-USER (USD MILLION) 2022-2029
TABLE 64 SOUTH KOREA INSECT GROWTH REGULATORS MARKET BY FORM (USD MILLION) 2022-2029
TABLE 65 AUSTRALIA INSECT GROWTH REGULATORS MARKET BY TYPE (USD MILLION) 2022-2029
TABLE 66 AUSTRALIA INSECT GROWTH REGULATORS MARKET BY APPLICATION (USD MILLION) 2022-2029
TABLE 67 AUSTRALIA INSECT GROWTH REGULATORS MARKET BY END-USER (USD MILLION) 2022-2029
TABLE 68 AUSTRALIA INSECT GROWTH REGULATORS MARKET BY FORM (USD MILLION) 2022-2029
TABLE 69 SOUTH-EAST ASIA INSECT GROWTH REGULATORS MARKET BY TYPE (USD MILLION) 2022-2029
TABLE 70 SOUTH-EAST ASIA INSECT GROWTH REGULATORS MARKET BY APPLICATION (USD MILLION) 2022-2029
TABLE 71 SOUTH-EAST ASIA INSECT GROWTH REGULATORS MARKET BY END-USER (USD MILLION) 2022-2029
TABLE 72 SOUTH-EAST ASIA INSECT GROWTH REGULATORS MARKET BY FORM (USD MILLION) 2022-2029
TABLE 73 REST OF ASIA PACIFIC INSECT GROWTH REGULATORS MARKET BY TYPE (USD MILLION) 2022-2029
TABLE 74 REST OF ASIA PACIFIC INSECT GROWTH REGULATORS MARKET BY APPLICATION (USD MILLION) 2022-2029
TABLE 75 REST OF ASIA PACIFIC INSECT GROWTH REGULATORS MARKET BY END-USER (USD MILLION) 2022-2029
TABLE 76 REST OF ASIA PACIFIC INSECT GROWTH REGULATORS MARKET BY FORM (USD MILLION) 2022-2029
TABLE 77 EUROPE INSECT GROWTH REGULATORS MARKET BY COUNTRY (USD MILLION) 2022-2029
TABLE 78 EUROPE INSECT GROWTH REGULATORS MARKET BY TYPE (USD MILLION) 2022-2029
TABLE 79 EUROPE INSECT GROWTH REGULATORS MARKET BY APPLICATION (USD MILLION) 2022-2029
TABLE 80 EUROPE INSECT GROWTH REGULATORS MARKET BY END-USER (USD MILLION) 2022-2029
TABLE 81 EUROPE INSECT GROWTH REGULATORS MARKET BY FORM (USD MILLION) 2022-2029
TABLE 82 GERMANY INSECT GROWTH REGULATORS MARKET BY TYPE (USD MILLION) 2022-2029
TABLE 83 GERMANY INSECT GROWTH REGULATORS MARKET BY APPLICATION (USD MILLION) 2022-2029
TABLE 84 GERMANY INSECT GROWTH REGULATORS MARKET BY END-USER (USD MILLION) 2022-2029
TABLE 85 GERMANY INSECT GROWTH REGULATORS MARKET BY FORM (USD MILLION) 2022-2029
TABLE 86 UK INSECT GROWTH REGULATORS MARKET BY TYPE (USD MILLION) 2022-2029
TABLE 87 UK INSECT GROWTH REGULATORS MARKET BY APPLICATION (USD MILLION) 2022-2029
TABLE 88 UK INSECT GROWTH REGULATORS MARKET BY END-USER (USD MILLION) 2022-2029
TABLE 89 UK INSECT GROWTH REGULATORS MARKET BY FORM (USD MILLION) 2022-2029
TABLE 90 FRANCE INSECT GROWTH REGULATORS MARKET BY TYPE (USD MILLION) 2022-2029
TABLE 91 FRANCE INSECT GROWTH REGULATORS MARKET BY APPLICATION (USD MILLION) 2022-2029
TABLE 92 FRANCE INSECT GROWTH REGULATORS MARKET BY END-USER (USD MILLION) 2022-202
TABLE 93 FRANCE INSECT GROWTH REGULATORS MARKET BY FORM (USD MILLION) 2022-2029
TABLE 94 ITALY INSECT GROWTH REGULATORS MARKET BY TYPE (USD MILLION) 2022-2029
TABLE 95 ITALY INSECT GROWTH REGULATORS MARKET BY APPLICATION (USD MILLION) 2022-2029
TABLE 96 ITALY INSECT GROWTH REGULATORS MARKET BY END-USER (USD MILLION) 2022-2029
TABLE 97 ITALY INSECT GROWTH REGULATORS MARKET BY FORM (USD MILLION) 2022-2029
TABLE 98 SPAIN INSECT GROWTH REGULATORS MARKET BY TYPE (USD MILLION) 2022-2029
TABLE 99 SPAIN INSECT GROWTH REGULATORS MARKET BY APPLICATION (USD MILLION) 2022-2029
TABLE 100 SPAIN INSECT GROWTH REGULATORS MARKET BY END-USER (USD MILLION) 2022-2029
TABLE 101 SPAIN INSECT GROWTH REGULATORS MARKET BY FORM (USD MILLION) 2022-2029
TABLE 102 RUSSIA INSECT GROWTH REGULATORS MARKET BY TYPE (USD MILLION) 2022-2029
TABLE 103 RUSSIA INSECT GROWTH REGULATORS MARKET BY APPLICATION (USD MILLION) 2022-2029
TABLE 104 RUSSIA INSECT GROWTH REGULATORS MARKET BY END-USER (USD MILLION) 2022-2029
TABLE 105 RUSSIA INSECT GROWTH REGULATORS MARKET BY FORM (USD MILLION) 2022-2029
TABLE 106 REST OF EUROPE INSECT GROWTH REGULATORS MARKET BY TYPE (USD MILLION) 2022-2029
TABLE 107 REST OF EUROPE INSECT GROWTH REGULATORS MARKET BY APPLICATION (USD MILLION) 2022-2029
TABLE 108 REST OF EUROPE INSECT GROWTH REGULATORS MARKET BY END-USER (USD MILLION) 2022-2029
TABLE 109 REST OF EUROPE INSECT GROWTH REGULATORS MARKET BY FORM (USD MILLION) 2022-2029
TABLE 110 MIDDLE EAST AND AFRICA INSECT GROWTH REGULATORS MARKET BY COUNTRY (USD MILLION) 2022-2029
TABLE 111 MIDDLE EAST AND AFRICA INSECT GROWTH REGULATORS MARKET BY TYPE (USD MILLION) 2022-2029
TABLE 112 MIDDLE EAST AND AFRICA INSECT GROWTH REGULATORS MARKET BY APPLICATION (USD MILLION) 2022-2029
TABLE 113 MIDDLE EAST AND AFRICA INSECT GROWTH REGULATORS MARKET BY END-USER (USD MILLION) 2022-2029
TABLE 114 MIDDLE EAST AND AFRICA INSECT GROWTH REGULATORS MARKET BY FORM (USD MILLION) 2022-2029
TABLE 115 UAE INSECT GROWTH REGULATORS MARKET BY TYPE (USD MILLION) 2022-2029
TABLE 116 UAE INSECT GROWTH REGULATORS MARKET BY APPLICATION (USD MILLION) 2022-2029
TABLE 117 UAE INSECT GROWTH REGULATORS MARKET BY END-USER (USD MILLION) 2022-2029
TABLE 118 UAE INSECT GROWTH REGULATORS MARKET BY FORM (USD MILLION) 2022-2029
TABLE 119 SAUDI ARABIA INSECT GROWTH REGULATORS MARKET BY TYPE (USD MILLION) 2022-2029
TABLE 120 SAUDI ARABIA INSECT GROWTH REGULATORS MARKET BY APPLICATION (USD MILLION) 2022-2029
TABLE 121 SAUDI ARABIA INSECT GROWTH REGULATORS MARKET BY END-USER (USD MILLION) 2022-2029
TABLE 122 SAUDI ARABIA INSECT GROWTH REGULATORS MARKET BY FORM (USD MILLION) 2022-2029
TABLE 123 SOUTH AFRICA INSECT GROWTH REGULATORS MARKET BY TYPE (USD MILLION) 2022-2029
TABLE 124 SOUTH AFRICA INSECT GROWTH REGULATORS MARKET BY APPLICATION (USD MILLION) 2022-2029
TABLE 125 SOUTH AFRICA INSECT GROWTH REGULATORS MARKET BY END-USER (USD MILLION) 2022-2029
TABLE 126 SOUTH AFRICA INSECT GROWTH REGULATORS MARKET BY FORM (USD MILLION) 2022-2029
TABLE 127 REST OF MIDDLE EAST AND AFRICA INSECT GROWTH REGULATORS MARKET BY TYPE (USD MILLION) 2022-2029
TABLE 128 REST OF MIDDLE EAST AND AFRICA INSECT GROWTH REGULATORS MARKET BY APPLICATION (USD MILLION) 2022-2029
TABLE 129 REST OF MIDDLE EAST AND AFRICA INSECT GROWTH REGULATORS MARKET BY END-USER (USD MILLION) 2022-2029
TABLE 130 REST OF MIDDLE EAST AND AFRICA INSECT GROWTH REGULATORS MARKET BY FORM (USD MILLION) 2022-2029
LIST OF FIGURES
FIGURE 1 MARKET DYNAMICS
FIGURE 2 MARKET SEGMENTATION
FIGURE 3 REPORT TIMELINES: YEARS CONSIDERED
FIGURE 4 DATA TRIANGULATION
FIGURE 5 BOTTOM-UP APPROACH
FIGURE 6 TOP-DOWN APPROACH
FIGURE 7 RESEARCH FLOW
FIGURE 8 GLOBAL INSECT GROWTH REGULATORS MARKET BY TYPE, USD MILLION, 2022-2029
FIGURE 9 GLOBAL INSECT GROWTH REGULATORS MARKET BY APPLICATION, USD MILLION, 2022-2029
FIGURE 10 GLOBAL INSECT GROWTH REGULATORS MARKET BY END USER, USD MILLION, 2022-2029
FIGURE 11 GLOBAL INSECT GROWTH REGULATORS MARKET BY FORM, USD MILLION, 2022-2029
FIGURE 12 GLOBAL INSECT GROWTH REGULATORS MARKET BY REGION, USD MILLION, 2022-2029
FIGURE 13 PORTER’S FIVE FORCES MODEL
FIGURE 14 GLOBAL INSECT GROWTH REGULATORS MARKET BY TYPE, USD MILLION, 2021
FIGURE 15 GLOBAL INSECT GROWTH REGULATORS MARKET BY APPLICATION USD MILLION, 2021
FIGURE 16 GLOBAL INSECT GROWTH REGULATORS MARKET BY END USER USD MILLION, 2021
FIGURE 17 GLOBAL INSECT GROWTH REGULATORS MARKET BY FORM USD MILLION, 2021
FIGURE 18 INSECT GROWTH REGULATORS MARKET BY REGION USD MILLION, 2021
FIGURE 19 MARKET SHARE ANALYSIS
FIGURE 20 BAYER AG: COMPANY SNAPSHOT
FIGURE 21 CENTRAL LIFE SCIENCES: COMPANY SNAPSHOT
FIGURE 22 SYNGENTA AG: COMPANY SNAPSHOT
FIGURE 23 DOW AGROSCIENCES: COMPANY SNAPSHOT
FIGURE 24 HELM AGRO US: COMPANY SNAPSHOT
FIGURE 25 NUFARM: COMPANY SNAPSHOT
FIGURE 26 RUSSELL IPM: COMPANY SNAPSHOT
FIGURE 27 VALENT U.S.A LLC: COMPANY SNAPSHOT
FIGURE 28 MCLAUGHLIN GORMLEY KING CO: COMPANY SNAPSHOT
DOWNLOAD FREE SAMPLE REPORT
License Type
SPEAK WITH OUR ANALYST
Want to know more about the report or any specific requirement?
WANT TO CUSTOMIZE THE REPORT?
Our Clients Speak
We asked them to research ‘ Equipment market’ all over the world, and their whole arrangement was helpful to us. thehealthanalytics.com insightful analysis and reports contributed to our current analysis and in creating a future strategy. Besides, the te
Yosuke Mitsui
Senior Associate Construction Equipment Sales & Marketing
We asked them to research ‘Equipment market’ all over the world, and their whole arrangement was helpful to us. thehealthanalytics.com insightful analysis and reports contributed to our current analysis and in creating a future strategy. Besides, the te


