

Base Year Value ()
x.x %
x.x %
CAGR ()
x.x %
x.x %
Forecast Year Value ()
x.x %
x.x %
Historical Data Period
Largest Region
Forecast Period
Mercato globale della schiuma ad alte prestazioni per tipo (silicone, poliuretano, poliammide, polietilene), per settore di utilizzo finale (edilizia, trasporti, elettricità ed elettronica, imballaggio, assistenza sanitaria) e per regione, tendenze globali e previsioni dal 2022 al 2029.
Instant access to hundreds of data points and trends
- Market estimates from 2014-2029
- Competitive analysis, industry segmentation, financial benchmarks
- Incorporates SWOT, Porter's Five Forces and risk management frameworks
- PDF report or online database with Word, Excel and PowerPoint export options
- 100% money back guarantee
Panoramica del mercato della schiuma ad alte prestazioni
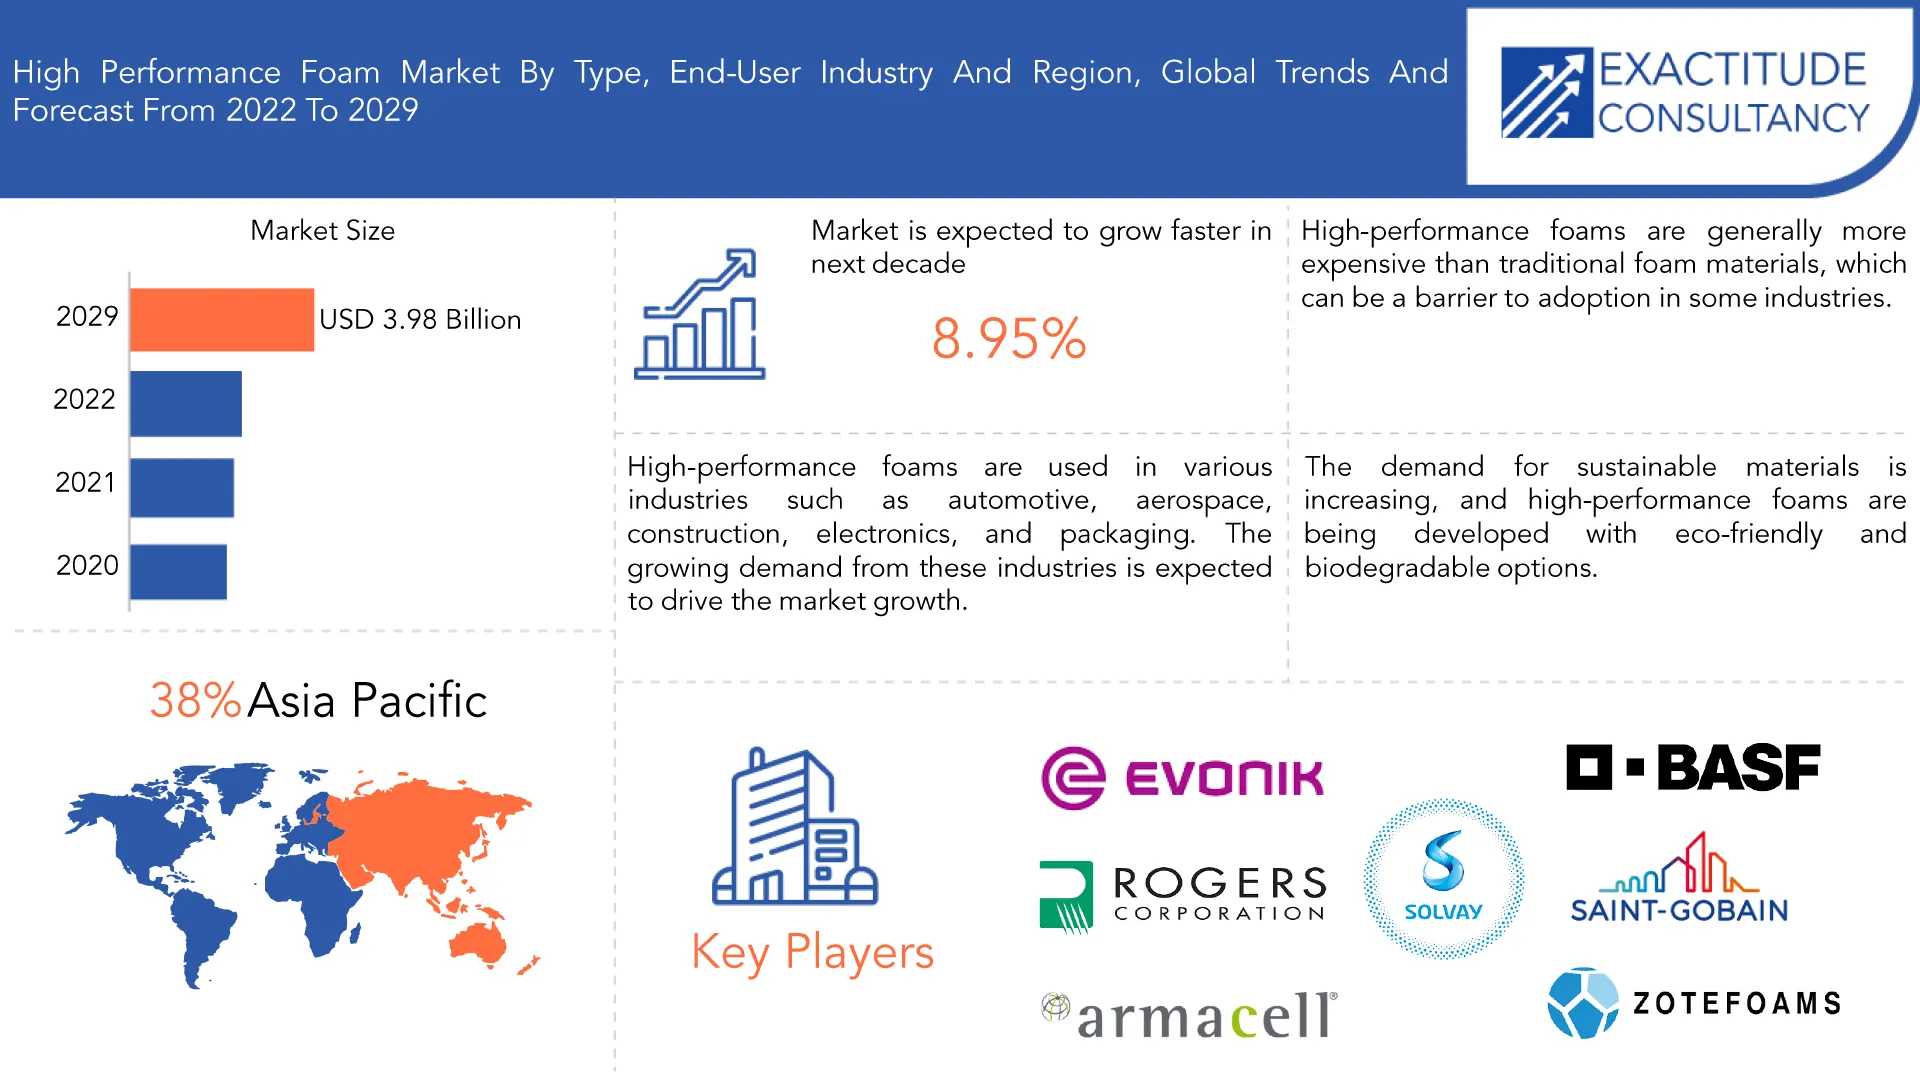
Si prevede che le dimensioni del mercato globale della schiuma ad alte prestazioni cresceranno a un CAGR superiore all'8,95% dal 2021 al 2029. Si prevede che raggiungerà oltre 3,98 miliardi di USD entro il 2029 da poco più di 1,84 miliardi di USD nel 2020.
La schiuma ad alte prestazioni ha alcune qualità speciali, come una buona recuperabilità da urti e deformazioni ripetute e la capacità di mantenere la stabilità dimensionale nonostante l'esposizione a stress, impatto e temperature estreme. Grazie a queste qualità fisiche, la schiuma ad alte prestazioni sta diventando sempre più richiesta e viene utilizzata in una varietà di settori.
Le schiume ad alte prestazioni sono utilizzate in vari settori come l'automotive, l'aerospaziale, l'edilizia, l'elettronica e l'imballaggio . Si prevede che la crescente domanda da parte di questi settori guiderà la crescita del mercato. Le schiume ad alte prestazioni offrono proprietà leggere e ad alta resistenza, che le rendono adatte all'uso in varie applicazioni come l'imbottitura, l'isolamento e l'imballaggio. I progressi tecnologici nei processi di produzione delle schiume ad alte prestazioni hanno portato allo sviluppo di prodotti migliorati con proprietà migliori come un migliore isolamento termico, resistenza al fuoco e isolamento acustico . I governi di tutto il mondo hanno implementato rigide normative per l'efficienza energetica e la protezione ambientale. Le schiume ad alte prestazioni sono una soluzione efficace per soddisfare queste normative in quanto offrono un isolamento superiore e riducono il consumo di energia. Si prevede che le crescenti industrie di utilizzo finale nelle economie emergenti come Cina, India e Brasile guideranno la domanda di schiume ad alte prestazioni. Queste economie stanno investendo molto nello sviluppo delle infrastrutture, il che dovrebbe aumentare la domanda di schiume ad alte prestazioni nel settore delle costruzioni.
| ATTRIBUTO | DETTAGLI |
| Periodo di studio | 2020-2029 |
| Anno base | 2021 |
| Anno stimato | 2022 |
| Anno previsto | 2022-2029 |
| Periodo storico | 2018-2020 |
| Unità | Valore (miliardi di USD), (chilotoni) |
| Segmentazione | Per tipo, per settore dell'utente finale, per regione |
| Per tipo |
|
| Per settore dell'utente finale |
|
| Per regione |
|
Le schiume ad alte prestazioni sono generalmente più costose dei materiali in schiuma tradizionali, il che può rappresentare un ostacolo all'adozione in alcuni settori. Alcune schiume ad alte prestazioni contengono sostanze chimiche che possono avere impatti ambientali negativi, il che può portare a una maggiore regolamentazione e a un calo della domanda. Le schiume ad alte prestazioni possono essere difficili da riciclare, il che può portare a problemi di gestione dei rifiuti e preoccupazioni ambientali.
La domanda di materiali sostenibili è in aumento e le schiume ad alte prestazioni vengono sviluppate con opzioni ecologiche e biodegradabili. Le schiume ad alte prestazioni vengono utilizzate in dispositivi e apparecchiature mediche e si prevede che il crescente settore sanitario aumenterà la domanda di queste schiume. Le schiume ad alte prestazioni vengono utilizzate nell'industria automobilistica per la riduzione del peso, la sicurezza e il comfort. Si prevede che la crescente domanda di veicoli leggeri e a basso consumo di carburante aumenterà la domanda di queste schiume. Il mercato delle schiume ad alte prestazioni è altamente competitivo e le aziende stanno investendo in R&S per sviluppare nuovi prodotti con proprietà migliori e ridurre i costi di produzione. La nanotecnologia viene utilizzata per migliorare le proprietà delle schiume ad alte prestazioni, il che può portare allo sviluppo di nuovi prodotti e applicazioni.
La pandemia ha causato interruzioni nella catena di fornitura globale, influenzando la disponibilità di materie prime, trasporti e logistica. Ciò ha portato a fluttuazioni dei prezzi e ritardi nella consegna, che hanno avuto un impatto sulla produzione e sulle vendite di prodotti in schiuma ad alte prestazioni. La domanda di prodotti in schiuma ad alte prestazioni è variata a seconda dei settori durante la pandemia. Ad esempio, l'industria automobilistica ha assistito a un calo della domanda a causa delle chiusure delle fabbriche e della riduzione della spesa dei consumatori. Al contrario, il settore sanitario ha assistito a un aumento della domanda di apparecchiature e dispositivi medici che utilizzano materiali in schiuma ad alte prestazioni, come respiratori e visiere. Guardando al futuro, si prevede che il mercato della schiuma ad alte prestazioni continuerà la sua traiettoria di crescita nel mondo post-pandemia. È probabile che il mercato trarrà vantaggio dalla crescente domanda di materiali leggeri ed efficienti dal punto di vista energetico, nonché dalla crescente tendenza verso la sostenibilità e l'eco-compatibilità.
[caption id="allegato_23958" align="aligncenter" width="1920"]
Frequently Asked Questions
• Who are the key players in the global high performance foam market?
Some key players operating in the global high performance foam market include 3M, Evonik Industries AG, Rogers Corporation, BASF SE, DuPont, Sekisui Alveo, Armacell, SABIC, Saint-Gobain, Zotefoams Plc, Solvay.
• What are the factors driving the global high performance foam market?
High-performance foams are used in various industries such as automotive, aerospace, construction, electronics, and packaging. The growing demand from these industries is expected to drive the market growth.
• How big is the global high performance foam market?
The global high performance foam market size was estimated at USD 2 billion in 2021 and is expected to reach USD 3.98 billion in 2029.
• What is the global high performance foam market growth?
The global high performance foam market is expected to grow at a compound annual growth rate of 8.95% from 2022 to 2029 to reach USD 3.98 billion by 2029.
• Which region accounted for the largest global high performance foam market share?
The Asia Pacific dominated the global high performance foam market with a share of 38% in 2021.
Global High Performance Foam Market Segment Analysis
Based on type, market is segmented into silicone, polyurethane, polyamide, polyethylene. Polyurethane foam is a widely used type of high-performance foam that offers excellent cushioning and insulation properties. PU foam is used in a wide range of applications, including automotive, construction, and furniture. Polyethylene foam is another popular type of high-performance foam that offers good insulation and cushioning properties. PE foam is widely used in packaging, construction, and sports and leisure applications. Polystyrene foam is a lightweight and rigid foam that is commonly used in insulation and packaging applications. PS foam is widely used in the construction and packaging industries.
Based on end-user industry, market is segmented into construction, automotive, electrical and electronics, packaging, healthcare. Automotive and construction industry is expected to account for largest share as both of these industries use high performance foam for insulation applications. High-performance foams are widely used in the automotive industry for various applications such as seating, cushioning, and insulation. High-temperature foams stop heat from entering the vehicle as well as from departing, hence reducing the need for further energy usage. High performance foams also prevent moisture from penetrating the material, ensuring long-term corrosion protection. The growing demand for lightweight and fuel-efficient vehicles is driving the demand for high-performance foam products in the automotive industry. High-performance foams are used in the construction industry for insulation, sealing, and cushioning applications. The increasing focus on energy-efficient buildings and sustainable construction practices is driving the demand for high-performance foam products in the construction industry.
[caption id="attachment_23971" align="aligncenter" width="1920"]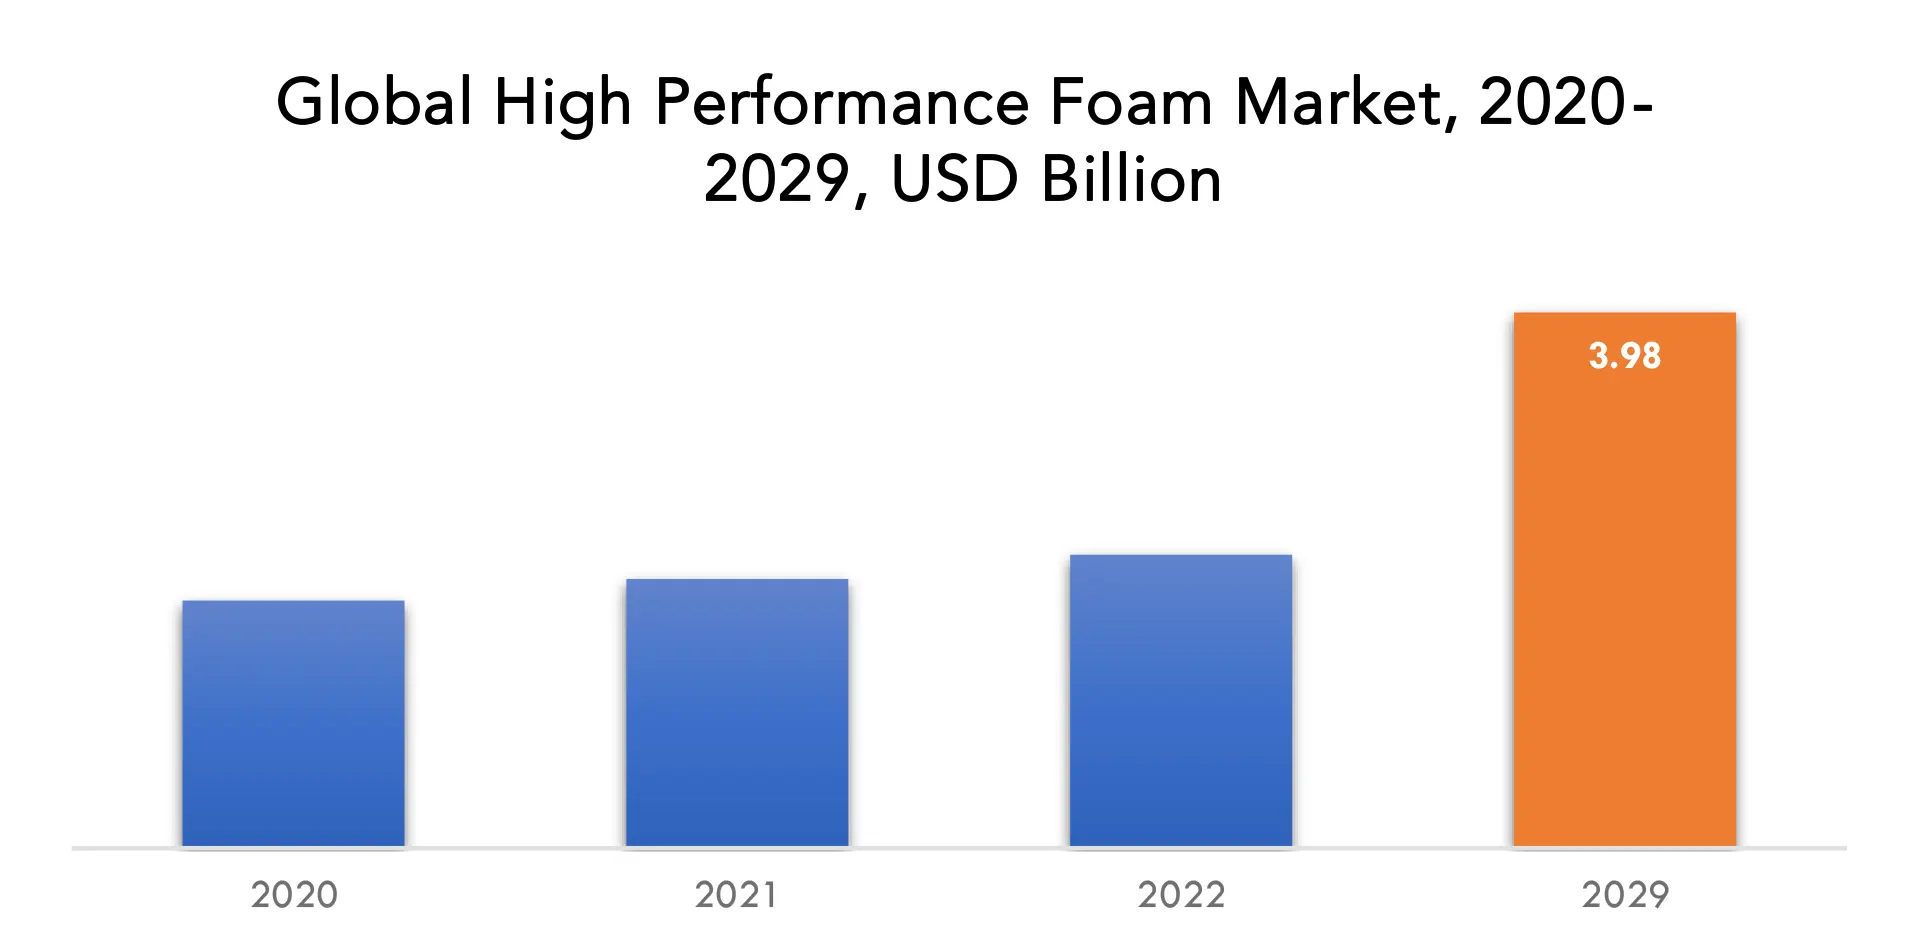
Global High Performance Foam Market Players
Key competitors from both domestic and international markets compete fiercely in the worldwide global high performance foam industry are 3M, Evonik Industries AG, Rogers Corporation, BASF SE, DuPont, Sekisui Alveo, Armacell, SABIC, Saint-Gobain, Zotefoams Plc, Solvay. Recent News:- 15th March 2023: Evonik and Chemours teamed up to provide high-performance, low GWP solutions for spray polyurethane foam industry.
- 9th November 2022: Zotefoams acquired assets and intellectual property of Refour ApS.
Who Should Buy? Or Key stakeholders
- Global High Performance Foam Manufacturers
- Raw Material Providers
- Investors
- Regulatory Authorities
- High Performance Foam Vendors
- Research and Development Organizations
- Automotive Organizations
- Construction Industry
- Others
High Performance Foam Market Regional Analysis
The global high performance foam market by region includes North America, Asia-Pacific (APAC), Europe, South America, and Middle East & Africa (MEA).
- North America: includes the US, Canada, Mexico
- Asia Pacific: includes China, Japan, South Korea, India, Australia, ASEAN and Rest of APAC
- Europe: includes UK, Germany, France, Italy, Spain, Russia, and Rest of Europe
- South America: includes Brazil, Argentina and Rest of South America
- Middle East & Africa: includes Turkey, UAE, Saudi Arabia, South Africa, and Rest of MEA
Geographically, the market is anticipated to be dominated by the Asia-Pacific region, with China leading the way in terms of GDP as the largest economy in the region. China has emerged as one of the world's largest manufacturing hubs, with its fast-growing economy and significant contributions from its manufacturing sector. India, China, and other nations are anticipated to dominate the Asia-Pacific high performance foam market. Although the market for high performance foam is now relatively small in the rest of the world, it is predicted to develop significantly over the coming years. Also, due to growing population and urbanization, automotive and construction industry is rapidly increasing in emerging countries of Asia Pacific like India and China which is creating lucrative opportunities for the high performance foam market in forecasted period.
[caption id="attachment_23980" align="aligncenter" width="1920"]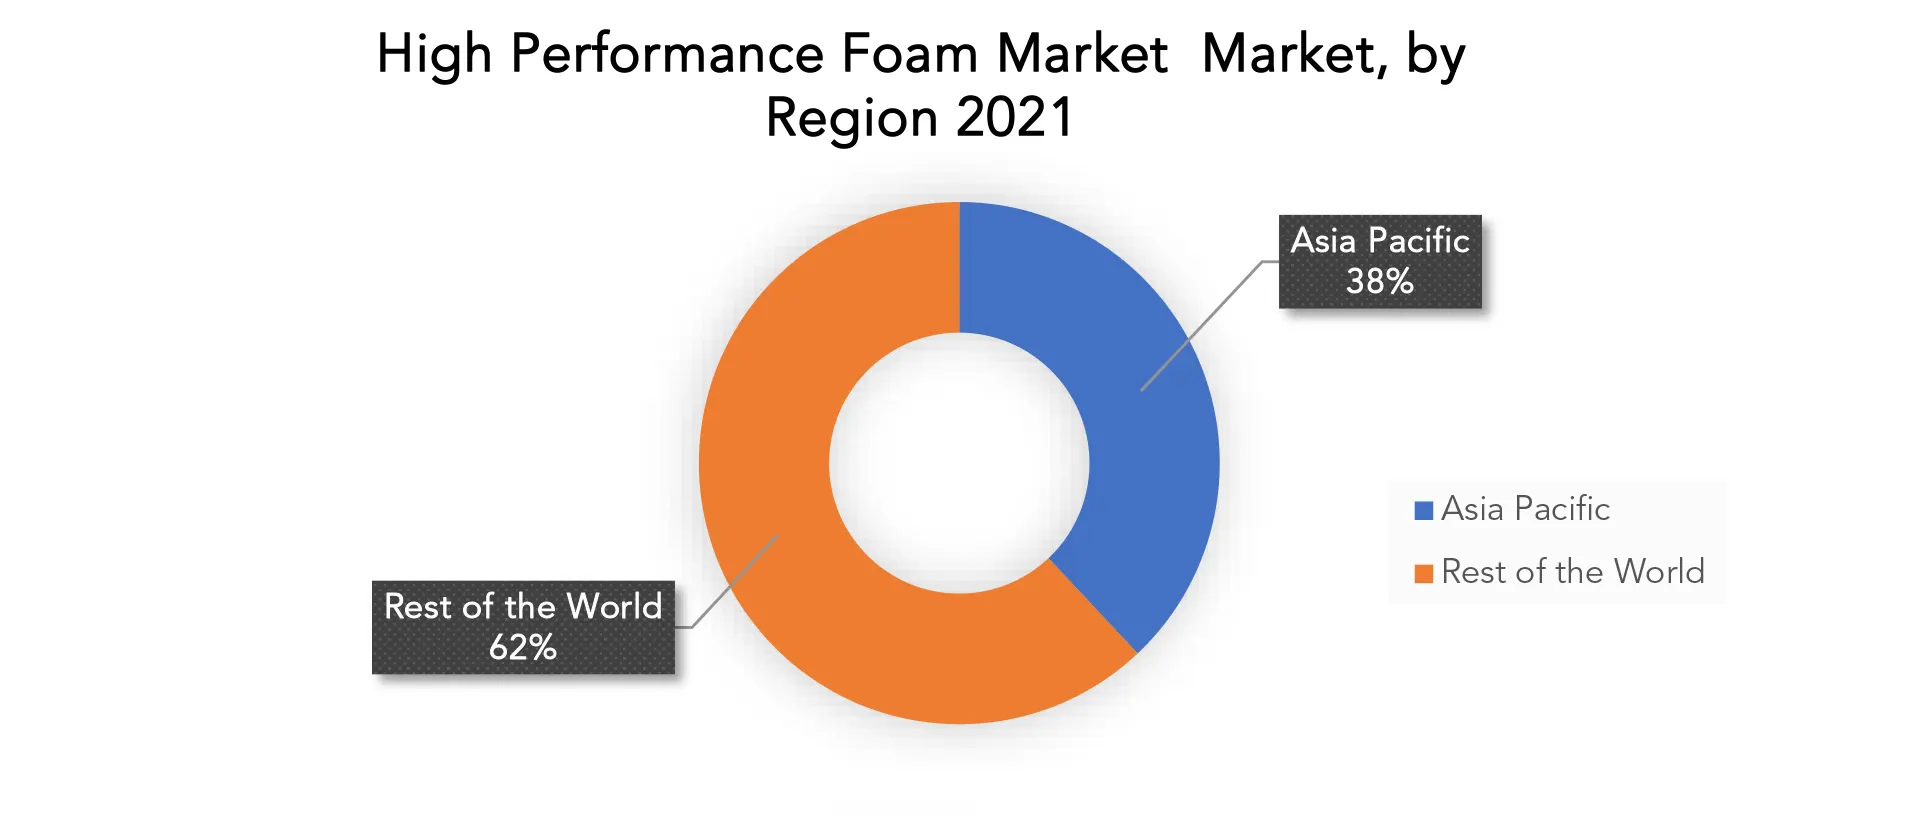
Key Market Segments: Global High Performance Foam Market
Global High Performance Foam Market By Type, 2020-2029, (USD Billion), (Kilotons)- Silicone
- Polyurethane
- Polyamide
- Polyethylene
- Construction
- Transportation
- Electrical And Electronics
- Packaging
- Healthcare
- North America
- Europe
- Asia Pacific
- South America
- Middle East And Africa
Exactitude Consultancy Services Key Objectives
- Increasing sales and market share
- Developing new technology
- Improving profitability
- Entering new markets
- Enhancing brand reputation
Key Question Answered
- What is the expected growth rate of the high performance foam market over the next 7 years?
- Who are the major players in the high performance foam market and what is their market share?
- What are the end-user industries driving demand for market and what is their outlook?
- What are the opportunities for growth in emerging markets such as Asia-Pacific, Middle East, and Africa?
- How is the economic environment affecting the high performance foam market, including factors such as interest rates, inflation, and exchange rates?
- What is the expected impact of government policies and regulations on the high performance foam market?
- What is the current and forecasted size and growth rate of the global high performance foam market?
- What are the key drivers of growth in the high performance foam market?
- What are the distribution channels and supply chain dynamics in the high performance foam market?
- What are the technological advancements and innovations in the high performance foam market and their impact on product development and growth?
- What are the regulatory considerations and their impact on the market?
- What are the challenges faced by players in the high performance foam market and how are they addressing these challenges?
- What are the opportunities for growth and expansion in the high performance foam market?
- What are the product offerings and specifications of leading players in the market?
- What is the pricing trend of high performance foam in the market and what is the impact of raw material prices on the price trend?
- INTRODUZIONE
- DEFINIZIONE DI MERCATO
- SEGMENTAZIONE DEL MERCATO
- TEMPI DI RICERCA
- ASSUNZIONI E LIMITAZIONI
- METODOLOGIA DI RICERCA
- ESTRAZIONE DATI
- RICERCA SECONDARIA
- RICERCA PRIMARIA
- PARERI DEGLI ESPERTI IN MATERIA
- CONTROLLI DI QUALITÀ
- RECENSIONE FINALE
- TRIANGOLAZIONE DEI DATI
- APPROCCIO DAL BASSO VERSO L'ALTO
- APPROCCIO TOP-DOWN
- FLUSSO DI RICERCA
- FONTI DEI DATI
- ESTRAZIONE DATI
- SINTESI
- PANORAMICA DEL MERCATO
- PROSPETTIVE DEL MERCATO GLOBALE DELLE SCHIUME AD ALTE PRESTAZIONI
- FATTORI DI MERCATO
- LIMITAZIONI DI MERCATO
- OPPORTUNITÀ DI MERCATO
- IMPATTO DEL COVID-19 SUL MERCATO GLOBALE DELLA SCHIUMA AD ALTE PRESTAZIONI
- MODELLO DELLE CINQUE FORZE DI PORTER
- MINACCIA DAI NUOVI ENTRANSI
- MINACCIA DA SOSTITUTI
- BARGAINING POWER OF SUPPLIERS
- BARGAINING POWER OF CUSTOMERS
- DEGREE OF COMPETITION
- INDUSTRY VALUE CHAIN ANALYSIS
- PROSPETTIVE DEL MERCATO GLOBALE DELLE SCHIUME AD ALTE PRESTAZIONI
- GLOBAL HIGH PERFORMANCE FOAM MARKET BY TYPE, 2020-2029, (USD BILLION), (KILOTONS)
- SILICONE
- POLYURETHANE
- POLYAMIDE
- POLYETHYLENE
- GLOBAL HIGH PERFORMANCE FOAM MARKET BY END-USER INDUSTRY, 2020-2029, (USD BILLION), (KILOTONS)
- CONSTRUCTION
- AUTOMOTIVE
- ELECTRICAL AND ELECTRONICS
- PACKAGING
- HEALTHCARE
- GLOBAL HIGH PERFORMANCE FOAM MARKET BY REGION, 2020-2029, (USD BILLION), (KILOTONS)
- NORTH AMERICA
- US
- CANADA
- MEXICO
- SOUTH AMERICA
- BRAZIL
- ARGENTINA
- COLOMBIA
- REST OF SOUTH AMERICA
- EUROPE
- GERMANY
- UK
- FRANCE
- ITALY
- SPAIN
- RUSSIA
- REST OF EUROPE
- ASIA PACIFIC
- INDIA
- CHINA
- JAPAN
- SOUTH KOREA
- AUSTRALIA
- SOUTH-EAST ASIA
- REST OF ASIA PACIFIC
- MIDDLE EAST AND AFRICA
- UAE
- SAUDI ARABIA
- SOUTH AFRICA
- REST OF MIDDLE EAST AND AFRICA
- NORTH AMERICA
- COMPANY PROFILES* (BUSINESS OVERVIEW, COMPANY SNAPSHOT, PRODUCTS OFFERED, RECENT DEVELOPMENTS)
- 3M
- EVONIK INDUSTRIES AG
- ROGERS CORPORATION
- BASF SE
- DUPONT
- SEKISUI ALVEO
- ARMACELL
- SABIC
- SAINT-GOBAIN
- ZOTEFOAMS PLC
- SOLVAY *THE COMPANY LIST IS INDICATIVE
LIST OF TABLES
TABLE 1 GLOBAL HIGH PERFORMANCE FOAM MARKET BY TYPE (USD BILLION) 2020-2029
TABLE 2 GLOBAL HIGH PERFORMANCE FOAM MARKET BY TYPE (KILOTONS) 2020-2029
TABLE 3 GLOBAL HIGH PERFORMANCE FOAM MARKET BY END-USER INDUSTRY (USD BILLION) 2020-2029
TABLE 4 GLOBAL HIGH PERFORMANCE FOAM MARKET BY END-USER INDUSTRY (KILOTONS) 2020-2029
TABLE 5 GLOBAL HIGH PERFORMANCE FOAM MARKET BY REGION (USD BILLION) 2020-2029
TABLE 6 GLOBAL HIGH PERFORMANCE FOAM MARKET BY REGION (KILOTONS) 2020-2029
TABLE 7 NORTH AMERICA HIGH PERFORMANCE FOAM MARKET BY COUNTRY (USD BILLION) 2020-2029
TABLE 8 NORTH AMERICA HIGH PERFORMANCE FOAM MARKET BY COUNTRY (KILOTONS) 2020-2029
TABLE 9 NORTH AMERICA HIGH PERFORMANCE FOAM MARKET BY TYPE (USD BILLION) 2020-2029
TABLE 10 NORTH AMERICA HIGH PERFORMANCE FOAM MARKET BY TYPE (KILOTONS) 2020-2029
TABLE 11 NORTH AMERICA HIGH PERFORMANCE FOAM MARKET BY END-USER INDUSTRY (USD BILLION) 2020-2029
TABLE 12 NORTH AMERICA HIGH PERFORMANCE FOAM MARKET BY END-USER INDUSTRY (KILOTONS) 2020-2029
TABLE 13 US HIGH PERFORMANCE FOAM MARKET BY TYPE (USD BILLION) 2020-2029
TABLE 14 US HIGH PERFORMANCE FOAM MARKET BY TYPE (KILOTONS) 2020-2029
TABLE 15 US HIGH PERFORMANCE FOAM MARKET BY END-USER INDUSTRY (USD BILLION) 2020-2029
TABLE 16 US HIGH PERFORMANCE FOAM MARKET BY END-USER INDUSTRY (KILOTONS) 2020-2029
TABLE 17 CANADA HIGH PERFORMANCE FOAM MARKET BY TYPE (USD BILLION) 2020-2029
TABLE 18 CANADA HIGH PERFORMANCE FOAM MARKET BY TYPE (KILOTONS) 2020-2029
TABLE 19 CANADA HIGH PERFORMANCE FOAM MARKET BY END-USER INDUSTRY (USD BILLION) 2020-2029
TABLE 20 CANADA HIGH PERFORMANCE FOAM MARKET BY END-USER INDUSTRY (KILOTONS) 2020-2029
TABLE 21 MEXICO HIGH PERFORMANCE FOAM MARKET BY TYPE (USD BILLION) 2020-2029
TABLE 22 MEXICO HIGH PERFORMANCE FOAM MARKET BY TYPE (KILOTONS) 2020-2029
TABLE 23 MEXICO HIGH PERFORMANCE FOAM MARKET BY END-USER INDUSTRY (USD BILLION) 2020-2029
TABLE 24 MEXICO HIGH PERFORMANCE FOAM MARKET BY END-USER INDUSTRY (KILOTONS) 2020-2029
TABLE 25 SOUTH AMERICA HIGH PERFORMANCE FOAM MARKET BY COUNTRY (USD BILLION) 2020-2029
TABLE 26 SOUTH AMERICA HIGH PERFORMANCE FOAM MARKET BY COUNTRY (KILOTONS) 2020-2029
TABLE 27 SOUTH AMERICA HIGH PERFORMANCE FOAM MARKET BY TYPE (USD BILLION) 2020-2029
TABLE 28 SOUTH AMERICA HIGH PERFORMANCE FOAM MARKET BY TYPE (KILOTONS) 2020-2029
TABLE 29 SOUTH AMERICA HIGH PERFORMANCE FOAM MARKET BY END-USER INDUSTRY (USD BILLION) 2020-2029
TABLE 30 SOUTH AMERICA HIGH PERFORMANCE FOAM MARKET BY END-USER INDUSTRY (KILOTONS) 2020-2029
TABLE 31 BRAZIL HIGH PERFORMANCE FOAM MARKET BY TYPE (USD BILLION) 2020-2029
TABLE 32 BRAZIL HIGH PERFORMANCE FOAM MARKET BY TYPE (KILOTONS) 2020-2029
TABLE 33 BRAZIL HIGH PERFORMANCE FOAM MARKET BY END-USER INDUSTRY (USD BILLION) 2020-2029
TABLE 34 BRAZIL HIGH PERFORMANCE FOAM MARKET BY END-USER INDUSTRY (KILOTONS) 2020-2029
TABLE 35 ARGENTINA HIGH PERFORMANCE FOAM MARKET BY TYPE (USD BILLION) 2020-2029
TABLE 36 ARGENTINA HIGH PERFORMANCE FOAM MARKET BY TYPE (KILOTONS) 2020-2029
TABLE 37 ARGENTINA HIGH PERFORMANCE FOAM MARKET BY END-USER INDUSTRY (USD BILLION) 2020-2029
TABLE 38 ARGENTINA HIGH PERFORMANCE FOAM MARKET BY END-USER INDUSTRY (KILOTONS) 2020-2029
TABLE 39 COLOMBIA HIGH PERFORMANCE FOAM MARKET BY TYPE (USD BILLION) 2020-2029
TABLE 40 COLOMBIA HIGH PERFORMANCE FOAM MARKET BY TYPE (KILOTONS) 2020-2029
TABLE 41 COLOMBIA HIGH PERFORMANCE FOAM MARKET BY END-USER INDUSTRY (USD BILLION) 2020-2029
TABLE 42 COLOMBIA HIGH PERFORMANCE FOAM MARKET BY END-USER INDUSTRY (KILOTONS) 2020-2029
TABLE 43 REST OF SOUTH AMERICA HIGH PERFORMANCE FOAM MARKET BY TYPE (USD BILLION) 2020-2029
TABLE 44 REST OF SOUTH AMERICA HIGH PERFORMANCE FOAM MARKET BY TYPE (KILOTONS) 2020-2029
TABLE 45 REST OF SOUTH AMERICA HIGH PERFORMANCE FOAM MARKET BY END-USER INDUSTRY (USD BILLION) 2020-2029
TABLE 46 REST OF SOUTH AMERICA HIGH PERFORMANCE FOAM MARKET BY END-USER INDUSTRY (KILOTONS) 2020-2029
TABLE 47 ASIA-PACIFIC HIGH PERFORMANCE FOAM MARKET BY COUNTRY (USD BILLION) 2020-2029
TABLE 48 ASIA-PACIFIC HIGH PERFORMANCE FOAM MARKET BY COUNTRY (KILOTONS) 2020-2029
TABLE 49 ASIA-PACIFIC HIGH PERFORMANCE FOAM MARKET BY TYPE (USD BILLION) 2020-2029
TABLE 50 ASIA-PACIFIC HIGH PERFORMANCE FOAM MARKET BY TYPE (KILOTONS) 2020-2029
TABLE 51 ASIA-PACIFIC HIGH PERFORMANCE FOAM MARKET BY END-USER INDUSTRY (USD BILLION) 2020-2029
TABLE 52 ASIA-PACIFIC HIGH PERFORMANCE FOAM MARKET BY END-USER INDUSTRY (KILOTONS) 2020-2029
TABLE 53 INDIA HIGH PERFORMANCE FOAM MARKET BY TYPE (USD BILLION) 2020-2029
TABLE 54 INDIA HIGH PERFORMANCE FOAM MARKET BY TYPE (KILOTONS) 2020-2029
TABLE 55 INDIA HIGH PERFORMANCE FOAM MARKET BY END-USER INDUSTRY (USD BILLION) 2020-2029
TABLE 56 INDIA HIGH PERFORMANCE FOAM MARKET BY END-USER INDUSTRY (KILOTONS) 2020-2029
TABLE 57 CHINA HIGH PERFORMANCE FOAM MARKET BY TYPE (USD BILLION) 2020-2029
TABLE 58 CHINA HIGH PERFORMANCE FOAM MARKET BY TYPE (KILOTONS) 2020-2029
TABLE 59 CHINA HIGH PERFORMANCE FOAM MARKET BY END-USER INDUSTRY (USD BILLION) 2020-2029
TABLE 60 CHINA HIGH PERFORMANCE FOAM MARKET BY END-USER INDUSTRY (KILOTONS) 2020-2029
TABLE 61 JAPAN HIGH PERFORMANCE FOAM MARKET BY TYPE (USD BILLION) 2020-2029
TABLE 62 JAPAN HIGH PERFORMANCE FOAM MARKET BY TYPE (KILOTONS) 2020-2029
TABLE 63 JAPAN HIGH PERFORMANCE FOAM MARKET BY END-USER INDUSTRY (USD BILLION) 2020-2029
TABLE 64 JAPAN HIGH PERFORMANCE FOAM MARKET BY END-USER INDUSTRY (KILOTONS) 2020-2029
TABLE 65 SOUTH KOREA HIGH PERFORMANCE FOAM MARKET BY TYPE (USD BILLION) 2020-2029
TABLE 66 SOUTH KOREA HIGH PERFORMANCE FOAM MARKET BY TYPE (KILOTONS) 2020-2029
TABLE 67 SOUTH KOREA HIGH PERFORMANCE FOAM MARKET BY END-USER INDUSTRY (USD BILLION) 2020-2029
TABLE 68 SOUTH KOREA HIGH PERFORMANCE FOAM MARKET BY END-USER INDUSTRY (KILOTONS) 2020-2029
TABLE 69 AUSTRALIA HIGH PERFORMANCE FOAM MARKET BY TYPE (USD BILLION) 2020-2029
TABLE 70 AUSTRALIA HIGH PERFORMANCE FOAM MARKET BY TYPE (KILOTONS) 2020-2029
TABLE 71 AUSTRALIA HIGH PERFORMANCE FOAM MARKET BY END-USER INDUSTRY (USD BILLION) 2020-2029
TABLE 72 AUSTRALIA HIGH PERFORMANCE FOAM MARKET BY END-USER INDUSTRY (KILOTONS) 2020-2029
TABLE 73 SOUTH-EAST ASIA HIGH PERFORMANCE FOAM MARKET BY TYPE (USD BILLION) 2020-2029
TABLE 74 SOUTH-EAST ASIA HIGH PERFORMANCE FOAM MARKET BY TYPE (KILOTONS) 2020-2029
TABLE 75 SOUTH-EAST ASIA HIGH PERFORMANCE FOAM MARKET BY END-USER INDUSTRY (USD BILLION) 2020-2029
TABLE 76 SOUTH-EAST ASIA HIGH PERFORMANCE FOAM MARKET BY END-USER INDUSTRY (KILOTONS) 2020-2029
TABLE 77 REST OF ASIA PACIFIC HIGH PERFORMANCE FOAM MARKET BY TYPE (USD BILLION) 2020-2029
TABLE 78 REST OF ASIA PACIFIC HIGH PERFORMANCE FOAM MARKET BY TYPE (KILOTONS) 2020-2029
TABLE 79 REST OF ASIA PACIFIC HIGH PERFORMANCE FOAM MARKET BY END-USER INDUSTRY (USD BILLION) 2020-2029
TABLE 80 REST OF ASIA PACIFIC HIGH PERFORMANCE FOAM MARKET BY END-USER INDUSTRY (KILOTONS) 2020-2029
TABLE 81 EUROPE HIGH PERFORMANCE FOAM MARKET BY COUNTRY (USD BILLION) 2020-2029
TABLE 82 EUROPE HIGH PERFORMANCE FOAM MARKET BY COUNTRY (KILOTONS) 2020-2029
TABLE 83 EUROPE HIGH PERFORMANCE FOAM MARKET BY TYPE (USD BILLION) 2020-2029
TABLE 84 EUROPE HIGH PERFORMANCE FOAM MARKET BY TYPE (KILOTONS) 2020-2029
TABLE 85 EUROPE HIGH PERFORMANCE FOAM MARKET BY END-USER INDUSTRY (USD BILLION) 2020-2029
TABLE 86 EUROPE HIGH PERFORMANCE FOAM MARKET BY END-USER INDUSTRY (KILOTONS) 2020-2029
TABLE 87 GERMANY HIGH PERFORMANCE FOAM MARKET BY TYPE (USD BILLION) 2020-2029
TABLE 88 GERMANY HIGH PERFORMANCE FOAM MARKET BY TYPE (KILOTONS) 2020-2029
TABLE 89 GERMANY HIGH PERFORMANCE FOAM MARKET BY END-USER INDUSTRY (USD BILLION) 2020-2029
TABLE 90 GERMANY HIGH PERFORMANCE FOAM MARKET BY END-USER INDUSTRY (KILOTONS) 2020-2029
TABLE 91 UK HIGH PERFORMANCE FOAM MARKET BY TYPE (USD BILLION) 2020-2029
TABLE 92 UK HIGH PERFORMANCE FOAM MARKET BY TYPE (KILOTONS) 2020-2029
TABLE 93 UK HIGH PERFORMANCE FOAM MARKET BY END-USER INDUSTRY (USD BILLION) 2020-2029
TABLE 94 UK HIGH PERFORMANCE FOAM MARKET BY END-USER INDUSTRY (KILOTONS) 2020-2029
TABLE 95 FRANCE HIGH PERFORMANCE FOAM MARKET BY TYPE (USD BILLION) 2020-2029
TABLE 96 FRANCE HIGH PERFORMANCE FOAM MARKET BY TYPE (KILOTONS) 2020-2029
TABLE 97 FRANCE HIGH PERFORMANCE FOAM MARKET BY END-USER INDUSTRY (USD BILLION) 2020-2029
TABLE 98 FRANCE HIGH PERFORMANCE FOAM MARKET BY END-USER INDUSTRY (KILOTONS) 2020-2029
TABLE 99 ITALY HIGH PERFORMANCE FOAM MARKET BY TYPE (USD BILLION) 2020-2029
TABLE 100 ITALY HIGH PERFORMANCE FOAM MARKET BY TYPE (KILOTONS) 2020-2029
TABLE 101 ITALY HIGH PERFORMANCE FOAM MARKET BY END-USER INDUSTRY (USD BILLION) 2020-2029
TABLE 102 ITALY HIGH PERFORMANCE FOAM MARKET BY END-USER INDUSTRY (KILOTONS) 2020-2029
TABLE 103 SPAIN HIGH PERFORMANCE FOAM MARKET BY TYPE (USD BILLION) 2020-2029
TABLE 104 SPAIN HIGH PERFORMANCE FOAM MARKET BY TYPE (KILOTONS) 2020-2029
TABLE 105 SPAIN HIGH PERFORMANCE FOAM MARKET BY END-USER INDUSTRY (USD BILLION) 2020-2029
TABLE 106 SPAIN HIGH PERFORMANCE FOAM MARKET BY END-USER INDUSTRY (KILOTONS) 2020-2029
TABLE 107 RUSSIA HIGH PERFORMANCE FOAM MARKET BY TYPE (USD BILLION) 2020-2029
TABLE 108 RUSSIA HIGH PERFORMANCE FOAM MARKET BY TYPE (KILOTONS) 2020-2029
TABLE 109 RUSSIA HIGH PERFORMANCE FOAM MARKET BY END-USER INDUSTRY (USD BILLION) 2020-2029
TABLE 110 RUSSIA HIGH PERFORMANCE FOAM MARKET BY END-USER INDUSTRY (KILOTONS) 2020-2029
TABLE 111 REST OF EUROPE HIGH PERFORMANCE FOAM MARKET BY TYPE (USD BILLION) 2020-2029
TABLE 112 REST OF EUROPE HIGH PERFORMANCE FOAM MARKET BY TYPE (KILOTONS) 2020-2029
TABLE 113 REST OF EUROPE HIGH PERFORMANCE FOAM MARKET BY END-USER INDUSTRY (USD BILLION) 2020-2029
TABLE 114 REST OF EUROPE HIGH PERFORMANCE FOAM MARKET BY END-USER INDUSTRY (KILOTONS) 2020-2029
TABLE 115 MIDDLE EAST AND AFRICA HIGH PERFORMANCE FOAM MARKET BY COUNTRY (USD BILLION) 2020-2029
TABLE 116 MIDDLE EAST AND AFRICA HIGH PERFORMANCE FOAM MARKET BY COUNTRY (KILOTONS) 2020-2029
TABLE 117 MIDDLE EAST AND AFRICA HIGH PERFORMANCE FOAM MARKET BY TYPE (USD BILLION) 2020-2029
TABLE 118 MIDDLE EAST AND AFRICA HIGH PERFORMANCE FOAM MARKET BY TYPE (KILOTONS) 2020-2029
TABLE 119 MIDDLE EAST AND AFRICA HIGH PERFORMANCE FOAM MARKET BY END-USER INDUSTRY (USD BILLION) 2020-2029
TABLE 120 MIDDLE EAST AND AFRICA HIGH PERFORMANCE FOAM MARKET BY END-USER INDUSTRY (KILOTONS) 2020-2029
TABLE 121 UAE HIGH PERFORMANCE FOAM MARKET BY TYPE (USD BILLION) 2020-2029
TABLE 122 UAE HIGH PERFORMANCE FOAM MARKET BY TYPE (KILOTONS) 2020-2029
TABLE 123 UAE HIGH PERFORMANCE FOAM MARKET BY END-USER INDUSTRY (USD BILLION) 2020-2029
TABLE 124 UAE HIGH PERFORMANCE FOAM MARKET BY END-USER INDUSTRY (KILOTONS) 2020-2029
TABLE 125 SAUDI ARABIA HIGH PERFORMANCE FOAM MARKET BY TYPE (USD BILLION) 2020-2029
TABLE 126 SAUDI ARABIA HIGH PERFORMANCE FOAM MARKET BY TYPE (KILOTONS) 2020-2029
TABLE 127 SAUDI ARABIA HIGH PERFORMANCE FOAM MARKET BY END-USER INDUSTRY (USD BILLION) 2020-2029
TABLE 128 SAUDI ARABIA HIGH PERFORMANCE FOAM MARKET BY END-USER INDUSTRY (KILOTONS) 2020-2029
TABLE 129 SOUTH AFRICA HIGH PERFORMANCE FOAM MARKET BY TYPE (USD BILLION) 2020-2029
TABLE 130 SOUTH AFRICA HIGH PERFORMANCE FOAM MARKET BY TYPE (KILOTONS) 2020-2029
TABLE 131 SOUTH AFRICA HIGH PERFORMANCE FOAM MARKET BY END-USER INDUSTRY (USD BILLION) 2020-2029
TABLE 132 SOUTH AFRICA HIGH PERFORMANCE FOAM MARKET BY END-USER INDUSTRY (KILOTONS) 2020-2029
TABLE 133 REST OF MIDDLE EAST AND AFRICA HIGH PERFORMANCE FOAM MARKET BY TYPE (USD BILLION) 2020-2029
TABLE 134 REST OF MIDDLE EAST AND AFRICA HIGH PERFORMANCE FOAM MARKET BY TYPE (KILOTONS) 2020-2029
TABLE 135 REST OF MIDDLE EAST AND AFRICA HIGH PERFORMANCE FOAM MARKET BY END-USER INDUSTRY (USD BILLION) 2020-2029
TABLE 136 REST OF MIDDLE EAST AND AFRICA HIGH PERFORMANCE FOAM MARKET BY END-USER INDUSTRY (KILOTONS) 2020-2029
LIST OF FIGURES
FIGURE 1 MARKET DYNAMICS
FIGURE 2 MARKET SEGMENTATION
FIGURE 3 REPORT TIMELINES: YEARS CONSIDERED
FIGURE 4 DATA TRIANGULATION
FIGURE 5 BOTTOM-UP APPROACH
FIGURE 6 TOP-DOWN APPROACH
FIGURE 7 RESEARCH FLOW
FIGURE 8 GLOBAL HIGH PERFORMANCE FOAM MARKET BY TYPE, USD BILLION, 2020-2029
FIGURE 9 GLOBAL HIGH PERFORMANCE FOAM MARKET BY END-USER INDUSTRY, USD BILLION, 2020-2029
FIGURE 10 GLOBAL HIGH PERFORMANCE FOAM MARKET BY REGION, USD BILLION, 2020-2029
FIGURE 11 PORTER’S FIVE FORCES MODEL
FIGURE 12 GLOBAL HIGH PERFORMANCE FOAM MARKET BY TYPE, USD BILLION, 2021
FIGURE 13 GLOBAL HIGH PERFORMANCE FOAM MARKET BY END-USER INDUSTRY, USD BILLION, 2021
FIGURE 14 GLOBAL HIGH PERFORMANCE FOAM MARKET BY REGION, USD BILLION, 2021
FIGURE 15 NORTH AMERICA HIGH PERFORMANCE FOAM MARKET SNAPSHOT
FIGURE 16 EUROPE HIGH PERFORMANCE FOAM MARKET SNAPSHOT
FIGURE 17 SOUTH AMERICA HIGH PERFORMANCE FOAM MARKET SNAPSHOT
FIGURE 18 ASIA PACIFIC HIGH PERFORMANCE FOAM MARKET SNAPSHOT
FIGURE 19 MIDDLE EAST ASIA AND AFRICA HIGH PERFORMANCE FOAM MARKET SNAPSHOT
FIGURE 20 MARKET SHARE ANALYSIS
FIGURE 21 3M: COMPANY SNAPSHOT
FIGURE 22 EVONIK INDUSTRIES AG: COMPANY SNAPSHOT
FIGURE 23 ROGERS CORPORATION: COMPANY SNAPSHOT
FIGURE 24 BASF SE: COMPANY SNAPSHOT
FIGURE 25 DUPONT: COMPANY SNAPSHOT
FIGURE 26 SEKISUI ALVEO: COMPANY SNAPSHOT
FIGURE 27 ARMACELL: COMPANY SNAPSHOT
FIGURE 28 SABIC: COMPANY SNAPSHOT
FIGURE 29 SAINT-GOBAIN: COMPANY SNAPSHOT
FIGURE 30 ZOTEFOAMS PLC: COMPANY SNAPSHOT
FIGURE 31 SOLVAY: COMPANY SNAPSHOT
DOWNLOAD FREE SAMPLE REPORT
License Type
SPEAK WITH OUR ANALYST
Want to know more about the report or any specific requirement?
WANT TO CUSTOMIZE THE REPORT?
Our Clients Speak
We asked them to research ‘ Equipment market’ all over the world, and their whole arrangement was helpful to us. thehealthanalytics.com insightful analysis and reports contributed to our current analysis and in creating a future strategy. Besides, the te
Yosuke Mitsui
Senior Associate Construction Equipment Sales & Marketing
We asked them to research ‘Equipment market’ all over the world, and their whole arrangement was helpful to us. thehealthanalytics.com insightful analysis and reports contributed to our current analysis and in creating a future strategy. Besides, the te


