

Base Year Value ()
x.x %
x.x %
CAGR ()
x.x %
x.x %
Forecast Year Value ()
x.x %
x.x %
Historical Data Period
Largest Region
Forecast Period
Mercato delle resine a scambio ionico per tipo (resine cationiche, resine anioniche, altre (resine assorbenti e resine chelanti)), per applicazione (acqua, non acqua), per settore dell'utente finale (energia, chimica e petrolchimica, alimenti e bevande, farmaceutica, elettrica ed elettronica, metalli e mineraria, altre (tessile, agricoltura, trattamento delle acque reflue e petrolio e gas)) e regione, tendenze globali e previsioni dal 2022 al 2029
Instant access to hundreds of data points and trends
- Market estimates from 2014-2029
- Competitive analysis, industry segmentation, financial benchmarks
- Incorporates SWOT, Porter's Five Forces and risk management frameworks
- PDF report or online database with Word, Excel and PowerPoint export options
- 100% money back guarantee
Panoramica del mercato delle resine a scambio ionico
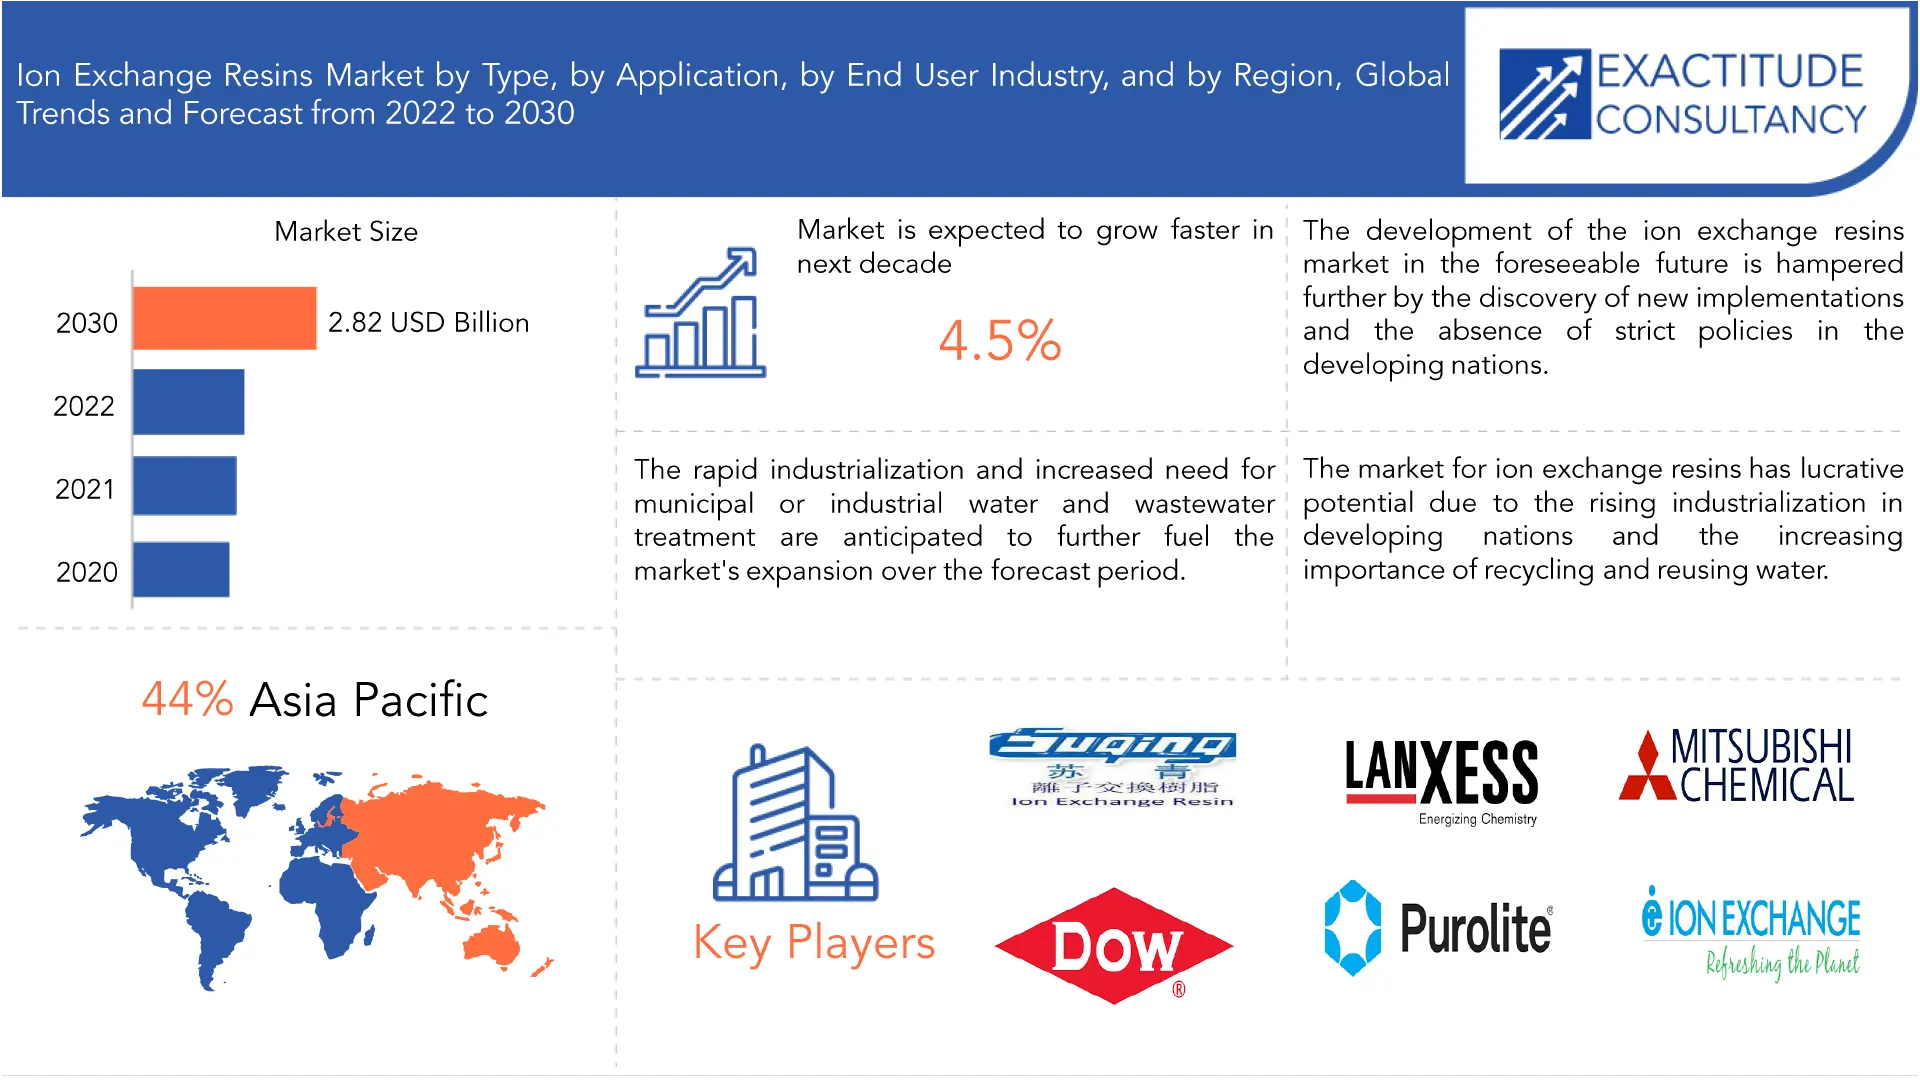
Si prevede che il mercato delle resine a scambio ionico crescerà al 4,5% di CAGR dal 2022 al 2029. Si prevede che raggiungerà oltre 2,82 miliardi di USD entro il 2029 da 1,9 miliardi di USD nel 2020.
I polimeri che agiscono come mezzo di scambio ionico sono noti come resine a scambio ionico. Sono reticolati, chimicamente inattivi e impermeabili all'acqua. Le microsfere polimeriche funzionalizzate, o resine a scambio ionico, sono spesso di colore bianco o giallo. Sono costituite da una rete intricata con numerosi vuoti o micropori. La base polimerica della resina è progettata per scambiare o raccogliere componenti da soluzioni vicine. Sono disponibili sia resine a scambio cationico acido forte che resine a scambio cationico acido debole. Le resine a scambio ionico debolmente acide con gruppi di acido carbossilico come gruppi scambiabili con gli ioni sono note come resine a scambio cationico acido debole. Il trattamento delle acque industriali spesso comporta l'uso di resine a scambio cationico acido debole.
Si prevede che la crescita del mercato delle resine a scambio ionico sarà aiutata da fattori come la crescente popolazione urbana nei paesi sviluppati, la crescente domanda di generazione di elettricità nucleare nei paesi in via di sviluppo e le rigide normative ambientali nel corso del periodo di previsione. Inoltre, si prevede che la rapida industrializzazione e la crescente necessità di trattamento delle acque e delle acque reflue municipali o industriali alimenteranno ulteriormente l'espansione del mercato delle resine a scambio ionico durante il periodo di previsione. I fattori che molto probabilmente dovrebbero ostacolare ulteriormente la crescita del mercato delle resine a scambio ionico a breve includono l'instabilità nel costo delle materie prime, la crescente concorrenza della tecnologia delle membrane a osmosi inversa e il fatto che le resine a scambio cationico non rimuovono microrganismi come i batteri dall'acqua di alimentazione.
| ATTRIBUTO | DETTAGLI |
| Periodo di studio | 2020-2029 |
| Anno base | 2021 |
| Anno stimato | 2022 |
| Anno previsto | 2022-2029 |
| Periodo storico | 2018-2020 |
| Unità | Valore (miliardi di USD) (chilotoni) |
| Segmentazione | Per tipo, per applicazione, per settore dell'utente finale, per regione |
| Per tipo |
|
| Per applicazione |
|
| Per settore dell'utente finale |
|
| Per regione |
|
Inoltre, durante il periodo previsto, il mercato delle resine a scambio ionico avrà prospettive di crescita più redditizie a causa dell'espansione dell'industrializzazione nelle nazioni in via di sviluppo e della crescente importanza del riciclo e del riutilizzo dell'acqua. Nonostante ciò, l'emergere di nuove applicazioni e la mancanza di rigide normative nelle nazioni in via di sviluppo presentano ulteriori ostacoli alla futura espansione del mercato delle resine a scambio ionico.
La pandemia ha alterato le preferenze e il comportamento dei consumatori, il che ha influenzato la domanda di beni e servizi. Ad esempio, c'è stato un aumento della domanda di sistemi di trattamento delle acque residenziali che potrebbero utilizzare resine a scambio ionico a seguito della maggiore enfasi sulla pulizia e la sanificazione personale. Tuttavia, a seconda delle variabili geografiche e dell'intensità della pandemia in vari luoghi, l'effetto complessivo sul mercato è variato. Si prevede che il mercato delle resine a scambio ionico si riprenderà gradualmente man mano che la situazione della pandemia migliora e l'attività economica riprende.
[caption id="allegato_25099" align="aligncenter" width="1920"]
Frequently Asked Questions
• What is the worth of the ion exchange resins market?
The ion exchange resins market is expected to grow at 4.5% CAGR from 2022 to 2029. It is expected to reach above USD 2.82 Billion by 2029 from USD 1.9 Billion in 2020.
• What is the size of the Asia Pacific in the ion exchange resins market?
Asia Pacific held more than 44% of the ion exchange resins market revenue share in 2021 and will witness expansion in the forecast period.
• What are some of the ion exchange resins market's driving forces?
Over the course of the forecast period, the market for ion exchange resins is anticipated to grow due to the rising demand for ultrapure pure water from the pharmaceutical and electronic industries, semiconductor, and microelectronics, which use large amounts of ultrapure water for chip rinsing, washing, and etching processes.
• Which are the top companies to hold the market share in the ion exchange resins market?
The market research report covers the analysis of market players. Key companies profiled in the report include The Dow Chemical Company, Lanxess AG, Purolite Corporation, Mitsubishi Chemical Holdings Corporation, Thermax Limited, Ion Exchange India Ltd, Samyang Holdings Corporation, Sunresin New Materials Co. Ltd, ResinTech Inc., Jiangsu Suqing Water Treatment Engineering Group Co., Ltd.
• Which is the largest regional market for ion exchange resins market?
Due to increasing demand for industrial water, municipal water, and wastewater treatment, the ion exchange resins market is predicted to rise significantly in the Asia Pacific region.
Ion Exchange Resins Market Segment Analysis
The ion exchange resins market is segmented based on type, application, end-user industry, and region.
Based on type, a significant portion of the market was made up of cationic resins. Due to they are more affordable than other kinds of ion exchange resins, cationic resins are frequently chosen. Cationic resins are more widely available and employed in a variety of sectors and applications due to their cheaper cost. Their market share has increased even more as a result of the creation of sophisticated cationic resins with enhanced performance and regeneration capacities. Manufacturers consistently spend in R&D to improve the efficacy and efficiency of cationic resins, promoting their acceptance across a variety of industries.
Based on application, a significant portion of the market was made up of water. To address the rising demand for clean water, municipalities, and water treatment plants are investing in improving their infrastructure. This includes the setting up of sophisticated water treatment systems, which heavily depend on ion exchange resins. Ion exchange resins have important applications in municipal water treatment, which includes drinking water purification and wastewater treatment, which helps to explain their expansion in the water industry. Water treatment solutions are needed for processes in industries like power generation, pharmaceuticals, chemicals, and food and beverage production. Ion exchange resins are used in a variety of industrial water treatment processes, including the purification of process water and wastewater as well as boiler feedwater. The introduction of ion exchange resins in this industry is driven by the industrial demand for water treatment solutions.
Based on the end-user industry, a significant portion of the market was made up of power. Environmental restrictions are pushing the power sector to operate in a cleaner, more sustainable manner. Technologies are being used in power plants to lessen the environmental impact of their operations, boost efficiency, and reduce emissions. Ion exchange resins support these initiatives by offering efficient water treatment options that enhance power plant efficiency while cutting down on environmental contaminants. Ion exchange resins are widely used in nuclear power sector applications for water treatment. These resins are essential for cleaning the water systems of nuclear power plants of radioactive impurities and pollutants.
[caption id="attachment_25100" align="aligncenter" width="1920"]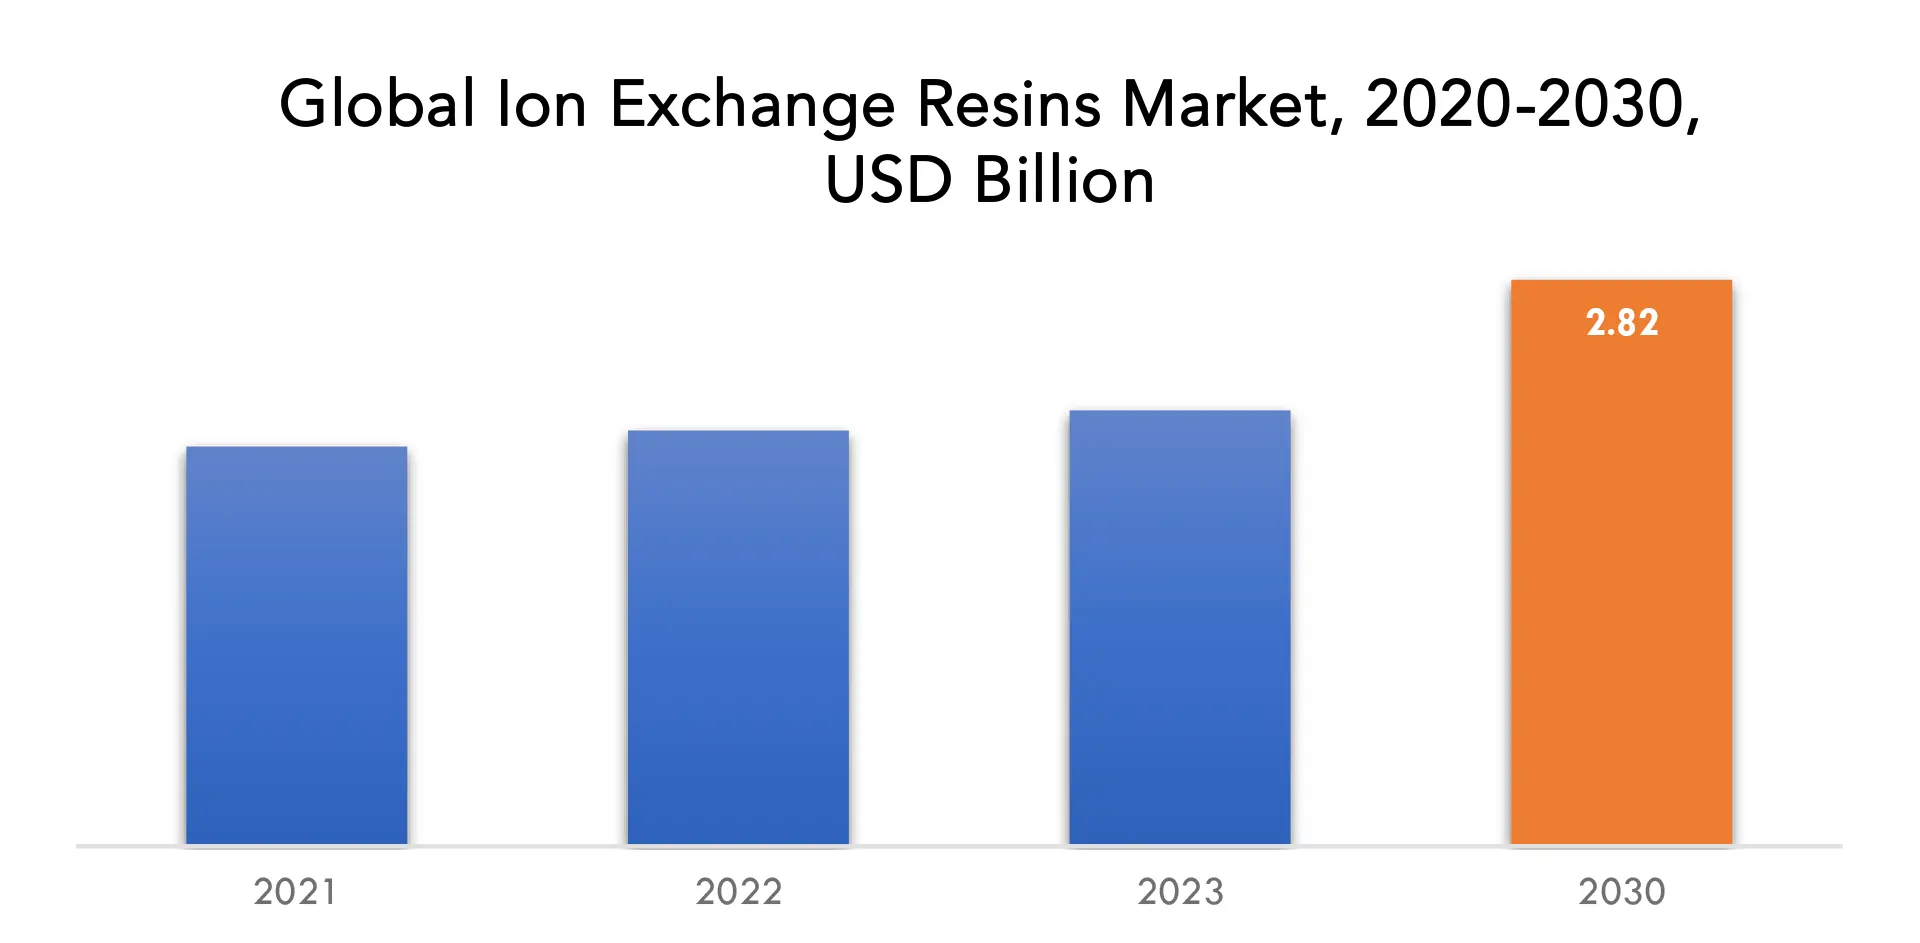
Ion Exchange Resins Market Players
The market research report covers the analysis of market players. Key companies profiled in the report include The Dow Chemical Company, Lanxess AG, Purolite Corporation, Mitsubishi Chemical Holdings Corporation, Thermax Limited, Ion Exchange India Ltd, Samyang Holdings Corporation, Sunresin New Materials Co. Ltd, ResinTech Inc., Jiangsu Suqing Water Treatment Engineering Group Co., Ltd.
Industry Development:
- On December 2022, an Ecolab company, celebrated the opening of its new pharmaceutical manufacturing facility in King of Prussia, Pa. The 74,000-square-foot plant, which included an expected 75 new jobs, was produced in exchange for resins for vital healthcare development and pharmaceutical APIs to meet the growing demand for existing and future applications and therapies.
- On December 2022, Specialty chemicals company LANXESS globally increased its basic prices for all Lewatit ion exchange resins and Bayoxide iron oxide adsorbers for water treatment applications by approximately 10%. The price increase will be valid for all orders starting January 1, 2023. Customers will be informed individually. The monthly variable surcharge introduced in the second quarter of 2022 will be retained and adjusted monthly based on key input costs.
Who Should Buy? Or Key stakeholders
- Chromatography resin Manufacturers, Distributors, and Suppliers
- End-use Markets such as Pharmaceutical & Biotechnology, Food & Beverage, and Water & Environmental Analysis
- Government and Research Organizations
- Raw Material and Equipment Suppliers
- Associations and Industry Bodies, etc.
Ion Exchange Resins Market Regional Analysis
The ion exchange resins market by region includes North America, Asia-Pacific (APAC), Europe, South America, And Middle East & Africa (MEA).
- North America: includes the US, Canada, Mexico
- Asia Pacific: includes China, Japan, South Korea, India, Australia, ASEAN, and the Rest of APAC
- Europe: includes the UK, Germany, France, Italy, Spain, Russia, and the Rest of Europe
- South America: includes Brazil, Argentina, and Rest of South America
- Middle East & Africa: includes Turkey, UAE, Saudi Arabia, South Africa, and the Rest of MEA
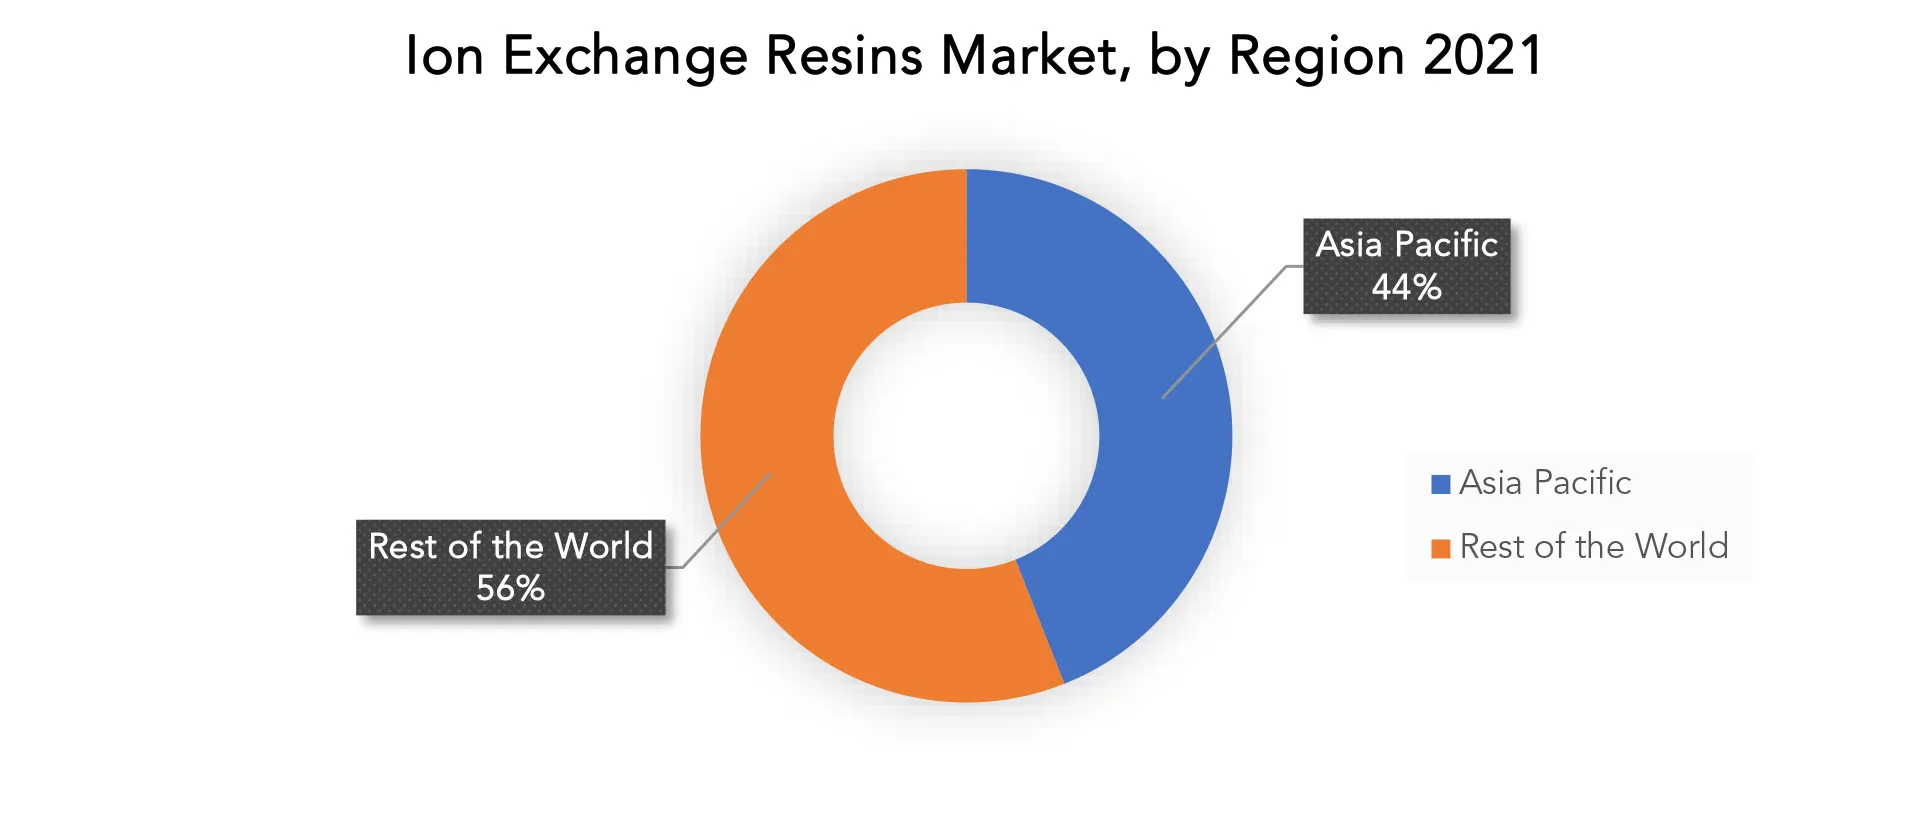
The greatest revenue share in 2021 over 44% was accounted for by Asia Pacific. Demand for ion exchange resin in the region is driven by the steadily rising production of both domestic and export uses for the material. APAC has become a significant industrial hub globally due to innovation and growth brought about by growing end-use sectors and a growing population. It is anticipated that increased innovation and industry consolidation would fuel rapid market expansion in the area. The market for ion exchange resin has significant potential for the increased demand and requirement for clean water in emerging nations like China, India, Malaysia, and Saudi Arabia.
Key Market Segments: Ion Exchange Resins Market
Ion Exchange Resins Market by Type, 2020-2029, (USD Billion), (Kilotons)
- Cationic Resins
- Anionic Resins
- Others (Adsorbent Resins & Chelation Resins)
- Water
- Non Water
- Power
- Chemical & Petrochemical
- Food & Beverage
- Pharmaceutical
- Electrical & Electronics
- Metal & Mining
- Others (Textile, Agriculture, Wastewater Treatment, and Oil & Gas)
- North America
- Asia Pacific
- Europe
- South America
- Middle East and Africa
Exactitude Consultancy Services Key Objectives
- Increasing sales and Market share
- Developing new End User Industry
- Improving profitability
- Entering new markets
- Enhancing brand reputation
Key Question Answered
- What is the expected growth rate of the ion exchange resins market over the next 7 years?
- Who are the major players in the ion exchange resins market and what is their market share?
- What are the end-use industries driving the market demand and what is their outlook?
- What are the opportunities for growth in emerging markets such as Asia-Pacific, Middle East, And Africa?
- How is the economic environment affecting the ion exchange resins market, including factors such as interest rates, inflation, and exchange rates?
- What is the expected impact of government policies and regulations on the ion exchange resins market?
- What is the current and forecasted size and growth rate of the global ion exchange resins market?
- What are the key drivers of growth in the ion exchange resins market?
- Who are the major players in the market and what is their market share?
- What are the distribution channels and supply chain dynamics in the ion exchange resins market?
- What are the technological advancements and innovations in the ion exchange resins market and their impact on price range development and growth?
- What are the regulatory considerations and their impact on the market?
- What are the challenges faced by players in the ion exchange resins market and how are they addressing these challenges?
- What are the opportunities for growth and expansion in the ion exchange resins market?
- What are the products offerings and specifications of leading players in the market?
- INTRODUZIONE
- DEFINIZIONE DI MERCATO
- SEGMENTAZIONE DEL MERCATO
- TEMPI DI RICERCA
- ASSUNZIONI E LIMITAZIONI
- METODOLOGIA DI RICERCA
- ESTRAZIONE DATI
- RICERCA SECONDARIA
- RICERCA PRIMARIA
- PARERI DEGLI ESPERTI IN MATERIA
- CONTROLLI DI QUALITÀ
- RECENSIONE FINALE
- TRIANGOLAZIONE DEI DATI
- APPROCCIO DAL BASSO VERSO L'ALTO
- APPROCCIO TOP-DOWN
- FLUSSO DI RICERCA
- FONTI DEI DATI
- ESTRAZIONE DATI
- SINTESI
- PANORAMICA DEL MERCATO
- PROSPETTIVE DEL MERCATO GLOBALE DELLE RESINE A SCAMBIO IONICO
- FATTORI DI MERCATO
- LIMITAZIONI DI MERCATO
- OPPORTUNITÀ DI MERCATO
- IMPATTO DEL COVID-19 SUL MERCATO DELLE RESINE A SCAMBIO IONICO
- MODELLO DELLE CINQUE FORZE DI PORTER
- MINACCIA DAI NUOVI ENTRANSI
- MINACCIA DA SOSTITUTI
- POTERE CONTRATTUALE DEI FORNITORI
- POTERE CONTRATTUALE DEI CLIENTI
- GRADO DI COMPETIZIONE
- ANALISI DELLA CATENA DEL VALORE DEL SETTORE
- PROSPETTIVE DEL MERCATO GLOBALE DELLE RESINE A SCAMBIO IONICO
- MERCATO GLOBALE DELLE RESINE A SCAMBIO IONICO PER TIPO, 2020-2029, (MILIARDI DI USD), (KILOTONI)
- RESINE CATIONICHE
- RESINE ANIONICHE
- ALTRI (RESINE ADSORBENTI E RESINE CHELANTI)
- MERCATO GLOBALE DELLE RESINE A SCAMBIO IONICO PER APPLICAZIONE, 2020-2029, (MILIARDI DI USD), (KILOTONI)
- ACQUA
- NON ACQUA
- MERCATO GLOBALE DELLE RESINE A SCAMBIO IONICO PER SETTORE UTENTE FINALE, 2020-2029, (MILIARDI DI USD), (KILOTONI)
- ENERGIA
- CHIMICO E PETROLCHIMICO
- CIBO E BEVANDE
- FARMACEUTICO
- ELETTRICO ED ELETTRONICO
- METALLI E MINERARIA
- ALTRI (TESSILE, AGRICOLTURA, TRATTAMENTO DELLE ACQUE REFLUE E PETROLIO E GAS)
- MERCATO GLOBALE DELLE RESINE A SCAMBIO IONICO PER REGIONE, 2020-2029, (MILIARDI DI USD), (KILOTONI)
- AMERICA DEL NORD
- NOI
- CANADA
- MESSICO
- SUD AMERICA
- BRASILE
- ARGENTINA
- COLOMBIA
- RESTO DEL SUD AMERICA
- EUROPA
- GERMANIA
- Regno Unito
- FRANCIA
- ITALIA
- SPAGNA
- RUSSIA
- RESTO D'EUROPA
- ASIA PACIFICO
- INDIA
- CINA
- GIAPPONE
- COREA DEL SUD
- AUSTRALIA
- ASIA SUD-ORIENTALE
- RESTO DELL'ASIA PACIFICO
- MEDIO ORIENTE E AFRICA
- Emirati Arabi Uniti
- ARABIA SAUDITA
- SUDAFRICA
- RESTO DEL MEDIO ORIENTE E AFRICA
- AMERICA DEL NORD
- PROFILI AZIENDALI*
(PANORAMICA DELL'ATTIVITÀ, PANORAMICA DELL'AZIENDA, PRODOTTI OFFERTI, SVILUPPI RECENTI)
- THE DOW CHEMICAL COMPANY
- LANXESS AG
- PUROLITE CORPORATION
- MITSUBISHI CHEMICAL HOLDINGS CORPORATION
- THERMAX LIMITED
- ION EXCHANGE INDIA LTD
- SAMYANG HOLDINGS CORPORATION
- SUNRESIN NEW MATERIALS CO. LTD
- RESINTECH INC.
- JIANGSU SUQING WATER TREATMENT ENGINEERING GROUP CO., LTD.
*THE COMPANY LIST IS INDICATIVE
LIST OF TABLES
TABLE 1 GLOBAL ION EXCHANGE RESINS MARKET BY TYPE (USD BILLION) 2020-2029
TABLE 2 GLOBAL ION EXCHANGE RESINS MARKET BY TYPE (KILOTONS) 2020-2029
TABLE 3 GLOBAL ION EXCHANGE RESINS MARKET BY APPLICATION (USD BILLION) 2020-2029
TABLE 4 GLOBAL ION EXCHANGE RESINS MARKET BY APPLICATION (KILOTONS) 2020-2029
TABLE 5 GLOBAL ION EXCHANGE RESINS MARKET BY END USER INDUSTRY (USD BILLION) 2020-2029
TABLE 6 GLOBAL ION EXCHANGE RESINS MARKET BY END USER INDUSTRY (KILOTONS) 2020-2029
TABLE 7 GLOBAL ION EXCHANGE RESINS MARKET BY REGION (USD BILLION) 2020-2029
TABLE 8 GLOBAL ION EXCHANGE RESINS MARKET BY REGION (KILOTONS) 2020-2029
TABLE 9 NORTH AMERICA ION EXCHANGE RESINS MARKET BY COUNTRY (USD BILLION) 2020-2029
TABLE 10 NORTH AMERICA ION EXCHANGE RESINS MARKET BY COUNTRY (KILOTONS) 2020-2029
TABLE 11 NORTH AMERICA ION EXCHANGE RESINS MARKET BY TYPE (USD BILLION) 2020-2029
TABLE 12 NORTH AMERICA ION EXCHANGE RESINS MARKET BY TYPE (KILOTONS) 2020-2029
TABLE 13 NORTH AMERICA ION EXCHANGE RESINS MARKET BY APPLICATION (USD BILLION) 2020-2029
TABLE 14 NORTH AMERICA ION EXCHANGE RESINS MARKET BY APPLICATION (KILOTONS) 2020-2029
TABLE 15 NORTH AMERICA ION EXCHANGE RESINS MARKET BY END USER INDUSTRY (USD BILLION) 2020-2029
TABLE 16 NORTH AMERICA ION EXCHANGE RESINS MARKET BY END USER INDUSTRY (KILOTONS) 2020-2029
TABLE 17 US ION EXCHANGE RESINS MARKET BY TYPE (USD BILLION) 2020-2029
TABLE 18 US ION EXCHANGE RESINS MARKET BY TYPE (KILOTONS) 2020-2029
TABLE 19 US ION EXCHANGE RESINS MARKET BY APPLICATION (USD BILLION) 2020-2029
TABLE 20 US ION EXCHANGE RESINS MARKET BY APPLICATION (KILOTONS) 2020-2029
TABLE 21 US ION EXCHANGE RESINS MARKET BY END USER INDUSTRY (USD BILLION) 2020-2029
TABLE 22 US ION EXCHANGE RESINS MARKET BY END USER INDUSTRY (KILOTONS) 2020-2029
TABLE 23 CANADA ION EXCHANGE RESINS MARKET BY TYPE (USD BILLION) 2020-2029
TABLE 24 CANADA ION EXCHANGE RESINS MARKET BY TYPE (KILOTONS) 2020-2029
TABLE 25 CANADA ION EXCHANGE RESINS MARKET BY APPLICATION (USD BILLION) 2020-2029
TABLE 26 CANADA ION EXCHANGE RESINS MARKET BY APPLICATION (KILOTONS) 2020-2029
TABLE 27 CANADA ION EXCHANGE RESINS MARKET BY END USER INDUSTRY (USD BILLION) 2020-2029
TABLE 28 CANADA ION EXCHANGE RESINS MARKET BY END USER INDUSTRY (KILOTONS) 2020-2029
TABLE 29 MEXICO ION EXCHANGE RESINS MARKET BY TYPE (USD BILLION) 2020-2029
TABLE 30 MEXICO ION EXCHANGE RESINS MARKET BY TYPE (KILOTONS) 2020-2029
TABLE 31 MEXICO ION EXCHANGE RESINS MARKET BY APPLICATION (USD BILLION) 2020-2029
TABLE 32 MEXICO ION EXCHANGE RESINS MARKET BY APPLICATION (KILOTONS) 2020-2029
TABLE 33 MEXICO ION EXCHANGE RESINS MARKET BY END USER INDUSTRY (USD BILLION) 2020-2029
TABLE 34 MEXICO ION EXCHANGE RESINS MARKET BY END USER INDUSTRY (KILOTONS) 2020-2029
TABLE 35 SOUTH AMERICA ION EXCHANGE RESINS MARKET BY COUNTRY (USD BILLION) 2020-2029
TABLE 36 SOUTH AMERICA ION EXCHANGE RESINS MARKET BY COUNTRY (KILOTONS) 2020-2029
TABLE 37 SOUTH AMERICA ION EXCHANGE RESINS MARKET BY TYPE (USD BILLION) 2020-2029
TABLE 38 SOUTH AMERICA ION EXCHANGE RESINS MARKET BY TYPE (KILOTONS) 2020-2029
TABLE 39 SOUTH AMERICA ION EXCHANGE RESINS MARKET BY APPLICATION (USD BILLION) 2020-2029
TABLE 40 SOUTH AMERICA ION EXCHANGE RESINS MARKET BY APPLICATION (KILOTONS) 2020-2029
TABLE 41 SOUTH AMERICA ION EXCHANGE RESINS MARKET BY END USER INDUSTRY (USD BILLION) 2020-2029
TABLE 42 SOUTH AMERICA ION EXCHANGE RESINS MARKET BY END USER INDUSTRY (KILOTONS) 2020-2029
TABLE 43 BRAZIL ION EXCHANGE RESINS MARKET BY TYPE (USD BILLION) 2020-2029
TABLE 44 BRAZIL ION EXCHANGE RESINS MARKET BY TYPE (KILOTONS) 2020-2029
TABLE 45 BRAZIL ION EXCHANGE RESINS MARKET BY APPLICATION (USD BILLION) 2020-2029
TABLE 46 BRAZIL ION EXCHANGE RESINS MARKET BY APPLICATION (KILOTONS) 2020-2029
TABLE 47 BRAZIL ION EXCHANGE RESINS MARKET BY END USER INDUSTRY (USD BILLION) 2020-2029
TABLE 48 BRAZIL ION EXCHANGE RESINS MARKET BY END USER INDUSTRY (KILOTONS) 2020-2029
TABLE 49 ARGENTINA ION EXCHANGE RESINS MARKET BY TYPE (USD BILLION) 2020-2029
TABLE 50 ARGENTINA ION EXCHANGE RESINS MARKET BY TYPE (KILOTONS) 2020-2029
TABLE 51 ARGENTINA ION EXCHANGE RESINS MARKET BY APPLICATION (USD BILLION) 2020-2029
TABLE 52 ARGENTINA ION EXCHANGE RESINS MARKET BY APPLICATION (KILOTONS) 2020-2029
TABLE 53 ARGENTINA ION EXCHANGE RESINS MARKET BY END USER INDUSTRY (USD BILLION) 2020-2029
TABLE 54 ARGENTINA ION EXCHANGE RESINS MARKET BY END USER INDUSTRY (KILOTONS) 2020-2029
TABLE 55 COLOMBIA ION EXCHANGE RESINS MARKET BY TYPE (USD BILLION) 2020-2029
TABLE 56 COLOMBIA ION EXCHANGE RESINS MARKET BY TYPE (KILOTONS) 2020-2029
TABLE 57 COLOMBIA ION EXCHANGE RESINS MARKET BY APPLICATION (USD BILLION) 2020-2029
TABLE 58 COLOMBIA ION EXCHANGE RESINS MARKET BY APPLICATION (KILOTONS) 2020-2029
TABLE 59 COLOMBIA ION EXCHANGE RESINS MARKET BY END USER INDUSTRY (USD BILLION) 2020-2029
TABLE 60 COLOMBIA ION EXCHANGE RESINS MARKET BY END USER INDUSTRY (KILOTONS) 2020-2029
TABLE 61 REST OF SOUTH AMERICA ION EXCHANGE RESINS MARKET BY TYPE (USD BILLION) 2020-2029
TABLE 62 REST OF SOUTH AMERICA ION EXCHANGE RESINS MARKET BY TYPE (KILOTONS) 2020-2029
TABLE 63 REST OF SOUTH AMERICA ION EXCHANGE RESINS MARKET BY APPLICATION (USD BILLION) 2020-2029
TABLE 64 REST OF SOUTH AMERICA ION EXCHANGE RESINS MARKET BY APPLICATION (KILOTONS) 2020-2029
TABLE 65 REST OF SOUTH AMERICA ION EXCHANGE RESINS MARKET BY END USER INDUSTRY (USD BILLION) 2020-2029
TABLE 66 REST OF SOUTH AMERICA ION EXCHANGE RESINS MARKET BY END USER INDUSTRY (KILOTONS) 2020-2029
TABLE 67 ASIA-PACIFIC ION EXCHANGE RESINS MARKET BY COUNTRY (USD BILLION) 2020-2029
TABLE 68 ASIA-PACIFIC ION EXCHANGE RESINS MARKET BY COUNTRY (KILOTONS) 2020-2029
TABLE 69 ASIA-PACIFIC ION EXCHANGE RESINS MARKET BY TYPE (USD BILLION) 2020-2029
TABLE 70 ASIA-PACIFIC ION EXCHANGE RESINS MARKET BY TYPE (KILOTONS) 2020-2029
TABLE 71 ASIA-PACIFIC ION EXCHANGE RESINS MARKET BY APPLICATION (USD BILLION) 2020-2029
TABLE 72 ASIA-PACIFIC ION EXCHANGE RESINS MARKET BY APPLICATION (KILOTONS) 2020-2029
TABLE 73 ASIA-PACIFIC ION EXCHANGE RESINS MARKET BY END USER INDUSTRY (USD BILLION) 2020-2029
TABLE 74 ASIA-PACIFIC ION EXCHANGE RESINS MARKET BY END USER INDUSTRY (KILOTONS) 2020-2029
TABLE 75 INDIA ION EXCHANGE RESINS MARKET BY TYPE (USD BILLION) 2020-2029
TABLE 76 INDIA ION EXCHANGE RESINS MARKET BY TYPE (KILOTONS) 2020-2029
TABLE 77 INDIA ION EXCHANGE RESINS MARKET BY APPLICATION (USD BILLION) 2020-2029
TABLE 78 INDIA ION EXCHANGE RESINS MARKET BY APPLICATION (KILOTONS) 2020-2029
TABLE 79 INDIA ION EXCHANGE RESINS MARKET BY END USER INDUSTRY (USD BILLION) 2020-2029
TABLE 80 INDIA ION EXCHANGE RESINS MARKET BY END USER INDUSTRY (KILOTONS) 2020-2029
TABLE 81 CHINA ION EXCHANGE RESINS MARKET BY TYPE (USD BILLION) 2020-2029
TABLE 82 CHINA ION EXCHANGE RESINS MARKET BY TYPE (KILOTONS) 2020-2029
TABLE 83 CHINA ION EXCHANGE RESINS MARKET BY APPLICATION (USD BILLION) 2020-2029
TABLE 84 CHINA ION EXCHANGE RESINS MARKET BY APPLICATION (KILOTONS) 2020-2029
TABLE 85 CHINA ION EXCHANGE RESINS MARKET BY END USER INDUSTRY (USD BILLION) 2020-2029
TABLE 86 CHINA ION EXCHANGE RESINS MARKET BY END USER INDUSTRY (KILOTONS) 2020-2029
TABLE 87 JAPAN ION EXCHANGE RESINS MARKET BY TYPE (USD BILLION) 2020-2029
TABLE 88 JAPAN ION EXCHANGE RESINS MARKET BY TYPE (KILOTONS) 2020-2029
TABLE 89 JAPAN ION EXCHANGE RESINS MARKET BY APPLICATION (USD BILLION) 2020-2029
TABLE 90 JAPAN ION EXCHANGE RESINS MARKET BY APPLICATION (KILOTONS) 2020-2029
TABLE 91 JAPAN ION EXCHANGE RESINS MARKET BY END USER INDUSTRY (USD BILLION) 2020-2029
TABLE 92 JAPAN ION EXCHANGE RESINS MARKET BY END USER INDUSTRY (KILOTONS) 2020-2029
TABLE 93 SOUTH KOREA ION EXCHANGE RESINS MARKET BY TYPE (USD BILLION) 2020-2029
TABLE 94 SOUTH KOREA ION EXCHANGE RESINS MARKET BY TYPE (KILOTONS) 2020-2029
TABLE 95 SOUTH KOREA ION EXCHANGE RESINS MARKET BY APPLICATION (USD BILLION) 2020-2029
TABLE 96 SOUTH KOREA ION EXCHANGE RESINS MARKET BY APPLICATION (KILOTONS) 2020-2029
TABLE 97 SOUTH KOREA ION EXCHANGE RESINS MARKET BY END USER INDUSTRY (USD BILLION) 2020-2029
TABLE 98 SOUTH KOREA ION EXCHANGE RESINS MARKET BY END USER INDUSTRY (KILOTONS) 2020-2029
TABLE 99 AUSTRALIA ION EXCHANGE RESINS MARKET BY TYPE (USD BILLION) 2020-2029
TABLE 100 AUSTRALIA ION EXCHANGE RESINS MARKET BY TYPE (KILOTONS) 2020-2029
TABLE 101 AUSTRALIA ION EXCHANGE RESINS MARKET BY APPLICATION (USD BILLION) 2020-2029
TABLE 102 AUSTRALIA ION EXCHANGE RESINS MARKET BY APPLICATION (KILOTONS) 2020-2029
TABLE 103 AUSTRALIA ION EXCHANGE RESINS MARKET BY END USER INDUSTRY (USD BILLION) 2020-2029
TABLE 104 AUSTRALIA ION EXCHANGE RESINS MARKET BY END USER INDUSTRY (KILOTONS) 2020-2029
TABLE 105 SOUTH-EAST ASIA ION EXCHANGE RESINS MARKET BY TYPE (USD BILLION) 2020-2029
TABLE 106 SOUTH-EAST ASIA ION EXCHANGE RESINS MARKET BY TYPE (KILOTONS) 2020-2029
TABLE 107 SOUTH-EAST ASIA ION EXCHANGE RESINS MARKET BY APPLICATION (USD BILLION) 2020-2029
TABLE 108 SOUTH-EAST ASIA ION EXCHANGE RESINS MARKET BY APPLICATION (KILOTONS) 2020-2029
TABLE 109 SOUTH-EAST ASIA ION EXCHANGE RESINS MARKET BY END USER INDUSTRY (USD BILLION) 2020-2029
TABLE 110 SOUTH-EAST ASIA ION EXCHANGE RESINS MARKET BY END USER INDUSTRY (KILOTONS) 2020-2029
TABLE 111 REST OF ASIA PACIFIC ION EXCHANGE RESINS MARKET BY TYPE (USD BILLION) 2020-2029
TABLE 112 REST OF ASIA PACIFIC ION EXCHANGE RESINS MARKET BY TYPE (KILOTONS) 2020-2029
TABLE 113 REST OF ASIA PACIFIC ION EXCHANGE RESINS MARKET BY APPLICATION (USD BILLION) 2020-2029
TABLE 114 REST OF ASIA PACIFIC ION EXCHANGE RESINS MARKET BY APPLICATION (KILOTONS) 2020-2029
TABLE 115 REST OF ASIA PACIFIC ION EXCHANGE RESINS MARKET BY END USER INDUSTRY (USD BILLION) 2020-2029
TABLE 116 REST OF ASIA PACIFIC ION EXCHANGE RESINS MARKET BY END USER INDUSTRY (KILOTONS) 2020-2029
TABLE 117 EUROPE ION EXCHANGE RESINS MARKET BY COUNTRY (USD BILLION) 2020-2029
TABLE 118 EUROPE ION EXCHANGE RESINS MARKET BY COUNTRY (KILOTONS) 2020-2029
TABLE 119 EUROPE ION EXCHANGE RESINS MARKET BY TYPE (USD BILLION) 2020-2029
TABLE 120 EUROPE ION EXCHANGE RESINS MARKET BY TYPE (KILOTONS) 2020-2029
TABLE 121 EUROPE ION EXCHANGE RESINS MARKET BY APPLICATION (USD BILLION) 2020-2029
TABLE 122 EUROPE ION EXCHANGE RESINS MARKET BY APPLICATION (KILOTONS) 2020-2029
TABLE 123 EUROPE ION EXCHANGE RESINS MARKET BY END USER INDUSTRY (USD BILLION) 2020-2029
TABLE 124 EUROPE ION EXCHANGE RESINS MARKET BY END USER INDUSTRY (KILOTONS) 2020-2029
TABLE 125 GERMANY ION EXCHANGE RESINS MARKET BY TYPE (USD BILLION) 2020-2029
TABLE 126 GERMANY ION EXCHANGE RESINS MARKET BY TYPE (KILOTONS) 2020-2029
TABLE 127 GERMANY ION EXCHANGE RESINS MARKET BY APPLICATION (USD BILLION) 2020-2029
TABLE 128 GERMANY ION EXCHANGE RESINS MARKET BY APPLICATION (KILOTONS) 2020-2029
TABLE 129 GERMANY ION EXCHANGE RESINS MARKET BY END USER INDUSTRY (USD BILLION) 2020-2029
TABLE 130 GERMANY ION EXCHANGE RESINS MARKET BY END USER INDUSTRY (KILOTONS) 2020-2029
TABLE 131 UK ION EXCHANGE RESINS MARKET BY TYPE (USD BILLION) 2020-2029
TABLE 132 UK ION EXCHANGE RESINS MARKET BY TYPE (KILOTONS) 2020-2029
TABLE 133 UK ION EXCHANGE RESINS MARKET BY APPLICATION (USD BILLION) 2020-2029
TABLE 134 UK ION EXCHANGE RESINS MARKET BY APPLICATION (KILOTONS) 2020-2029
TABLE 135 UK ION EXCHANGE RESINS MARKET BY END USER INDUSTRY (USD BILLION) 2020-2029
TABLE 136 UK ION EXCHANGE RESINS MARKET BY END USER INDUSTRY (KILOTONS) 2020-2029
TABLE 137 FRANCE ION EXCHANGE RESINS MARKET BY TYPE (USD BILLION) 2020-2029
TABLE 138 FRANCE ION EXCHANGE RESINS MARKET BY TYPE (KILOTONS) 2020-2029
TABLE 139 FRANCE ION EXCHANGE RESINS MARKET BY APPLICATION (USD BILLION) 2020-2029
TABLE 140 FRANCE ION EXCHANGE RESINS MARKET BY APPLICATION (KILOTONS) 2020-2029
TABLE 141 FRANCE ION EXCHANGE RESINS MARKET BY END USER INDUSTRY (USD BILLION) 2020-2029
TABLE 142 FRANCE ION EXCHANGE RESINS MARKET BY END USER INDUSTRY (KILOTONS) 2020-2029
TABLE 143 ITALY ION EXCHANGE RESINS MARKET BY TYPE (USD BILLION) 2020-2029
TABLE 144 ITALY ION EXCHANGE RESINS MARKET BY TYPE (KILOTONS) 2020-2029
TABLE 145 ITALY ION EXCHANGE RESINS MARKET BY APPLICATION (USD BILLION) 2020-2029
TABLE 146 ITALY ION EXCHANGE RESINS MARKET BY APPLICATION (KILOTONS) 2020-2029
TABLE 147 ITALY ION EXCHANGE RESINS MARKET BY END USER INDUSTRY (USD BILLION) 2020-2029
TABLE 148 ITALY ION EXCHANGE RESINS MARKET BY END USER INDUSTRY (KILOTONS) 2020-2029
TABLE 149 SPAIN ION EXCHANGE RESINS MARKET BY TYPE (USD BILLION) 2020-2029
TABLE 150 SPAIN ION EXCHANGE RESINS MARKET BY TYPE (KILOTONS) 2020-2029
TABLE 151 SPAIN ION EXCHANGE RESINS MARKET BY APPLICATION (USD BILLION) 2020-2029
TABLE 152 SPAIN ION EXCHANGE RESINS MARKET BY APPLICATION (KILOTONS) 2020-2029
TABLE 153 SPAIN ION EXCHANGE RESINS MARKET BY END USER INDUSTRY (USD BILLION) 2020-2029
TABLE 154 SPAIN ION EXCHANGE RESINS MARKET BY END USER INDUSTRY (KILOTONS) 2020-2029
TABLE 155 RUSSIA ION EXCHANGE RESINS MARKET BY TYPE (USD BILLION) 2020-2029
TABLE 156 RUSSIA ION EXCHANGE RESINS MARKET BY TYPE (KILOTONS) 2020-2029
TABLE 157 RUSSIA ION EXCHANGE RESINS MARKET BY APPLICATION (USD BILLION) 2020-2029
TABLE 158 RUSSIA ION EXCHANGE RESINS MARKET BY APPLICATION (KILOTONS) 2020-2029
TABLE 159 RUSSIA ION EXCHANGE RESINS MARKET BY END USER INDUSTRY (USD BILLION) 2020-2029
TABLE 160 RUSSIA ION EXCHANGE RESINS MARKET BY END USER INDUSTRY (KILOTONS) 2020-2029
TABLE 161 REST OF EUROPE ION EXCHANGE RESINS MARKET BY TYPE (USD BILLION) 2020-2029
TABLE 162 REST OF EUROPE ION EXCHANGE RESINS MARKET BY TYPE (KILOTONS) 2020-2029
TABLE 163 REST OF EUROPE ION EXCHANGE RESINS MARKET BY APPLICATION (USD BILLION) 2020-2029
TABLE 164 REST OF EUROPE ION EXCHANGE RESINS MARKET BY APPLICATION (KILOTONS) 2020-2029
TABLE 165 REST OF EUROPE ION EXCHANGE RESINS MARKET BY END USER INDUSTRY (USD BILLION) 2020-2029
TABLE 166 REST OF EUROPE ION EXCHANGE RESINS MARKET BY END USER INDUSTRY (KILOTONS) 2020-2029
TABLE 167 MIDDLE EAST AND AFRICA ION EXCHANGE RESINS MARKET BY COUNTRY (USD BILLION) 2020-2029
TABLE 168 MIDDLE EAST AND AFRICA ION EXCHANGE RESINS MARKET BY COUNTRY (KILOTONS) 2020-2029
TABLE 169 MIDDLE EAST AND AFRICA ION EXCHANGE RESINS MARKET BY TYPE (USD BILLION) 2020-2029
TABLE 170 MIDDLE EAST AND AFRICA ION EXCHANGE RESINS MARKET BY TYPE (KILOTONS) 2020-2029
TABLE 171 MIDDLE EAST AND AFRICA ION EXCHANGE RESINS MARKET BY APPLICATION (USD BILLION) 2020-2029
TABLE 172 MIDDLE EAST AND AFRICA ION EXCHANGE RESINS MARKET BY APPLICATION (KILOTONS) 2020-2029
TABLE 173 MIDDLE EAST AND AFRICA ION EXCHANGE RESINS MARKET BY END USER INDUSTRY (USD BILLION) 2020-2029
TABLE 174 MIDDLE EAST AND AFRICA ION EXCHANGE RESINS MARKET BY END USER INDUSTRY (KILOTONS) 2020-2029
TABLE 175 UAE ION EXCHANGE RESINS MARKET BY TYPE (USD BILLION) 2020-2029
TABLE 176 UAE ION EXCHANGE RESINS MARKET BY TYPE (KILOTONS) 2020-2029
TABLE 177 UAE ION EXCHANGE RESINS MARKET BY APPLICATION (USD BILLION) 2020-2029
TABLE 178 UAE ION EXCHANGE RESINS MARKET BY APPLICATION (KILOTONS) 2020-2029
TABLE 179 UAE ION EXCHANGE RESINS MARKET BY END USER INDUSTRY (USD BILLION) 2020-2029
TABLE 180 UAE ION EXCHANGE RESINS MARKET BY END USER INDUSTRY (KILOTONS) 2020-2029
TABLE 181 SAUDI ARABIA ION EXCHANGE RESINS MARKET BY TYPE (USD BILLION) 2020-2029
TABLE 182 SAUDI ARABIA ION EXCHANGE RESINS MARKET BY TYPE (KILOTONS) 2020-2029
TABLE 183 SAUDI ARABIA ION EXCHANGE RESINS MARKET BY APPLICATION (USD BILLION) 2020-2029
TABLE 184 SAUDI ARABIA ION EXCHANGE RESINS MARKET BY APPLICATION (KILOTONS) 2020-2029
TABLE 185 SAUDI ARABIA ION EXCHANGE RESINS MARKET BY END USER INDUSTRY (USD BILLION) 2020-2029
TABLE 186 SAUDI ARABIA ION EXCHANGE RESINS MARKET BY END USER INDUSTRY (KILOTONS) 2020-2029
TABLE 187 SOUTH AFRICA ION EXCHANGE RESINS MARKET BY TYPE (USD BILLION) 2020-2029
TABLE 188 SOUTH AFRICA ION EXCHANGE RESINS MARKET BY TYPE (KILOTONS) 2020-2029
TABLE 189 SOUTH AFRICA ION EXCHANGE RESINS MARKET BY APPLICATION (USD BILLION) 2020-2029
TABLE 190 SOUTH AFRICA ION EXCHANGE RESINS MARKET BY APPLICATION (KILOTONS) 2020-2029
TABLE 191 SOUTH AFRICA ION EXCHANGE RESINS MARKET BY END USER INDUSTRY (USD BILLION) 2020-2029
TABLE 192 SOUTH AFRICA ION EXCHANGE RESINS MARKET BY END USER INDUSTRY (KILOTONS) 2020-2029
TABLE 193 REST OF MIDDLE EAST AND AFRICA ION EXCHANGE RESINS MARKET BY TYPE (USD BILLION) 2020-2029
TABLE 194 REST OF MIDDLE EAST AND AFRICA ION EXCHANGE RESINS MARKET BY TYPE (KILOTONS) 2020-2029
TABLE 195 REST OF MIDDLE EAST AND AFRICA ION EXCHANGE RESINS MARKET BY APPLICATION (USD BILLION) 2020-2029
TABLE 196 REST OF MIDDLE EAST AND AFRICA ION EXCHANGE RESINS MARKET BY APPLICATION (KILOTONS) 2020-2029
TABLE 197 REST OF MIDDLE EAST AND AFRICA ION EXCHANGE RESINS MARKET BY END USER INDUSTRY (USD BILLION) 2020-2029
TABLE 198 REST OF MIDDLE EAST AND AFRICA ION EXCHANGE RESINS MARKET BY END USER INDUSTRY (KILOTONS) 2020-2029
LIST OF FIGURES
FIGURE 1 MARKET DYNAMICS
FIGURE 2 MARKET SEGMENTATION
FIGURE 3 REPORT TIMELINES: YEARS CONSIDERED
FIGURE 4 DATA TRIANGULATION
FIGURE 5 BOTTOM-UP APPROACH
FIGURE 6 TOP-DOWN APPROACH
FIGURE 7 RESEARCH FLOW
FIGURE 8 GLOBAL ION EXCHANGE RESINS MARKET BY TYPE, USD BILLION, 2020-2029
FIGURE 9 GLOBAL ION EXCHANGE RESINS MARKET BY APPLICATION, USD BILLION, 2020-2029
FIGURE 10 GLOBAL ION EXCHANGE RESINS MARKET BY END USER INDUSTRY, USD BILLION, 2020-2029
FIGURE 11 GLOBAL ION EXCHANGE RESINS MARKET BY REGION, USD BILLION, 2020-2029
FIGURE 12 PORTER’S FIVE FORCES MODEL
FIGURE 13 GLOBAL ION EXCHANGE RESINS MARKET BY TYPE, USD BILLION, 2021
FIGURE 14 GLOBAL ION EXCHANGE RESINS MARKET BY APPLICATION, USD BILLION, 2021
FIGURE 15 GLOBAL ION EXCHANGE RESINS MARKET BY END USER INDUSTRY, USD BILLION, 2021
FIGURE 16 GLOBAL ION EXCHANGE RESINS MARKET BY REGION, USD BILLION, 2021
FIGURE 17 NORTH AMERICA ION EXCHANGE RESINS MARKET SNAPSHOT
FIGURE 18 EUROPE ION EXCHANGE RESINS MARKETSNAPSHOT
FIGURE 19 SOUTH AMERICA ION EXCHANGE RESINS MARKET SNAPSHOT
FIGURE 20 ASIA PACIFIC ION EXCHANGE RESINS MARKET SNAPSHOT
FIGURE 21 MIDDLE EAST ASIA AND AFRICA ION EXCHANGE RESINS MARKET SNAPSHOT
FIGURE 22 MARKET SHARE ANALYSIS
FIGURE 23 THE DOW CHEMICAL COMPANY: COMPANY SNAPSHOT
FIGURE 24 LANXESS AG: COMPANY SNAPSHOT
FIGURE 25 PUROLITE CORPORATION: COMPANY SNAPSHOT
FIGURE 26 MITSUBISHI CHEMICAL HOLDINGS CORPORATION: COMPANY SNAPSHOT
FIGURE 27 THERMAX LIMITED: COMPANY SNAPSHOT
FIGURE 28 ION EXCHANGE INDIA LTD: COMPANY SNAPSHOT
FIGURE 29 SAMYANG HOLDINGS CORPORATION: COMPANY SNAPSHOT
FIGURE 30 SUNRESIN NEW MATERIALS CO. LTD: COMPANY SNAPSHOT
FIGURE 31 RESINTECH INC.: COMPANY SNAPSHOT
FIGURE 32 JIANGSU SUQING WATER TREATMENT ENGINEERING GROUP CO., LTD.: COMPANY SNAPSHOT
DOWNLOAD FREE SAMPLE REPORT
License Type
SPEAK WITH OUR ANALYST
Want to know more about the report or any specific requirement?
WANT TO CUSTOMIZE THE REPORT?
Our Clients Speak
We asked them to research ‘ Equipment market’ all over the world, and their whole arrangement was helpful to us. thehealthanalytics.com insightful analysis and reports contributed to our current analysis and in creating a future strategy. Besides, the te
Yosuke Mitsui
Senior Associate Construction Equipment Sales & Marketing
We asked them to research ‘Equipment market’ all over the world, and their whole arrangement was helpful to us. thehealthanalytics.com insightful analysis and reports contributed to our current analysis and in creating a future strategy. Besides, the te


