

Base Year Value ()
x.x %
x.x %
CAGR ()
x.x %
x.x %
Forecast Year Value ()
x.x %
x.x %
Historical Data Period
Largest Region
Forecast Period
Mercato dei plastificanti non ftalici per tipo (benzoati, adipati, trimellitati, epossidici, altri), applicazione (fili e cavi, pellicole e fogli, pavimenti e rivestimenti murali, beni di consumo, tessuti rivestiti, altri), uso finale (edilizia e costruzioni, sport e tempo libero, sanità, alimenti e bevande (F&B), elettricità ed elettronica, altri) e regione, tendenze globali e previsioni dal 2022 al 2029
Instant access to hundreds of data points and trends
- Market estimates from 2014-2029
- Competitive analysis, industry segmentation, financial benchmarks
- Incorporates SWOT, Porter's Five Forces and risk management frameworks
- PDF report or online database with Word, Excel and PowerPoint export options
- 100% money back guarantee
Panoramica del mercato dei plastificanti non ftalati
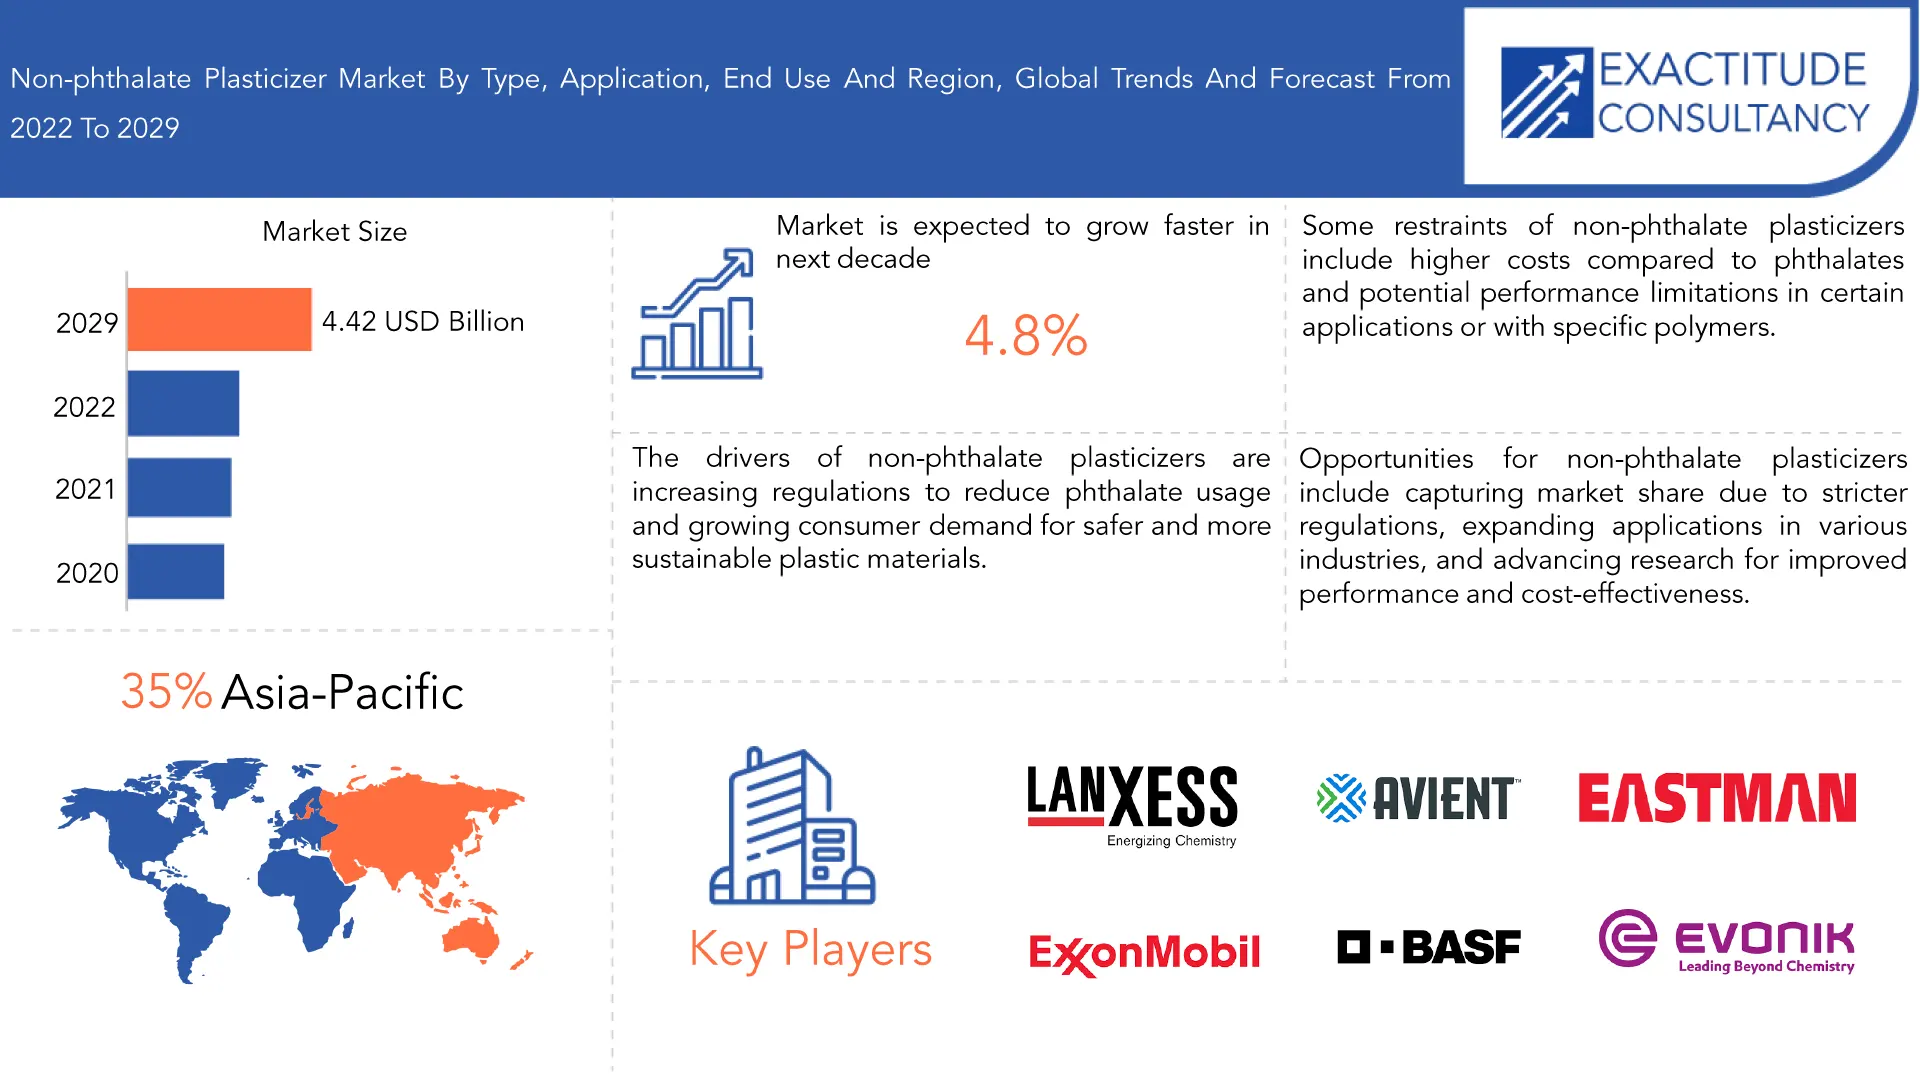
Si prevede che il mercato dei plastificanti non ftalici crescerà al 4,8% di CAGR dal 2022 al 2029. Si prevede che raggiungerà oltre 4,42 miliardi di USD entro il 2029 dai 2,9 miliardi di USD del 2021.
Una classe di sostanze chimiche note come plastificanti non ftalici viene utilizzata in una varietà di settori per aumentare la flessibilità e la tenacità dei materiali plastici. Le alternative non ftaliche offrono alternative più sicure e più rispettose dell'ambiente ai plastificanti ftalici convenzionali, che sono stati collegati a problemi di salute e ambientali. Adipati, benzoati, citrati e trimellitati sono solo alcune delle diverse sostanze chimiche che compongono i plastificanti non ftalici . Queste sostanze sono state scelte con cura per la loro capacità di aumentare la morbidezza, l'elasticità e la lavorabilità delle plastiche, presentando al contempo rischi minimi per la salute umana o l'ambiente. Il profilo di tossicità inferiore dei plastificanti non ftalici è uno dei loro principali vantaggi. Hanno una minore probabilità di fuoriuscire dai prodotti in plastica e contaminare cibo, acqua o l'atmosfera. In applicazioni come imballaggi alimentari, dispositivi medici e giocattoli per bambini, la sicurezza del consumatore è fondamentale, rendendo questa caratteristica cruciale. Inoltre, grazie alla loro ecocompatibilità, i plastificanti non ftalati stanno guadagnando popolarità. Rispetto ai ftalati, hanno una migliore biodegradabilità e una minore persistenza nell'ambiente, il che riduce il loro impatto ecologico a lungo termine. I plastificanti non ftalati presentano una serie di vantaggi rispetto ai ftalati, tra cui maggiori prestazioni del prodotto, maggiore sostenibilità e minori rischi per la salute umana e l'ambiente. Ora sono ampiamente utilizzati in molti settori diversi, il che ha stimolato l'innovazione e portato alla creazione di materiali plastici più sicuri. [caption id="attachment_25576" align="alignnone" width="1920"]
| ATTRIBUTO | DETTAGLI |
| Periodo di studio | 2020-2029 |
| Anno base | 2021 |
| Anno stimato | 2022 |
| Anno previsto | 2022-2029 |
| Periodo storico | 2018-2020 |
| Unità | Valore (miliardi di USD), Volume (chilotoni) |
| Segmentazione | Per tipo, per applicazione, per utilizzo finale, per regione |
| Per tipo |
|
| Per applicazione |
|
| Per uso finale |
|
| Per regione |
|
Frequently Asked Questions
• What is the projected market size & growth rate of the non-phthalate plasticizer market?
Non-phthalate plasticizer market was valued at USD 3.19 billion in 2022 and is projected to reach USD 4.42 billion by 2029, growing at a CAGR of 4.8% from 2022 to 2029.
• What are the factors driving the non-phthalate plasticizer market?
Rise in demand for non-phthalate plasticizers owing to stringent regulations, high demand for PVC products from various end-use industries, rapid growth of construction industry, and emergence of bio-based plasticizers are some of the key factors driving growth of the global non-phthalate plasticizer market.
• What are the top players operating in the non-phthalate plasticizer market?
The major players of non-phthalate plasticizer market include BASF SE, Evonik, Exxon Mobil Corporation, LANXESS, Avient Corporation, Eastman Chemical Company, KLJ Group, Mitsubishi Chemical Corporation, NAN YA PLASTICS CORPORATION, DIC CORPORATION.
• What segments are covered in the non-phthalate plasticizer market report?
The global non-phthalate plasticizer market is segmented on the basis of type, application, end use and geography.
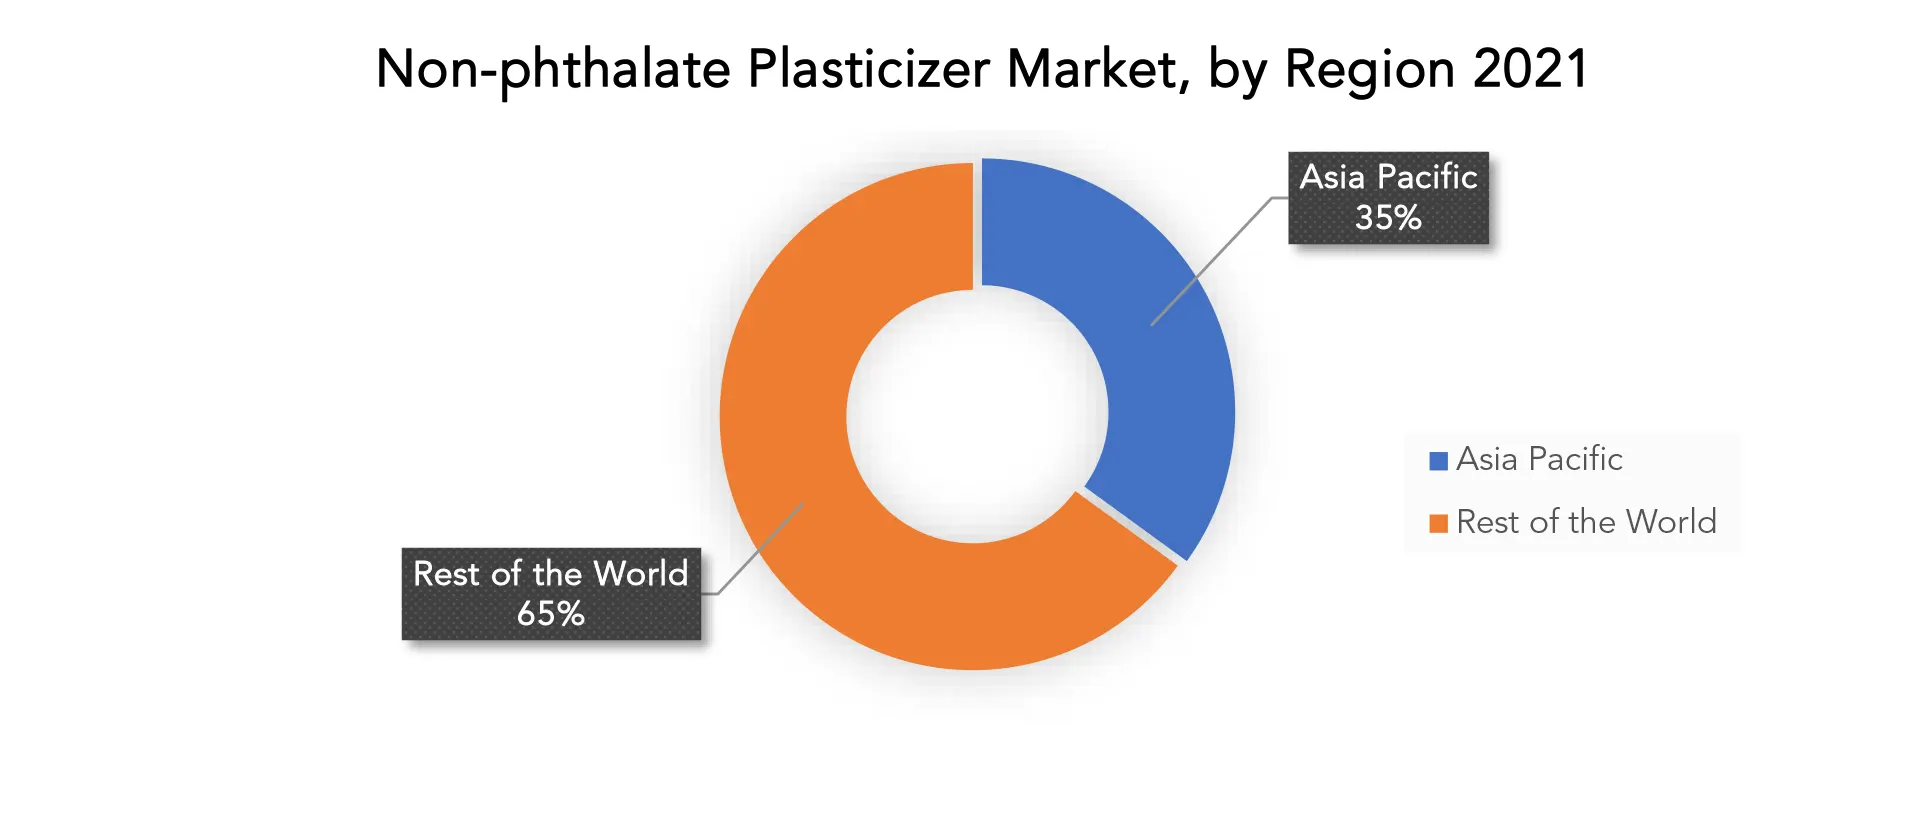
• Which region held the largest share of non-phthalate plasticizer market in 2021?
Asia-Pacific held the largest share of non-phthalate plasticizer market in 2021.
• What are some restraints for growth of the global non-phthalate plasticizer market?
High cost of non-phthalate plasticizers and fluctuating prices of raw materials are some of the major restraints for growth of the global non-phthalate plasticizer market.
Non-phthalate Plasticizer Market Segment Analysis
The non-phthalate plasticizer market is segmented based on type, application, End Use and region. By type market is segmented into benzoates, adipates, trimellitates, epoxies, and others. By application market is segmented into wires & cables, films & sheets, flooring & wall coverings, consumer goods, coated fabrics, and others. By End Use market is segmented into building & construction, sports & leisure, healthcare, food & beverages, electrical & electronics, and others. The non-phthalate plasticizer type trimellitates is the fastest-growing due to its high-temperature performance characteristics, while the adipates segment held the largest share of the market in 2021 and is anticipated to maintain its dominance during the forecast period. This market is expanding as adipates, a light-colored, oily liquid, is used to plasticize PVC. In 2021, the flooring and wall coverings segment had a significantly higher revenue share. Due to the implementation of strict regulations for the use of commonly used phthalate plasticizers, substitutes like bis(2-ethylhexyl) adipate (DEHA), bis(2-ethylhexyl) terephthalate (DEHT), and tributyl O-acetylcitrate (ATBC) are being used more frequently. One of the main factors influencing demand for flooring and wall coverings by the construction and real estate industries is the non-toxicity levels of such plasticizer. Public officials and consumers are under increasing pressure to switch to phthalate-free alternatives as awareness of the toxicity of some phthalates grows. Over the forecast period, the building and construction segment is anticipated to post a significantly rapid rate of revenue growth. Due to rising disposable income and increased government involvement in infrastructure development worldwide, the construction industry is expanding quickly. Such elements are fueling the building and construction industry's demand for raw materials. PVC is a material that is widely used in the construction industry. Benefits like its resistance to UV radiation and temperature can be credited for the product's rising popularity in the construction industry. [caption id="attachment_25595" align="aligncenter" width="1920"]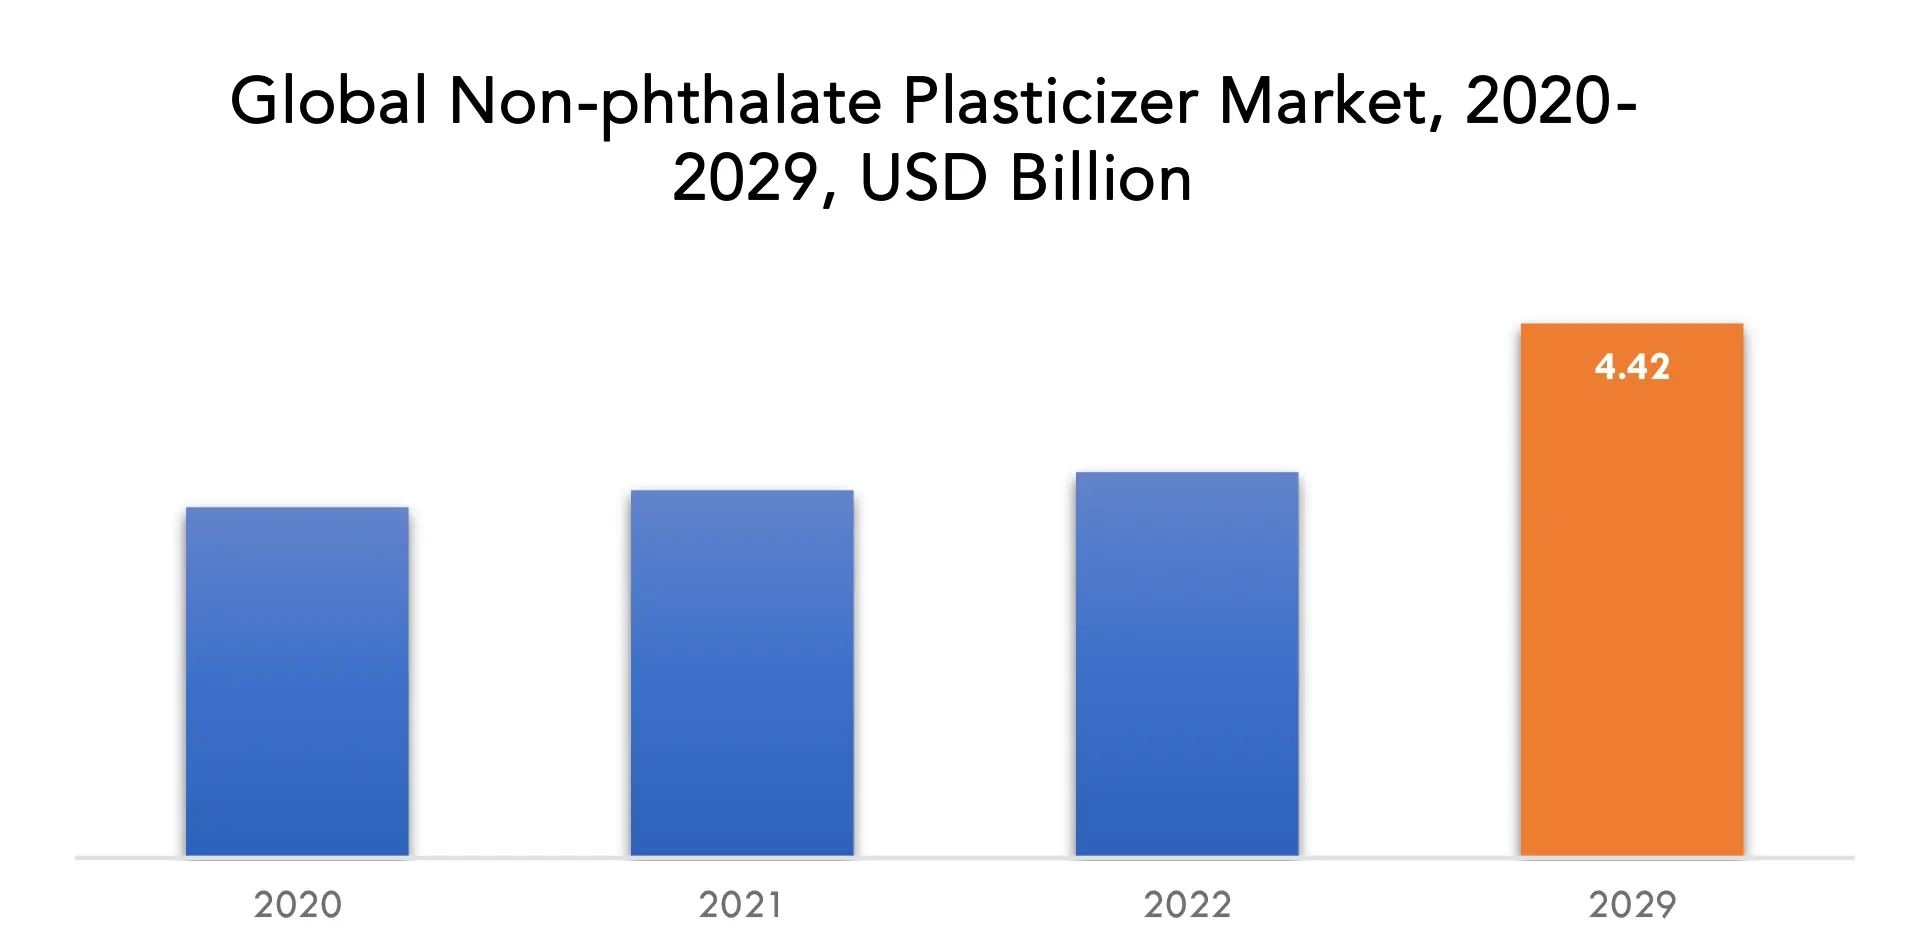
Non-phthalate Plasticizer Market Players
The non-phthalate plasticizer market key players BASF SE, Evonik, Exxon Mobil Corporation, LANXESS, Avient Corporation, Eastman Chemical Company, KLJ Group, Mitsubishi Chemical Corporation, NAN YA PLASTICS CORPORATION, DIC CORPORATION, and others. Recent Developments: 22 May 2023: BASF’s Coatings division launched a crowdsourcing digital tool to streamline and enhance color formula search for customers of its two paint brands, NORBIN and Shancai. 22 March 2023: BASF introduced a new Ultramid Deep Gloss grade, optimized for highly glossy automotive interior parts, and applied for the first time to the garnish of Toyota‘s new Prius.Who Should Buy? Or Key stakeholders
- Manufacturers
- Chemical Industry
- End users companies
- Government organizations
- Research organizations
- Investment research firms
- Others
Non-phthalate Plasticizer Market Regional Analysis
The non-phthalate plasticizer market by region includes North America, Asia-Pacific (APAC), Europe, South America, and Middle East & Africa (MEA).- North America: includes the US, Canada, Mexico, Rest of North America
- Asia Pacific: includes China, Japan, South Korea, India, Australia, and Rest of APAC
- Europe: includes UK, Germany, France, Italy, Russia, Spain, and Rest of Europe
- South America: includes Brazil, Argentina, Colombia and Rest of South America
- Middle East & Africa: includes UAE, Saudi Arabia, South Africa, and Rest of MEA
Key Market Segments: Non-phthalate Plasticizer Market
Non-phthalate Plasticizer Market by type, 2020-2029, (USD Billion, Kilotons)- Benzoates
- Adipates
- Trimellitates
- Epoxies
- Others
- Wires & cables
- Films & sheets
- Flooring & wall coverings
- Consumer goods
- Coated fabrics
- Others
- Building & construction
- Sports & leisure
- Healthcare
- Food & Beverages (F&B)
- Electrical & electronics
- Others
- North America
- Asia Pacific
- Europe
- South America
- Middle East and Africa
- Increasing sales and market share
- Developing new technology
- Improving profitability
- Entering new markets
- Enhancing brand reputation
Key Question Answered
- What is the expected growth rate of the non-phthalate plasticizer market over the next 7 years?
- What are the end user industries driving demand for market and what is their outlook?
- What are the opportunities for growth in emerging markets such as asia-pacific, middle east, and Africa?
- How is the economic environment affecting the non-phthalate plasticizer market, including factors such as interest rates, inflation, and exchange rates?
- What is the expected impact of government policies and regulations on the non-phthalate plasticizer market?
- What is the current and forecasted size and growth rate of the global non-phthalate plasticizer market?
- What are the key drivers of growth in the non-phthalate plasticizer market?
- Who are the major players in the market and what is their market share?
- What are the distribution channels and supply chain dynamics in the non-phthalate plasticizer market?
- What are the technological advancements and innovations in the non-phthalate plasticizer market and their impact on product development and growth?
- What are the regulatory considerations and their impact on the market?
- What are the challenges faced by players in the non-phthalate plasticizer market and how are they addressing these challenges?
- What are the opportunities for growth and expansion in the non-phthalate plasticizer market?
- What are the service offerings and specifications of leading players in the market?
- What is the pricing trend of non-phthalate plasticizers in the market and what is the impact of raw material prices on the price trend?
- INTRODUCTION
- MARKET DEFINITION
- MARKET SEGMENTATION
- RESEARCH TIMELINES
- ASSUMPTIONS AND LIMITATIONS
- RESEARCH METHODOLOGY
- DATA MINING
- SECONDARY RESEARCH
- PRIMARY RESEARCH
- SUBJECT-MATTER EXPERTS’ ADVICE
- QUALITY CHECKS
- FINAL REVIEW
- DATA TRIANGULATION
- BOTTOM-UP APPROACH
- TOP-DOWN APPROACH
- RESEARCH FLOW
- DATA SOURCES
- DATA MINING
- EXECUTIVE SUMMARY
- MARKET OVERVIEW
- GLOBAL NON-PHTHALATE PLASTICIZER MARKET OUTLOOK
- MARKET DRIVERS
- MARKET RESTRAINTS
- MARKET OPPORTUNITIES
- IMPACT OF COVID-19 ON NON-PHTHALATE PLASTICIZER MARKET
- PORTER’S FIVE FORCES MODEL
- THREAT FROM NEW ENTRANTS
- THREAT FROM SUBSTITUTES
- BARGAINING POWER OF SUPPLIERS
- BARGAINING POWER OF CUSTOMERS
- DEGREE OF COMPETITION
- INDUSTRY VALUE CHAIN ANALYSIS
- GLOBAL NON-PHTHALATE PLASTICIZER MARKET OUTLOOK
- GLOBAL NON-PHTHALATE PLASTICIZER MARKET BY TYPE (USD BILLION, KILOTONS), 2020-2029
- BENZOATES
- ADIPATES
- TRIMELLITATES
- EPOXIES
- OTHERS
- GLOBAL NON-PHTHALATE PLASTICIZER MARKET BY APPLICATION (USD BILLION, KILOTONS),2020-2029
- WIRES & CABLES
- FILMS & SHEETS
- FLOORING & WALL COVERINGS
- CONSUMER GOODS
- COATED FABRICS
- OTHERS
- GLOBAL NON-PHTHALATE PLASTICIZER MARKET BY END USE (USD BILLION, KILOTONS),2020-2029
- WIRES & CABLES
- FILMS & SHEETS
- FLOORING & WALL COVERINGS
- CONSUMER GOODS
- COATED FABRICS
- OTHERS
- GLOBAL NON-PHTHALATE PLASTICIZER MARKET BY REGION (USD BILLION, KILOTONS),2020-2029
- NORTH AMERICA
- US
- CANADA
- MEXICO
- REST OF NORTH AMERICA
- SOUTH AMERICA
- BRAZIL
- ARGENTINA
- COLOMBIA
- REST OF SOUTH AMERICA
- EUROPE
- GERMANY
- UK
- FRANCE
- ITALY
- SPAIN
- RUSSIA
- REST OF EUROPE
- ASIA PACIFIC
- INDIA
- CHINA
- JAPAN
- SOUTH KOREA
- AUSTRALIA
- REST OF ASIA PACIFIC
- MIDDLE EAST AND AFRICA
- UAE
- SAUDI ARABIA
- SOUTH AFRICA
- REST OF MIDDLE EAST AND AFRICA
- NORTH AMERICA
- COMPANY PROFILES* (BUSINESS OVERVIEW, COMPANY SNAPSHOT, PRODUCTS OFFERED, RECENT DEVELOPMENTS)
- BASF SE
- EVONIK
- EXXON MOBIL CORPORATION
- LANXESS
- AVIENT CORPORATION
- EASTMAN CHEMICAL COMPANY
- KLJ GROUP
- MITSUBISHI CHEMICAL CORPORATION
- NAN YA PLASTICS CORPORATION
- DIC CORPORATION *THE COMPANY LIST IS INDICATIVE
LIST OF TABLES
TABLE 1 GLOBAL NON-PHTHALATE PLASTICIZER MARKET BY TYPE (USD BILLION), 2020-2029
TABLE 2 GLOBAL NON-PHTHALATE PLASTICIZER MARKET BY TYPE (KILOTONS), 2020-2029
TABLE 3 GLOBAL NON-PHTHALATE PLASTICIZER MARKET BY APPLICATION (USD BILLION), 2020-2029
TABLE 4 GLOBAL NON-PHTHALATE PLASTICIZER MARKET BY APPLICATION (KILOTONS), 2020-2029
TABLE 5 GLOBAL NON-PHTHALATE PLASTICIZER MARKET BY END USE (USD BILLION), 2020-2029
TABLE 6 GLOBAL NON-PHTHALATE PLASTICIZER MARKET BY END USE (KILOTONS), 2020-2029
TABLE 7 GLOBAL NON-PHTHALATE PLASTICIZER MARKET BY REGION (USD BILLION), 2020-2029
TABLE 8 GLOBAL NON-PHTHALATE PLASTICIZER MARKET BY REGION (KILOTONS), 2020-2029
TABLE 9 NORTH AMERICA NON-PHTHALATE PLASTICIZER MARKET BY TYPE (USD BILLION), 2020-2029
TABLE 10 NORTH AMERICA NON-PHTHALATE PLASTICIZER MARKET BY TYPE (KILOTONS), 2020-2029
TABLE 11 NORTH AMERICA NON-PHTHALATE PLASTICIZER MARKET BY APPLICATION (USD BILLION), 2020-2029
TABLE 12 NORTH AMERICA NON-PHTHALATE PLASTICIZER MARKET BY APPLICATION (KILOTONS), 2020-2029
TABLE 13 NORTH AMERICA NON-PHTHALATE PLASTICIZER MARKET BY END USE (USD BILLION), 2020-2029
TABLE 14 NORTH AMERICA NON-PHTHALATE PLASTICIZER MARKET BY END USE (KILOTONS), 2020-2029
TABLE 15 NORTH AMERICA NON-PHTHALATE PLASTICIZER MARKET BY COUNTRY (USD BILLION), 2020-2029
TABLE 16 NORTH AMERICA NON-PHTHALATE PLASTICIZER MARKET BY COUNTRY (KILOTONS), 2020-2029
TABLE 17 US NON-PHTHALATE PLASTICIZER MARKET BY TYPE (USD BILLION), 2020-2029
TABLE 18 US NON-PHTHALATE PLASTICIZER MARKET BY TYPE (KILOTONS), 2020-2029
TABLE 19 US NON-PHTHALATE PLASTICIZER MARKET BY APPLICATION (USD BILLION), 2020-2029
TABLE 20 US NON-PHTHALATE PLASTICIZER MARKET BY APPLICATION (KILOTONS), 2020-2029
TABLE 21 US NON-PHTHALATE PLASTICIZER MARKET BY END USE (USD BILLION), 2020-2029
TABLE 22 US NON-PHTHALATE PLASTICIZER MARKET BY END USE (KILOTONS), 2020-2029
TABLE 23 CANADA NON-PHTHALATE PLASTICIZER MARKET BY TYPE (USD BILLION), 2020-2029
TABLE 24 CANADA NON-PHTHALATE PLASTICIZER MARKET BY TYPE (KILOTONS), 2020-2029
TABLE 25 CANADA NON-PHTHALATE PLASTICIZER MARKET BY APPLICATION (USD BILLION), 2020-2029
TABLE 26 CANADA NON-PHTHALATE PLASTICIZER MARKET BY APPLICATION (KILOTONS), 2020-2029
TABLE 27 CANADA NON-PHTHALATE PLASTICIZER MARKET BY END USE (USD BILLION), 2020-2029
TABLE 28 CANADA NON-PHTHALATE PLASTICIZER MARKET BY END USE (KILOTONS), 2020-2029
TABLE 29 MEXICO NON-PHTHALATE PLASTICIZER MARKET BY TYPE (USD BILLION), 2020-2029
TABLE 30 MEXICO NON-PHTHALATE PLASTICIZER MARKET BY TYPE (KILOTONS), 2020-2029
TABLE 31 MEXICO NON-PHTHALATE PLASTICIZER MARKET BY APPLICATION (USD BILLION), 2020-2029
TABLE 32 MEXICO NON-PHTHALATE PLASTICIZER MARKET BY APPLICATION (KILOTONS), 2020-2029
TABLE 33 MEXICO NON-PHTHALATE PLASTICIZER MARKET BY END USE (USD BILLION), 2020-2029
TABLE 34 MEXICO NON-PHTHALATE PLASTICIZER MARKET BY END USE (KILOTONS), 2020-2029
TABLE 35 REST OF NORTH AMERICA NON-PHTHALATE PLASTICIZER MARKET BY TYPE (USD BILLION), 2020-2029
TABLE 36 REST OF NORTH AMERICA NON-PHTHALATE PLASTICIZER MARKET BY TYPE (KILOTONS), 2020-2029
TABLE 37 REST OF NORTH AMERICA NON-PHTHALATE PLASTICIZER MARKET BY APPLICATION (USD BILLION), 2020-2029
TABLE 38 REST OF NORTH AMERICA NON-PHTHALATE PLASTICIZER MARKET BY APPLICATION (KILOTONS), 2020-2029
TABLE 39 REST OF NORTH AMERICA NON-PHTHALATE PLASTICIZER MARKET BY END USE (USD BILLION), 2020-2029
TABLE 40 REST OF NORTH AMERICA NON-PHTHALATE PLASTICIZER MARKET BY END USE (KILOTONS), 2020-2029
TABLE 41 SOUTH AMERICA NON-PHTHALATE PLASTICIZER MARKET BY TYPE (USD BILLION), 2020-2029
TABLE 42 SOUTH AMERICA NON-PHTHALATE PLASTICIZER MARKET BY TYPE (KILOTONS), 2020-2029
TABLE 43 SOUTH AMERICA NON-PHTHALATE PLASTICIZER MARKET BY APPLICATION (USD BILLION), 2020-2029
TABLE 44 SOUTH AMERICA NON-PHTHALATE PLASTICIZER MARKET BY APPLICATION (KILOTONS), 2020-2029
TABLE 45 SOUTH AMERICA NON-PHTHALATE PLASTICIZER MARKET BY END USE (USD BILLION), 2020-2029
TABLE 46 SOUTH AMERICA NON-PHTHALATE PLASTICIZER MARKET BY END USE (KILOTONS), 2020-2029
TABLE 47 SOUTH AMERICA NON-PHTHALATE PLASTICIZER MARKET BY COUNTRY (USD BILLION), 2020-2029
TABLE 48 SOUTH AMERICA NON-PHTHALATE PLASTICIZER MARKET BY COUNTRY (KILOTONS), 2020-2029
TABLE 49 BRAZIL NON-PHTHALATE PLASTICIZER MARKET BY TYPE (USD BILLION), 2020-2029
TABLE 50 BRAZIL NON-PHTHALATE PLASTICIZER MARKET BY TYPE (KILOTONS), 2020-2029
TABLE 51 BRAZIL NON-PHTHALATE PLASTICIZER MARKET BY APPLICATION (USD BILLION), 2020-2029
TABLE 52 BRAZIL NON-PHTHALATE PLASTICIZER MARKET BY APPLICATION (KILOTONS), 2020-2029
TABLE 53 BRAZIL NON-PHTHALATE PLASTICIZER MARKET BY END USE (USD BILLION), 2020-2029
TABLE 54 BRAZIL NON-PHTHALATE PLASTICIZER MARKET BY END USE (KILOTONS), 2020-2029
TABLE 55 ARGENTINA NON-PHTHALATE PLASTICIZER MARKET BY TYPE (USD BILLION), 2020-2029
TABLE 56 ARGENTINA NON-PHTHALATE PLASTICIZER MARKET BY TYPE (KILOTONS), 2020-2029
TABLE 57 ARGENTINA NON-PHTHALATE PLASTICIZER MARKET BY APPLICATION (USD BILLION), 2020-2029
TABLE 58 ARGENTINA NON-PHTHALATE PLASTICIZER MARKET BY APPLICATION (KILOTONS), 2020-2029
TABLE 59 ARGENTINA NON-PHTHALATE PLASTICIZER MARKET BY END USE (USD BILLION), 2020-2029
TABLE 60 ARGENTINA NON-PHTHALATE PLASTICIZER MARKET BY END USE (KILOTONS), 2020-2029
TABLE 61 COLOMBIA NON-PHTHALATE PLASTICIZER MARKET BY TYPE (USD BILLION), 2020-2029
TABLE 62 COLOMBIA NON-PHTHALATE PLASTICIZER MARKET BY TYPE (KILOTONS), 2020-2029
TABLE 63 COLOMBIA NON-PHTHALATE PLASTICIZER MARKET BY APPLICATION (USD BILLION), 2020-2029
TABLE 64 COLOMBIA NON-PHTHALATE PLASTICIZER MARKET BY APPLICATION (KILOTONS), 2020-2029
TABLE 65 COLOMBIA NON-PHTHALATE PLASTICIZER MARKET BY END USE (USD BILLION), 2020-2029
TABLE 66 COLOMBIA NON-PHTHALATE PLASTICIZER MARKET BY END USE (KILOTONS), 2020-2029
TABLE 67 REST OF SOUTH AMERICA NON-PHTHALATE PLASTICIZER MARKET BY TYPE (USD BILLION), 2020-2029
TABLE 68 REST OF SOUTH AMERICA NON-PHTHALATE PLASTICIZER MARKET BY TYPE (KILOTONS), 2020-2029
TABLE 69 REST OF SOUTH AMERICA NON-PHTHALATE PLASTICIZER MARKET BY APPLICATION (USD BILLION), 2020-2029
TABLE 70 REST OF SOUTH AMERICA NON-PHTHALATE PLASTICIZER MARKET BY APPLICATION (KILOTONS), 2020-2029
TABLE 71 REST OF SOUTH AMERICA NON-PHTHALATE PLASTICIZER MARKET BY END USE (USD BILLION), 2020-2029
TABLE 72 REST OF SOUTH AMERICA NON-PHTHALATE PLASTICIZER MARKET BY END USE (KILOTONS), 2020-2029
TABLE 73 ASIA -PACIFIC NON-PHTHALATE PLASTICIZER MARKET BY TYPE (USD BILLION), 2020-2029
TABLE 74 ASIA -PACIFIC NON-PHTHALATE PLASTICIZER MARKET BY TYPE (KILOTONS), 2020-2029
TABLE 75 ASIA -PACIFIC NON-PHTHALATE PLASTICIZER MARKET BY APPLICATION (USD BILLION), 2020-2029
TABLE 76 ASIA -PACIFIC NON-PHTHALATE PLASTICIZER MARKET BY APPLICATION (KILOTONS), 2020-2029
TABLE 77 ASIA -PACIFIC NON-PHTHALATE PLASTICIZER MARKET BY END USE (USD BILLION), 2020-2029
TABLE 78 ASIA -PACIFIC NON-PHTHALATE PLASTICIZER MARKET BY END USE (KILOTONS), 2020-2029
TABLE 79 ASIA -PACIFIC NON-PHTHALATE PLASTICIZER MARKET BY COUNTRY (USD BILLION), 2020-2029
TABLE 80 ASIA -PACIFIC NON-PHTHALATE PLASTICIZER MARKET BY COUNTRY (KILOTONS), 2020-2029
TABLE 81 INDIA NON-PHTHALATE PLASTICIZER MARKET BY TYPE (USD BILLION), 2020-2029
TABLE 82 INDIA NON-PHTHALATE PLASTICIZER MARKET BY TYPE (KILOTONS), 2020-2029
TABLE 83 INDIA NON-PHTHALATE PLASTICIZER MARKET BY APPLICATION (USD BILLION), 2020-2029
TABLE 84 INDIA NON-PHTHALATE PLASTICIZER MARKET BY APPLICATION (KILOTONS), 2020-2029
TABLE 85 INDIA NON-PHTHALATE PLASTICIZER MARKET BY END USE (USD BILLION), 2020-2029
TABLE 86 INDIA NON-PHTHALATE PLASTICIZER MARKET BY END USE (KILOTONS), 2020-2029
TABLE 87 CHINA NON-PHTHALATE PLASTICIZER MARKET BY TYPE (USD BILLION), 2020-2029
TABLE 88 CHINA NON-PHTHALATE PLASTICIZER MARKET BY TYPE (KILOTONS), 2020-2029
TABLE 89 CHINA NON-PHTHALATE PLASTICIZER MARKET BY APPLICATION (USD BILLION), 2020-2029
TABLE 90 CHINA NON-PHTHALATE PLASTICIZER MARKET BY APPLICATION (KILOTONS), 2020-2029
TABLE 91 CHINA NON-PHTHALATE PLASTICIZER MARKET BY END USE (USD BILLION), 2020-2029
TABLE 92 CHINA NON-PHTHALATE PLASTICIZER MARKET BY END USE (KILOTONS), 2020-2029
TABLE 93 JAPAN NON-PHTHALATE PLASTICIZER MARKET BY TYPE (USD BILLION), 2020-2029
TABLE 94 JAPAN NON-PHTHALATE PLASTICIZER MARKET BY TYPE (KILOTONS), 2020-2029
TABLE 95 JAPAN NON-PHTHALATE PLASTICIZER MARKET BY APPLICATION (USD BILLION), 2020-2029
TABLE 96 JAPAN NON-PHTHALATE PLASTICIZER MARKET BY APPLICATION (KILOTONS), 2020-2029
TABLE 97 JAPAN NON-PHTHALATE PLASTICIZER MARKET BY END USE (USD BILLION), 2020-2029
TABLE 98 JAPAN NON-PHTHALATE PLASTICIZER MARKET BY END USE (KILOTONS), 2020-2029
TABLE 99 SOUTH KOREA NON-PHTHALATE PLASTICIZER MARKET BY TYPE (USD BILLION), 2020-2029
TABLE 100 SOUTH KOREA NON-PHTHALATE PLASTICIZER MARKET BY TYPE (KILOTONS), 2020-2029
TABLE 101 SOUTH KOREA NON-PHTHALATE PLASTICIZER MARKET BY APPLICATION (USD BILLION), 2020-2029
TABLE 102 SOUTH KOREA NON-PHTHALATE PLASTICIZER MARKET BY APPLICATION (KILOTONS), 2020-2029
TABLE 103 SOUTH KOREA NON-PHTHALATE PLASTICIZER MARKET BY END USE (USD BILLION), 2020-2029
TABLE 104 SOUTH KOREA NON-PHTHALATE PLASTICIZER MARKET BY END USE (KILOTONS), 2020-2029
TABLE 105 AUSTRALIA NON-PHTHALATE PLASTICIZER MARKET BY TYPE (USD BILLION), 2020-2029
TABLE 106 AUSTRALIA NON-PHTHALATE PLASTICIZER MARKET BY APPLICATIONBY TYPE (KILOTONS), 2020-2029
TABLE 107 AUSTRALIA NON-PHTHALATE PLASTICIZER MARKET BY APPLICATION (USD BILLION), 2020-2029
TABLE 108 AUSTRALIA NON-PHTHALATE PLASTICIZER MARKET BY APPLICATION (KILOTONS), 2020-2029
TABLE 109 AUSTRALIA NON-PHTHALATE PLASTICIZER MARKET BY END USE (USD BILLION), 2020-2029
TABLE 110 AUSTRALIA NON-PHTHALATE PLASTICIZER MARKET BY END USE (KILOTONS), 2020-2029
TABLE 111 REST OF ASIA PACIFIC NON-PHTHALATE PLASTICIZER MARKET BY TYPE (USD BILLION), 2020-2029
TABLE 112 REST OF ASIA PACIFIC NON-PHTHALATE PLASTICIZER MARKET BY APPLICATIONBY TYPE (KILOTONS), 2020-2029
TABLE 113 REST OF ASIA PACIFIC NON-PHTHALATE PLASTICIZER MARKET BY APPLICATION (USD BILLION), 2020-2029
TABLE 114 REST OF ASIA PACIFIC NON-PHTHALATE PLASTICIZER MARKET BY APPLICATION (KILOTONS), 2020-2029
TABLE 115 REST OF ASIA PACIFIC NON-PHTHALATE PLASTICIZER MARKET BY END USE (USD BILLION), 2020-2029
TABLE 116 REST OF ASIA PACIFIC NON-PHTHALATE PLASTICIZER MARKET BY END USE (KILOTONS), 2020-2029
TABLE 117 EUROPE NON-PHTHALATE PLASTICIZER MARKET BY TYPE (USD BILLION), 2020-2029
TABLE 118 EUROPE NON-PHTHALATE PLASTICIZER MARKET BY TYPE (KILOTONS), 2020-2029
TABLE 119 EUROPE NON-PHTHALATE PLASTICIZER MARKET BY APPLICATION (USD BILLION), 2020-2029
TABLE 120 EUROPE NON-PHTHALATE PLASTICIZER MARKET BY APPLICATION (KILOTONS), 2020-2029
TABLE 121 EUROPE NON-PHTHALATE PLASTICIZER MARKET BY END USE (USD BILLION), 2020-2029
TABLE 122 EUROPE NON-PHTHALATE PLASTICIZER MARKET BY END USE (KILOTONS), 2020-2029
TABLE 123 EUROPE NON-PHTHALATE PLASTICIZER MARKET BY COUNTRY (USD BILLION), 2020-2029
TABLE 124 EUROPE NON-PHTHALATE PLASTICIZER MARKET BY COUNTRY (KILOTONS), 2020-2029
TABLE 125 GERMANY NON-PHTHALATE PLASTICIZER MARKET BY TYPE (USD BILLION), 2020-2029
TABLE 126 GERMANY NON-PHTHALATE PLASTICIZER MARKET BY TYPE (KILOTONS), 2020-2029
TABLE 127 GERMANY NON-PHTHALATE PLASTICIZER MARKET BY APPLICATION (USD BILLION), 2020-2029
TABLE 128 GERMANY NON-PHTHALATE PLASTICIZER MARKET BY APPLICATION (KILOTONS), 2020-2029
TABLE 129 GERMANY NON-PHTHALATE PLASTICIZER MARKET BY END USE (USD BILLION), 2020-2029
TABLE 130 GERMANY NON-PHTHALATE PLASTICIZER MARKET BY END USE (KILOTONS), 2020-2029
TABLE 131 UK NON-PHTHALATE PLASTICIZER MARKET BY TYPE (USD BILLION), 2020-2029
TABLE 132 UK NON-PHTHALATE PLASTICIZER MARKET BY TYPE (KILOTONS), 2020-2029
TABLE 133 UK NON-PHTHALATE PLASTICIZER MARKET BY APPLICATION (USD BILLION), 2020-2029
TABLE 134 UK NON-PHTHALATE PLASTICIZER MARKET BY APPLICATION (KILOTONS), 2020-2029
TABLE 135 UK NON-PHTHALATE PLASTICIZER MARKET BY END USE (USD BILLION), 2020-2029
TABLE 136 UK NON-PHTHALATE PLASTICIZER MARKET BY END USE (USD KILOTONS), 2020-2029
TABLE 137 FRANCE NON-PHTHALATE PLASTICIZER MARKET BY TYPE (USD BILLION), 2020-2029
TABLE 138 FRANCE NON-PHTHALATE PLASTICIZER MARKET BY TYPE (KILOTONS), 2020-2029
TABLE 139 FRANCE NON-PHTHALATE PLASTICIZER MARKET BY APPLICATION (USD BILLION), 2020-2029
TABLE 140 FRANCE NON-PHTHALATE PLASTICIZER MARKET BY APPLICATION (KILOTONS), 2020-2029
TABLE 141 FRANCE NON-PHTHALATE PLASTICIZER MARKET BY END USE (USD BILLION), 2020-2029
TABLE 142 FRANCE NON-PHTHALATE PLASTICIZER MARKET BY END USE (KILOTONS), 2020-2029
TABLE 143 ITALY NON-PHTHALATE PLASTICIZER MARKET BY TYPE (USD BILLION), 2020-2029
TABLE 144 ITALY NON-PHTHALATE PLASTICIZER MARKET BY TYPE (KILOTONS), 2020-2029
TABLE 145 ITALY NON-PHTHALATE PLASTICIZER MARKET BY APPLICATION (USD BILLION), 2020-2029
TABLE 146 ITALY NON-PHTHALATE PLASTICIZER MARKET BY APPLICATION (KILOTONS), 2020-2029
TABLE 147 ITALY NON-PHTHALATE PLASTICIZER MARKET BY END USE (USD BILLION), 2020-2029
TABLE 148 ITALY NON-PHTHALATE PLASTICIZER MARKET BY END USE (KILOTONS), 2020-2029
TABLE 149 SPAIN NON-PHTHALATE PLASTICIZER MARKET BY TYPE (USD BILLION), 2020-2029
TABLE 150 SPAIN NON-PHTHALATE PLASTICIZER MARKET BY TYPE (KILOTONS), 2020-2029
TABLE 151 SPAIN NON-PHTHALATE PLASTICIZER MARKET BY APPLICATION (USD BILLION), 2020-2029
TABLE 152 SPAIN NON-PHTHALATE PLASTICIZER MARKET BY APPLICATION (KILOTONS), 2020-2029
TABLE 153 SPAIN NON-PHTHALATE PLASTICIZER MARKET BY END USE (USD BILLION), 2020-2029
TABLE 154 SPAIN NON-PHTHALATE PLASTICIZER MARKET BY END USE (KILOTONS), 2020-2029
TABLE 155 RUSSIA NON-PHTHALATE PLASTICIZER MARKET BY TYPE (USD BILLION), 2020-2029
TABLE 156 RUSSIA NON-PHTHALATE PLASTICIZER MARKET BY TYPE (KILOTONS), 2020-2029
TABLE 157 RUSSIA NON-PHTHALATE PLASTICIZER MARKET BY APPLICATION (USD BILLION), 2020-2029
TABLE 158 RUSSIA NON-PHTHALATE PLASTICIZER MARKET BY APPLICATION (KILOTONS), 2020-2029
TABLE 159 RUSSIA NON-PHTHALATE PLASTICIZER MARKET BY END USE (USD BILLION), 2020-2029
TABLE 160 RUSSIA NON-PHTHALATE PLASTICIZER MARKET BY END USE (KILOTONS), 2020-2029
TABLE 161 REST OF EUROPE NON-PHTHALATE PLASTICIZER MARKET BY TYPE (USD BILLION), 2020-2029
TABLE 162 REST OF EUROPE NON-PHTHALATE PLASTICIZER MARKET BY TYPE (KILOTONS), 2020-2029
TABLE 163 REST OF EUROPE NON-PHTHALATE PLASTICIZER MARKET BY APPLICATION (USD BILLION), 2020-2029
TABLE 164 REST OF EUROPE NON-PHTHALATE PLASTICIZER MARKET BY APPLICATION (KILOTONS), 2020-2029
TABLE 165 REST OF EUROPE NON-PHTHALATE PLASTICIZER MARKET BY END USE (USD BILLION), 2020-2029
TABLE 166 REST OF EUROPE NON-PHTHALATE PLASTICIZER MARKET BY END USE (KILOTONS), 2020-2029
TABLE 167 MIDDLE EAST AND AFRICA NON-PHTHALATE PLASTICIZER MARKET BY TYPE (USD BILLION), 2020-2029
TABLE 168 MIDDLE EAST AND AFRICA NON-PHTHALATE PLASTICIZER MARKET BY TYPE (KILOTONS), 2020-2029
TABLE 169 MIDDLE EAST AND AFRICA NON-PHTHALATE PLASTICIZER MARKET BY APPLICATION (USD BILLION), 2020-2029
TABLE 170 MIDDLE EAST AND AFRICA NON-PHTHALATE PLASTICIZER MARKET BY APPLICATION (KILOTONS), 2020-2029
TABLE 171 MIDDLE EAST AND AFRICA NON-PHTHALATE PLASTICIZER MARKET BY END USE (USD BILLION), 2020-2029
TABLE 172 MIDDLE EAST AND AFRICA NON-PHTHALATE PLASTICIZER MARKET BY END USE (KILOTONS), 2020-2029
TABLE 173 MIDDLE EAST AND AFRICA NON-PHTHALATE PLASTICIZER MARKET BY COUNTRY (USD BILLION), 2020-2029
TABLE 174 MIDDLE EAST AND AFRICA NON-PHTHALATE PLASTICIZER MARKET BY COUNTRY (KILOTONS), 2020-2029
TABLE 175 UAE NON-PHTHALATE PLASTICIZER MARKET BY TYPE (USD BILLION), 2020-2029
TABLE 176 UAE NON-PHTHALATE PLASTICIZER MARKET BY TYPE (KILOTONS), 2020-2029
TABLE 177 UAE NON-PHTHALATE PLASTICIZER MARKET BY APPLICATION (USD BILLION), 2020-2029
TABLE 178 UAE NON-PHTHALATE PLASTICIZER MARKET BY APPLICATION (KILOTONS), 2020-2029
TABLE 179 UAE NON-PHTHALATE PLASTICIZER MARKET BY END USE (USD BILLION), 2020-2029
TABLE 180 UAE NON-PHTHALATE PLASTICIZER MARKET BY END USE (KILOTONS), 2020-2029
TABLE 181 SAUDI ARABIA NON-PHTHALATE PLASTICIZER MARKET BY TYPE (USD BILLION), 2020-2029
TABLE 182 SAUDI ARABIA NON-PHTHALATE PLASTICIZER MARKET BY TYPE (KILOTONS), 2020-2029
TABLE 183 SAUDI ARABIA NON-PHTHALATE PLASTICIZER MARKET BY APPLICATION (USD BILLION), 2020-2029
TABLE 184 SAUDI ARABIA NON-PHTHALATE PLASTICIZER MARKET BY APPLICATION (KILOTONS), 2020-2029
TABLE 185 SAUDI ARABIA NON-PHTHALATE PLASTICIZER MARKET BY END USE (USD BILLION), 2020-2029
TABLE 186 SAUDI ARABIA NON-PHTHALATE PLASTICIZER MARKET BY END USE (KILOTONS), 2020-2029
TABLE 187 SOUTH AFRICA NON-PHTHALATE PLASTICIZER MARKET BY TYPE (USD BILLION), 2020-2029
TABLE 188 SOUTH AFRICA NON-PHTHALATE PLASTICIZER MARKET BY TYPE (KILOTONS), 2020-2029
TABLE 189 SOUTH AFRICA NON-PHTHALATE PLASTICIZER MARKET BY APPLICATION (USD BILLION), 2020-2029
TABLE 190 SOUTH AFRICA NON-PHTHALATE PLASTICIZER MARKET BY APPLICATION (KILOTONS), 2020-2029
TABLE 191 SOUTH AFRICA NON-PHTHALATE PLASTICIZER MARKET BY END USE (USD BILLION), 2020-2029
TABLE 192 SOUTH AFRICA NON-PHTHALATE PLASTICIZER MARKET BY END USE (KILOTONS), 2020-2029
TABLE 193 REST OF MIDDLE EAST AND AFRICA NON-PHTHALATE PLASTICIZER MARKET BY TYPE (USD BILLION), 2020-2029
TABLE 194 REST OF MIDDLE EAST AND AFRICA NON-PHTHALATE PLASTICIZER MARKET BY TYPE (KILOTONS), 2020-2029
TABLE 195 REST OF MIDDLE EAST AND AFRICA NON-PHTHALATE PLASTICIZER MARKET BY APPLICATION (USD BILLION), 2020-2029
TABLE 196 REST OF MIDDLE EAST AND AFRICA NON-PHTHALATE PLASTICIZER MARKET BY APPLICATION (KILOTONS), 2020-2029
TABLE 197 REST OF MIDDLE EAST AND AFRICA NON-PHTHALATE PLASTICIZER MARKET BY END USE (USD BILLION), 2020-2029
TABLE 198 REST OF MIDDLE EAST AND AFRICA NON-PHTHALATE PLASTICIZER MARKET BY END USE (KILOTONS), 2020-2029
LIST OF FIGURES
FIGURE 1 MARKET DYNAMICS
FIGURE 2 MARKET SEGMENTATION
FIGURE 3 REPORT TIMELINES: YEARS CONSIDERED
FIGURE 4 DATA TRIANGULATION
FIGURE 5 BOTTOM-UP APPROACH
FIGURE 6 TOP-DOWN APPROACH
FIGURE 7 RESEARCH FLOW
FIGURE 8 GLOBAL NON-PHTHALATE PLASTICIZER MARKET BY TYPE, USD BILLION, KILOTONS, 2020-2029
FIGURE 9 GLOBAL NON-PHTHALATE PLASTICIZER MARKET BY APPLICATION, USD BILLION, KILOTONS, 2020-2029
FIGURE 10 GLOBAL NON-PHTHALATE PLASTICIZER MARKET BY END USE, USD BILLION, KILOTONS, 2020-2029
FIGURE 11 GLOBAL NON-PHTHALATE PLASTICIZER MARKET BY REGION, USD BILLION, KILOTONS, 2020-2029
FIGURE 12 PORTER’S FIVE FORCES MODEL
FIGURE 13 GLOBAL NON-PHTHALATE PLASTICIZER MARKET BY TYPE, USD BILLION, 2021
FIGURE 14 GLOBAL NON-PHTHALATE PLASTICIZER MARKET BY APPLICATION, USD BILLION, 2021
FIGURE 15 GLOBAL NON-PHTHALATE PLASTICIZER MARKET BY END USE, USD BILLION, 2021
FIGURE 16 GLOBAL NON-PHTHALATE PLASTICIZER MARKET BY REGION, USD BILLION, 2021
FIGURE 17 MARKET SHARE ANALYSIS
FIGURE 18 BASF SE: COMPANY SNAPSHOT
FIGURE 19 EVONIK: COMPANY SNAPSHOT
FIGURE 20 EXXON MOBIL CORPORATION: COMPANY SNAPSHOT
FIGURE 21 LANXESS: COMPANY SNAPSHOT
FIGURE 22 AVIENT CORPORATION: COMPANY SNAPSHOT
FIGURE 23 EASTMAN CHEMICAL COMPANY: COMPANY SNAPSHOT
FIGURE 24 KLJ GROUP: COMPANY SNAPSHOT
FIGURE 25 MITSUBISHI CHEMICAL CORPORATIONS: COMPANY SNAPSHOT
FIGURE 26 NAN YA PLASTICS CORPORATION: COMPANY SNAPSHOT
FIGURE 27 DIC CORPORATIONS: COMPANY SNAPSHOT
DOWNLOAD FREE SAMPLE REPORT
License Type
SPEAK WITH OUR ANALYST
Want to know more about the report or any specific requirement?
WANT TO CUSTOMIZE THE REPORT?
Our Clients Speak
We asked them to research ‘ Equipment market’ all over the world, and their whole arrangement was helpful to us. thehealthanalytics.com insightful analysis and reports contributed to our current analysis and in creating a future strategy. Besides, the te
Yosuke Mitsui
Senior Associate Construction Equipment Sales & Marketing
We asked them to research ‘Equipment market’ all over the world, and their whole arrangement was helpful to us. thehealthanalytics.com insightful analysis and reports contributed to our current analysis and in creating a future strategy. Besides, the te


