

Base Year Value ()
x.x %
x.x %
CAGR ()
x.x %
x.x %
Forecast Year Value ()
x.x %
x.x %
Historical Data Period
Largest Region
Forecast Period
Mercato globale dei micro veicoli elettrici per tipo di batteria (batteria al piombo, batteria agli ioni di litio), per applicazione (uso commerciale, uso personale, servizi pubblici) e regione, tendenze globali e previsioni dal 2022 al 2029
Instant access to hundreds of data points and trends
- Market estimates from 2014-2029
- Competitive analysis, industry segmentation, financial benchmarks
- Incorporates SWOT, Porter's Five Forces and risk management frameworks
- PDF report or online database with Word, Excel and PowerPoint export options
- 100% money back guarantee
Panoramica del mercato dei micro veicoli elettrici
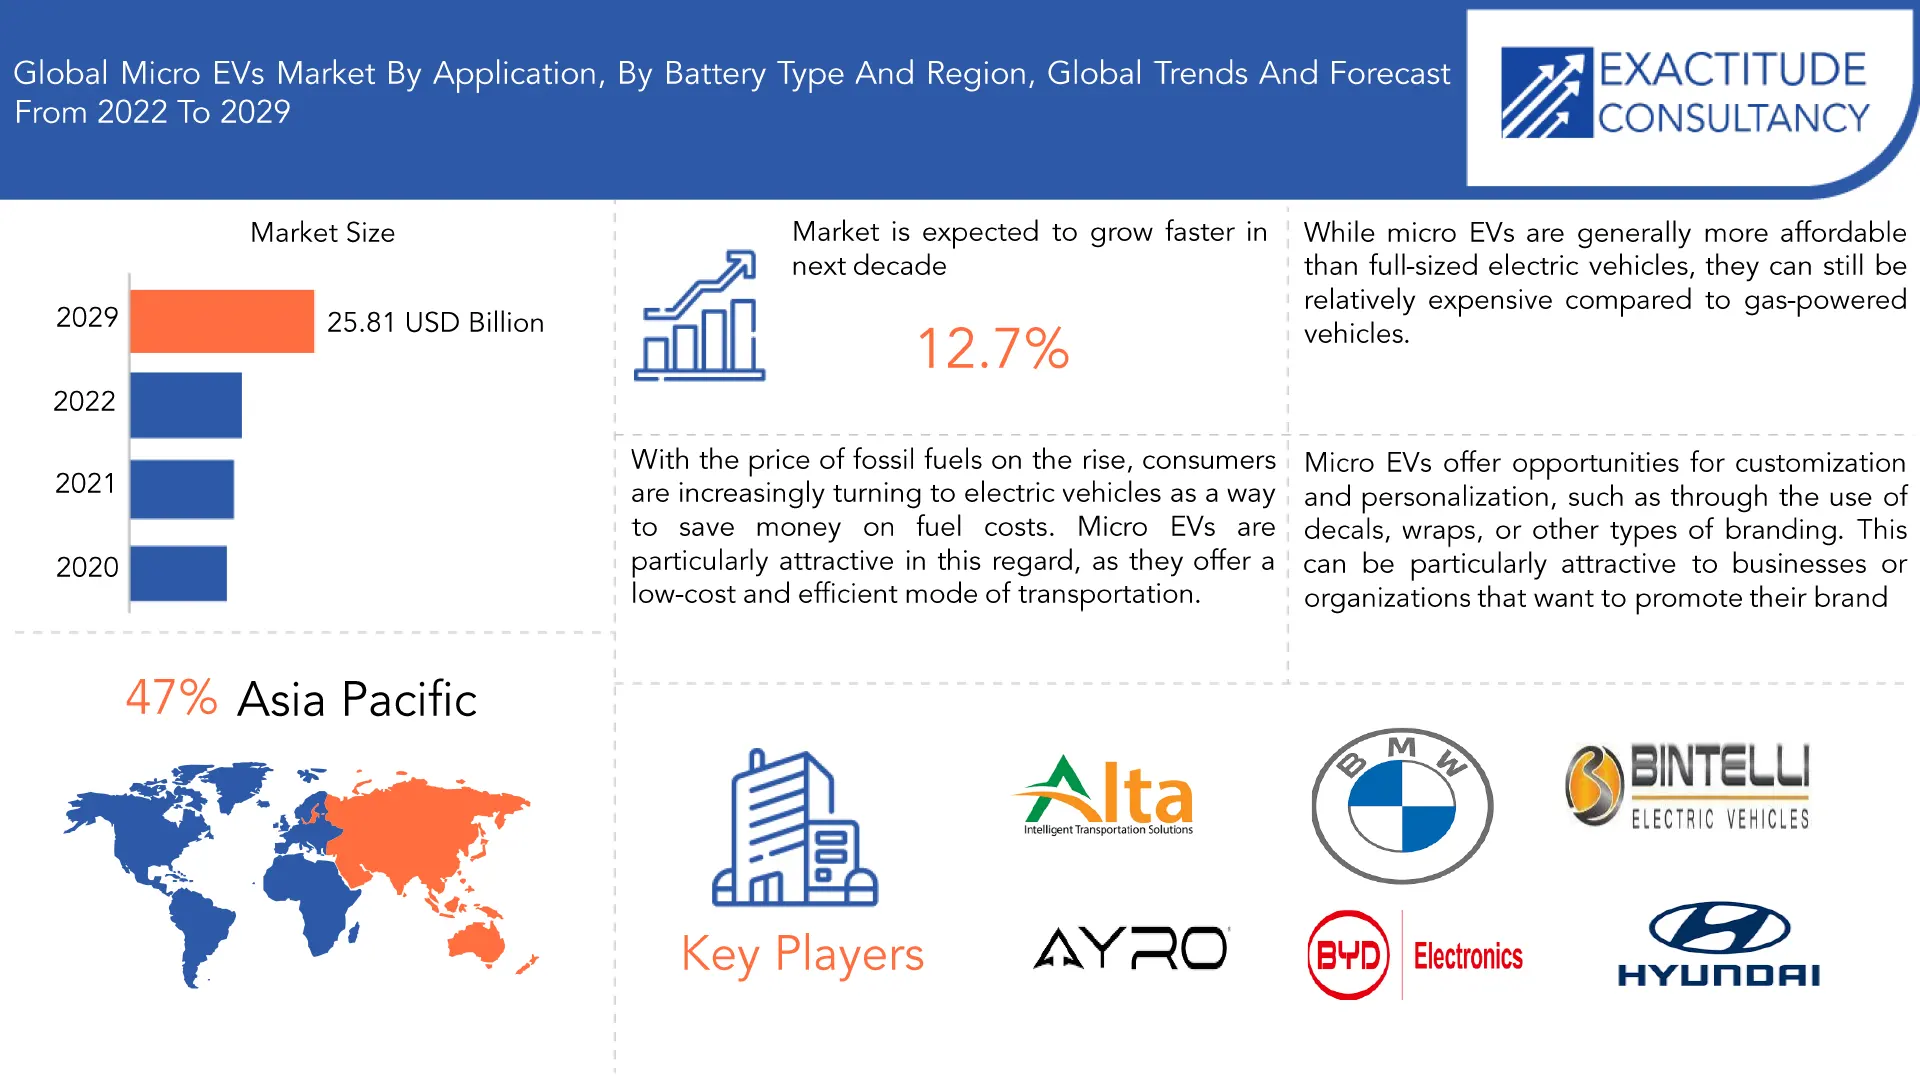
Si prevede che il mercato globale dei micro EV crescerà al 12,70% di CAGR dal 2020 al 2029. Si prevede che raggiungerà oltre 25,81 miliardi di USD entro il 2029 dagli 8,80 miliardi di USD del 2020.
I micro EV, o veicoli micro elettrici , si riferiscono a piccoli veicoli elettrici a bassa velocità progettati per il trasporto a corto raggio in aree urbane e suburbane. Questi veicoli hanno in genere una velocità massima di circa 45 km/h e un'autonomia di 30-50 km per carica. I micro EV sono spesso utilizzati per brevi tragitti, consegne e altre esigenze di trasporto locale. Sono in genere più piccoli e più convenienti dei veicoli elettrici di dimensioni standard, il che li rende un'opzione interessante per i consumatori in molte regioni. I micro EV possono assumere molte forme diverse, tra cui piccole auto, veicoli a tre ruote, biciclette elettriche e altri tipi di veicoli. Le preoccupazioni ambientali sono un fattore trainante importante del mercato dei micro-EV. La necessità di ridurre le emissioni di gas serra e l'inquinamento atmosferico è un problema globale in crescita e il settore dei trasporti è uno dei principali responsabili di questi problemi. I micro EV producono poche o nessuna emissione, il che li rende un'alternativa ecologica ai tradizionali veicoli a benzina. A differenza dei veicoli a benzina che emettono inquinanti e gas serra nell'atmosfera, i micro EV utilizzano motori elettrici e batterie ricaricabili per alimentare i loro motori, con conseguenti emissioni allo scarico pari a zero. L'uso di micro EV può aiutare a ridurre la quantità di inquinamento nelle aree urbane, dove la qualità dell'aria può essere particolarmente scarsa a causa della congestione del traffico e di altri fattori. Ciò può avere un impatto significativo sulla salute pubblica, poiché l'inquinamento atmosferico è stato collegato a problemi respiratori, malattie cardiache e altri problemi di salute. [caption id="attachment_27168" align="aligncenter" width="1920"]
La mobilità urbana è una delle principali opportunità presentate dal mercato dei micro-EV. I micro-EV sono adatti al trasporto a corto raggio nelle aree urbane, dove la congestione del traffico e l'inquinamento atmosferico sono problemi importanti. In molte città, i mezzi di trasporto tradizionali, come auto e autobus, stanno diventando sempre più impraticabili a causa della congestione e della limitata disponibilità di parcheggi. Inoltre, c'è una crescente domanda di modalità di trasporto sostenibili ed efficienti, in particolare tra le generazioni più giovani. I micro EV possono aiutare ad affrontare queste sfide fornendo una modalità di trasporto compatta, efficiente ed ecologica per gli abitanti delle città. Sono abbastanza piccoli da muoversi nelle affollate strade cittadine e possono facilmente adattarsi a parcheggi ristretti. Sono anche in genere alimentati da motori elettrici, il che significa che producono poche o nessuna emissione, il che li rende una scelta ideale per i consumatori attenti all'ambiente. La pandemia di COVID-19 ha avuto un impatto negativo significativo sul mercato dei micro EV. Le vendite di micro EV ai singoli consumatori erano diminuite a causa della domanda ridotta, mentre le interruzioni della catena di fornitura avevano reso difficile per i produttori reperire componenti e materiali. L'impatto economico della pandemia aveva anche portato a una riduzione degli investimenti, rendendo più difficile per i produttori reperire capitali e continuare a sviluppare nuovi prodotti. Le sfide di produzione e manodopera, come la ridotta capacità della forza lavoro e l'aumento delle normative sulla salute e sicurezza, avevano causato ritardi nella produzione e un aumento dei costi. Inoltre, l'incertezza e la volatilità del mercato avevano reso difficile per i produttori pianificare e prendere decisioni strategiche. Sebbene il mercato abbia dimostrato resilienza, è probabile che ci vorrà del tempo prima che il mercato dei micro-veicoli elettrici si riprenda completamente dagli impatti negativi della pandemia.
| ATTRIBUTO | DETTAGLI |
| Periodo di studio | 2020-2029 |
| Anno base | 2021 |
| Anno stimato | 2022 |
| Anno previsto | 2022-2029 |
| Periodo storico | 2018-2020 |
| Unità | Valore (miliardi di USD), (migliaia di unità) |
| Segmentazione | In base al tipo di batteria, all'applicazione e alla regione. |
| Per tipo |
|
| Per applicazioni |
|
| Per regione |
|
Frequently Asked Questions
• What is the worth of the global micro EVs market?
The global micro EVs market is expected to grow at 12.70 % CAGR from 2020 to 2029. It is expected to reach above USD 25.81 Billion by 2029 from USD 8.80 Billion in 2020.
• What is the size of the Asia Pacific micro EVs market?
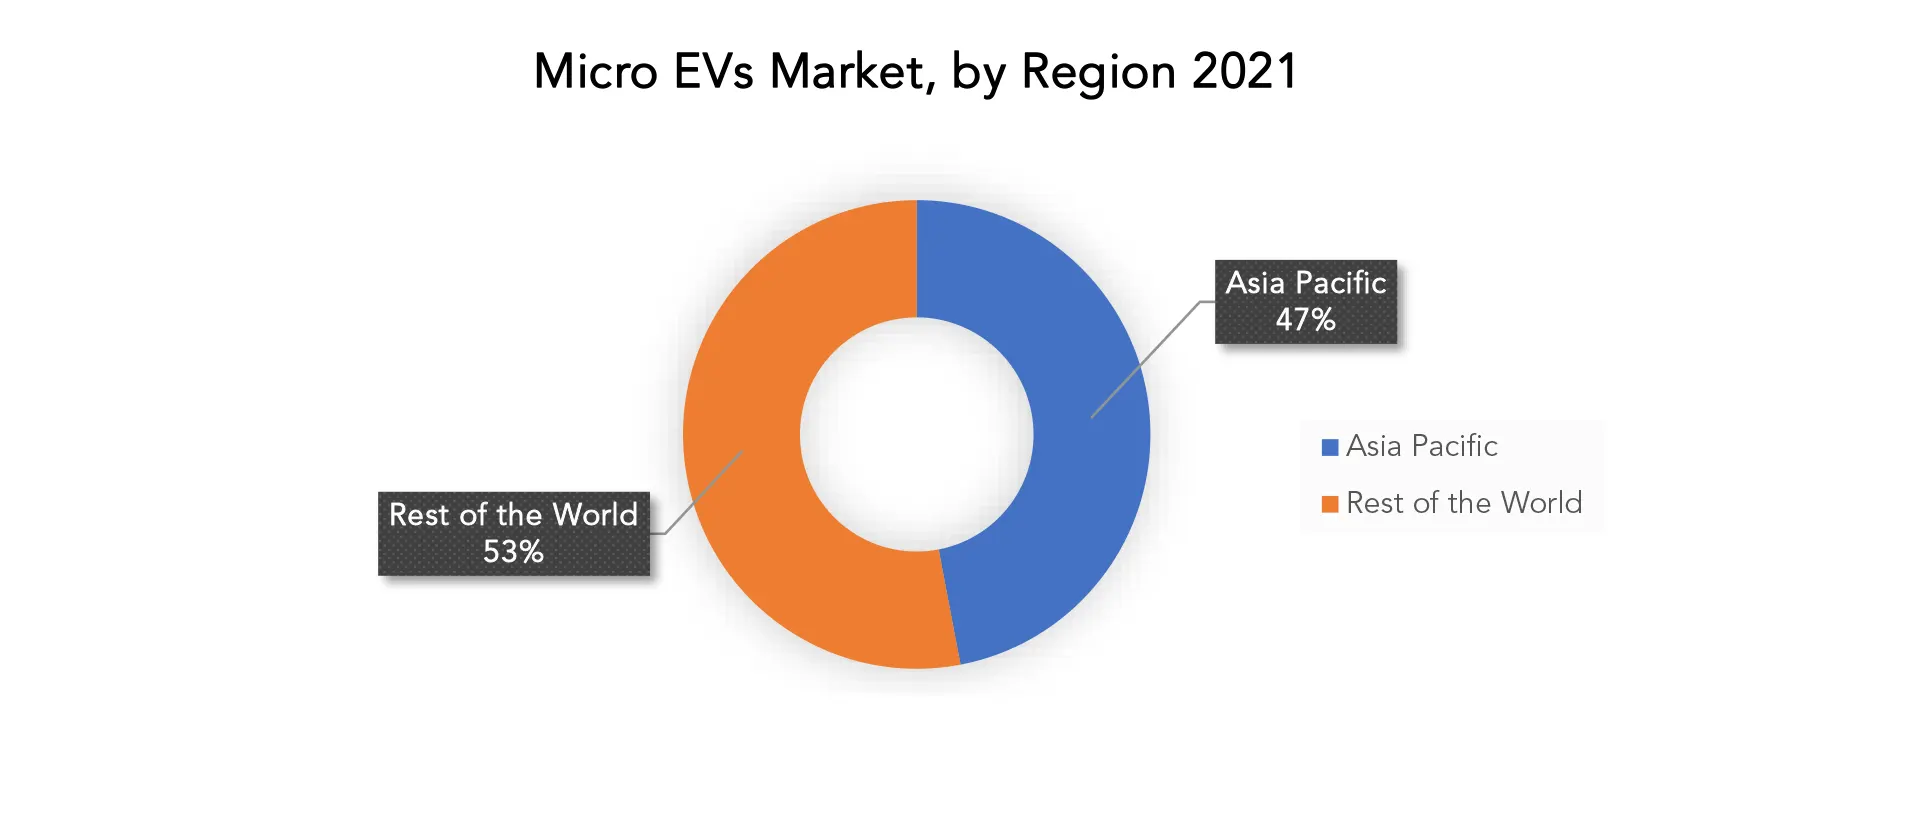
Asia Pacific held more than 47% of the micro EVs market revenue share in 2020 and will witness tremendous expansion during the forecast period.
• What are some of the market's driving forces?
With the price of fossil fuels on the rise, consumers are increasingly turning to electric vehicles as a way to save money on fuel costs. Micro EVs are particularly attractive in this regard, as they offer a low-cost and efficient mode of transportation.
• Which are the top companies to hold the market share in the micro EVs market?
The micro EVs market key players include Alta Zero Emissions Solutions Inc., AYRO Inc., Bayerische Motoren Werke AG, Bintelli Electric Vehicles, BYD Electronic Co. Ltd., Electrameccanica Vehicles Corp., Elio Motors Inc., G H Varley Pty Ltd., Hyundai Motor Co., Club Car
• What is the leading application of the micro EVs market?
The automobile and transportation sector are where the application of market has seen more.
• Which is the largest regional market for micro EVs market?
The markets largest share is in the Asia Pacific region.
Micro EVs Market Segment Analysis
The lithium-ion battery segment is expected to dominate the micro-EV market due to its high energy density, long cycle life, fast charging capabilities, and improving technology. Lithium-ion batteries are a popular choice for micro EVs due to their compact size and lightweight, which maximizes range and performance. With new innovations in solid-state batteries and silicon anodes, it is expected that lithium-ion batteries will continue to be the preferred choice for micro-EV manufacturers in the coming years. The commercial use segment is expected to hold the largest market share in the micro-EV market due to the growing demand for small, agile vehicles that can navigate congested city streets. Micro EVs are often more cost-effective than traditional vehicles for commercial use, as they are less expensive to purchase and operate. They also offer an eco-friendlier alternative to traditional vehicles, which is increasingly important for businesses looking to reduce their carbon footprint. Additionally, many governments offer incentives and subsidies for businesses that adopt electric vehicles, which can help to offset the higher upfront costs of purchasing micro EVs. [caption id="attachment_27196" align="aligncenter" width="1920"]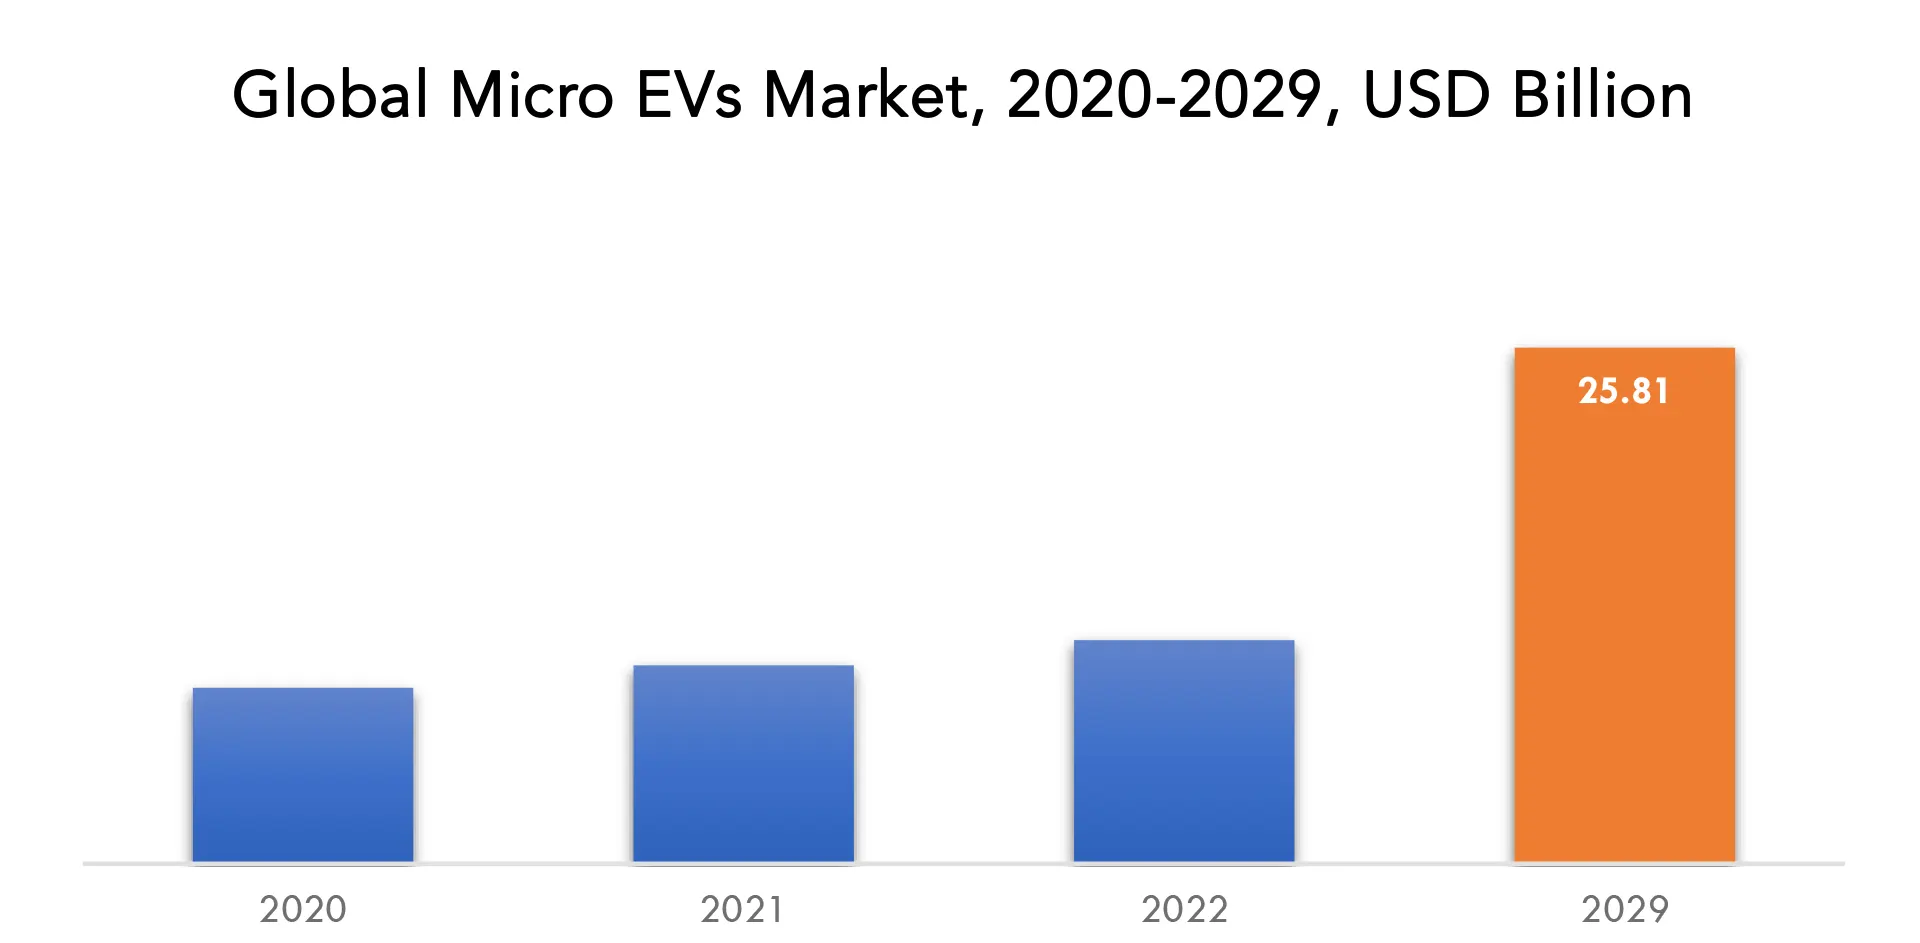
Micro EVs Market Players
The micro EVs market key players include Alta Zero Emissions Solutions Inc., AYRO Inc., Bayerische Motoren Werke AG, Bintelli Electric Vehicles, BYD Electronic Co. Ltd., Electrameccanica Vehicles Corp., Elio Motors Inc., G H Varley Pty Ltd., Hyundai Motor Co., Club Car For corporate expansion, these key leaders are implementing strategic formulations such as new product development and commercialization, commercial expansion, and distribution agreements. Moreover, these participants are substantially spending on product development, which is fueling revenue generation. June 2021 – Club Car announced the launch of an all-new electric vehicle, the Club Car Current, in partnership with AYRO, Inc. Current is a compact, fully electric light-duty truck equipped with automotive features and comforts. August 2021 – Club Car announced the strategic partnership with ezLocator, the industry leader in daily pin placement management. The integration of Club Car Connect with ezLocator will offer golf cars and utility vehicles the ability to manage pin locations with speed and precision.Who Should Buy? Or Key stakeholders
- Investors
- Raw Materials Manufacturer
- Automobile Companies
- Battery Manufacturer
- Supplier and Distributor
- EV Battery Recycling Companies
- Research Organizations
- Regulatory Authorities
- Institutional & retail players
- Others
Micro EVs Market Regional Analysis
The Micro EVs market by region includes North America, Asia-Pacific (APAC), Europe, South America, and Middle East & Africa (MEA).- North America: includes the US, Canada, Mexico
- Asia Pacific: includes China, Japan, South Korea, India, Australia, ASEAN, and Rest of APAC
- Europe: includes the UK, Germany, France, Italy, Spain, Russia, and the Rest of Europe
- South America: includes Brazil, Argentina, and Rest of South America
- Middle East & Africa: includes Turkey, UAE, Saudi Arabia, South Africa, and the Rest of MEA
Key market segments: micro evs market
Micro evs market by battery type, 2020-2029, (usd billion), (thousand units)- Lead acid battery
- Lithium-ion battery
- Commercial use
- Personal use
- Public utilities
- North america
- Asia pacific
- Europe
- South america
- Middle east and africa
Exactitude Consultancy Services Key Objectives:
- Increasing sales and market share
- Developing new technology
- Improving profitability
- Entering new markets
- Enhancing brand reputation
Key Question Answered
- What is the expected growth rate of the micro EVs market over the next 7 years?
- Who are the major players in the micro EVs market and what is their market share?
- What are the end-user industries driving demand for market and what is their outlook?
- What are the opportunities for growth in emerging markets such as Asia-pacific, middle east, and Africa?
- How is the economic environment affecting the micro EVs market, including factors such as interest rates, inflation, and exchange rates?
- What is the expected impact of government policies and regulations on the micro EVs market?
- What is the current and forecasted size and growth rate of the global micro EVs market?
- What are the key drivers of growth in the micro EVs market?
- What are the distribution channels and supply chain dynamics in the micro EVs market?
- What are the technological advancements and innovations in the micro EVs market and their impact on product development and growth?
- What are the regulatory considerations and their impact on the market?
- What are the challenges faced by players in the micro EVs market and how are they addressing these challenges?
- What are the opportunities for growth and expansion in the micro EVs market?
- What are the product offerings and specifications of leading players in the market?
- What is the pricing trend in the market and what is the impact of raw material prices on the price trend?
- INTRODUCTION
- MARKET DEFINITION
- MARKET SEGMENTATION
- RESEARCH TIMELINES
- ASSUMPTIONS AND LIMITATIONS
- RESEARCH METHODOLOGY
- DATA MINING
- SECONDARY RESEARCH
- PRIMARY RESEARCH
- SUBJECT-MATTER EXPERTS’ ADVICE
- QUALITY CHECKS
- FINAL REVIEW
- DATA TRIANGULATION
- BOTTOM-UP APPROACH
- TOP-DOWN APPROACH
- RESEARCH FLOW
- DATA SOURCES
- DATA MINING
- EXECUTIVE SUMMARY
- MARKET OVERVIEW
- GLOBAL MICRO EVS MARKET OUTLOOK
- MARKET DRIVERS
- MARKET RESTRAINTS
- MARKET OPPORTUNITIES
- IMPACT OF COVID-19 ON MICRO EVS MARKET
- PORTER’S FIVE FORCES MODEL
- THREAT FROM NEW ENTRANTS
- THREAT FROM SUBSTITUTES
- BARGAINING POWER OF SUPPLIERS
- BARGAINING POWER OF CUSTOMERS
- DEGREE OF COMPETITION
- INDUSTRY VALUE CHAIN ANALYSIS
- GLOBAL MICRO EVS MARKET OUTLOOK
- GLOBAL MICRO EVS MARKET BY BATTERY TYPE, 2020-2029, (USD BILLION), (THOUSAND UNITS)
- LEAD ACID BATTERY
- LITHIUM-ION BATTERY
- GLOBAL MICRO EVS MARKET BY APPLICATION, 2020-2029, (USD BILLION), (THOUSAND UNITS)
- COMMERCIAL USE
- PERSONAL USE
- PUBLIC UTILITIES
- GLOBAL MICRO EVS MARKET BY REGION, 2020-2029, (USD BILLION), (THOUSAND UNITS)
- NORTH AMERICA
- US
- CANADA
- MEXICO
- SOUTH AMERICA
- BRAZIL
- ARGENTINA
- COLOMBIA
- REST OF SOUTH AMERICA
- EUROPE
- GERMANY
- UK
- FRANCE
- ITALY
- SPAIN
- RUSSIA
- REST OF EUROPE
- ASIA PACIFIC
- INDIA
- CHINA
- JAPAN
- SOUTH KOREA
- AUSTRALIA
- SOUTH-EAST ASIA
- REST OF ASIA PACIFIC
- MIDDLE EAST AND AFRICA
- UAE
- SAUDI ARABIA
- SOUTH AFRICA
- REST OF MIDDLE EAST AND AFRICA
- NORTH AMERICA
- COMPANY PROFILES* (BUSINESS OVERVIEW, COMPANY SNAPSHOT, PRODUCTS OFFERED, RECENT DEVELOPMENTS)
- ALTA ZERO EMISSIONS SOLUTIONS INC.
- AYRO INC.
- BAYERISCHE MOTOREN WERKE AG
- BINTELLI ELECTRIC VEHICLES
- BYD ELECTRONIC CO. LTD.
- ELECTRAMECCANICA VEHICLES CORP.
- ELIO MOTORS INC.
- G H VARLEY PTY LTD.
- HYUNDAI MOTOR CO.
- CLUB CAR *THE COMPANY LIST IS INDICATIVE
LIST OF TABLES
TABLE 1 GLOBAL MICRO EVS MARKET BY BATTERY TYPE (USD BILLION), 2020-2029
TABLE 2 GLOBAL MICRO EVS MARKET BY BATTERY TYPE (THOUSAND UNITS), 2020-2029
TABLE 3 GLOBAL MICRO EVS MARKET BY APPLICATION (USD BILLION), 2020-2029
TABLE 4 GLOBAL MICRO EVS MARKET BY APPLICATION (THOUSAND UNITS), 2020-2029
TABLE 5 GLOBAL MICRO EVS MARKET BY REGION (USD BILLION), 2020-2029
TABLE 6 GLOBAL MICRO EVS MARKET BY REGION (THOUSAND UNITS), 2020-2029
TABLE 7 NORTH AMERICA MICRO EVS MARKET BY BATTERY TYPE (USD BILLION), 2020-2029
TABLE 8 NORTH AMERICA MICRO EVS MARKET BY BATTERY TYPE (THOUSAND UNITS), 2020-2029
TABLE 9 NORTH AMERICA MICRO EVS MARKET BY APPLICATION (USD BILLION), 2020-2029
TABLE 10 NORTH AMERICA MICRO EVS MARKET BY APPLICATION (THOUSAND UNITS), 2020-2029
TABLE 11 NORTH AMERICA MICRO EVS MARKET BY COUNTRY (USD BILLION), 2020-2029
TABLE 12 NORTH AMERICA MICRO EVS MARKET BY COUNTRY (THOUSAND UNITS), 2020-2029
TABLE 13 US MICRO EVS MARKET BY BATTERY TYPE (USD BILLION), 2020-2029
TABLE 14 US MICRO EVS MARKET BY BATTERY TYPE (THOUSAND UNITS), 2020-2029
TABLE 15 US MICRO EVS MARKET BY APPLICATION (USD BILLION), 2020-2029
TABLE 16 US MICRO EVS MARKET BY APPLICATION (THOUSAND UNITS), 2020-2029
TABLE 17 CANADA MICRO EVS MARKET BY BATTERY TYPE (USD BILLION), 2020-2029
TABLE 18 CANADA MICRO EVS MARKET BY BATTERY TYPE (THOUSAND UNITS), 2020-2029
TABLE 19 CANADA MICRO EVS MARKET BY APPLICATION (USD BILLION), 2020-2029
TABLE 20 CANADA MICRO EVS MARKET BY APPLICATION (THOUSAND UNITS), 2020-2029
TABLE 21 MEXICO MICRO EVS MARKET BY BATTERY TYPE (USD BILLION), 2020-2029
TABLE 22 MEXICO MICRO EVS MARKET BY BATTERY TYPE (THOUSAND UNITS), 2020-2029
TABLE 23 MEXICO MICRO EVS MARKET BY APPLICATION (USD BILLION), 2020-2029
TABLE 24 MEXICO MICRO EVS MARKET BY APPLICATION (THOUSAND UNITS), 2020-2029
TABLE 25 SOUTH AMERICA MICRO EVS MARKET BY BATTERY TYPE (USD BILLION), 2020-2029
TABLE 26 SOUTH AMERICA MICRO EVS MARKET BY BATTERY TYPE (THOUSAND UNITS), 2020-2029
TABLE 27 SOUTH AMERICA MICRO EVS MARKET BY COUNTRY (USD BILLION), 2020-2029
TABLE 28 SOUTH AMERICA MICRO EVS MARKET BY COUNTRY (THOUSAND UNITS), 2020-2029
TABLE 29 SOUTH AMERICA MICRO EVS MARKET BY APPLICATION (USD BILLION), 2020-2029
TABLE 30 SOUTH AMERICA MICRO EVS MARKET BY APPLICATION (THOUSAND UNITS), 2020-2029
TABLE 31 BRAZIL MICRO EVS MARKET BY BATTERY TYPE (USD BILLION), 2020-2029
TABLE 32 BRAZIL MICRO EVS MARKET BY BATTERY TYPE (THOUSAND UNITS), 2020-2029
TABLE 33 BRAZIL MICRO EVS MARKET BY APPLICATION (USD BILLION), 2020-2029
TABLE 34 BRAZIL MICRO EVS MARKET BY APPLICATION (THOUSAND UNITS), 2020-2029
TABLE 35 ARGENTINA MICRO EVS MARKET BY BATTERY TYPE (USD BILLION), 2020-2029
TABLE 36 ARGENTINA MICRO EVS MARKET BY BATTERY TYPE (THOUSAND UNITS), 2020-2029
TABLE 37 ARGENTINA MICRO EVS MARKET BY APPLICATION (USD BILLION), 2020-2029
TABLE 38 ARGENTINA MICRO EVS MARKET BY APPLICATION (THOUSAND UNITS), 2020-2029
TABLE 39 COLOMBIA MICRO EVS MARKET BY BATTERY TYPE (USD BILLION), 2020-2029
TABLE 40 COLOMBIA MICRO EVS MARKET BY BATTERY TYPE (THOUSAND UNITS), 2020-2029
TABLE 41 COLOMBIA MICRO EVS MARKET BY APPLICATION (USD BILLION), 2020-2029
TABLE 42 COLOMBIA MICRO EVS MARKET BY APPLICATION (THOUSAND UNITS), 2020-2029
TABLE 43 REST OF SOUTH AMERICA MICRO EVS MARKET BY BATTERY TYPE (USD BILLION), 2020-2029
TABLE 44 REST OF SOUTH AMERICA MICRO EVS MARKET BY BATTERY TYPE (THOUSAND UNITS), 2020-2029
TABLE 45 REST OF SOUTH AMERICA MICRO EVS MARKET BY APPLICATION (USD BILLION), 2020-2029
TABLE 46 REST OF SOUTH AMERICA MICRO EVS MARKET BY APPLICATION (THOUSAND UNITS), 2020-2029
TABLE 47 ASIA-PACIFIC MICRO EVS MARKET BY BATTERY TYPE (USD BILLION), 2020-2029
TABLE 48 ASIA-PACIFIC MICRO EVS MARKET BY BATTERY TYPE (THOUSAND UNITS), 2020-2029
TABLE 49 ASIA-PACIFIC MICRO EVS MARKET BY APPLICATION (USD BILLION), 2020-2029
TABLE 50 ASIA-PACIFIC MICRO EVS MARKET BY APPLICATION (THOUSAND UNITS), 2020-2029
TABLE 51 ASIA-PACIFIC MICRO EVS MARKET BY COUNTRY (USD BILLION), 2020-2029
TABLE 52 ASIA-PACIFIC MICRO EVS MARKET BY COUNTRY (THOUSAND UNITS), 2020-2029
TABLE 53 INDIA MICRO EVS MARKET BY BATTERY TYPE (USD BILLION), 2020-2029
TABLE 54 INDIA MICRO EVS MARKET BY BATTERY TYPE (THOUSAND UNITS), 2020-2029
TABLE 55 INDIA MICRO EVS MARKET BY APPLICATION (USD BILLION), 2020-2029
TABLE 56 INDIA MICRO EVS MARKET BY APPLICATION (THOUSAND UNITS), 2020-2029
TABLE 57 CHINA MICRO EVS MARKET BY BATTERY TYPE (USD BILLION), 2020-2029
TABLE 58 CHINA MICRO EVS MARKET BY BATTERY TYPE (THOUSAND UNITS), 2020-2029
TABLE 59 CHINA MICRO EVS MARKET BY APPLICATION (USD BILLION), 2020-2029
TABLE 60 CHINA MICRO EVS MARKET BY APPLICATION (THOUSAND UNITS), 2020-2029
TABLE 61 JAPAN MICRO EVS MARKET BY BATTERY TYPE (USD BILLION), 2020-2029
TABLE 62 JAPAN MICRO EVS MARKET BY BATTERY TYPE (THOUSAND UNITS), 2020-2029
TABLE 63 JAPAN MICRO EVS MARKET BY APPLICATION (USD BILLION), 2020-2029
TABLE 64 JAPAN MICRO EVS MARKET BY APPLICATION (THOUSAND UNITS), 2020-2029
TABLE 65 SOUTH KOREA MICRO EVS MARKET BY BATTERY TYPE (USD BILLION), 2020-2029
TABLE 66 SOUTH KOREA MICRO EVS MARKET BY BATTERY TYPE (THOUSAND UNITS), 2020-2029
TABLE 67 SOUTH KOREA MICRO EVS MARKET BY APPLICATION (USD BILLION), 2020-2029
TABLE 68 SOUTH KOREA MICRO EVS MARKET BY APPLICATION (THOUSAND UNITS), 2020-2029
TABLE 69 AUSTRALIA MICRO EVS MARKET BY BATTERY TYPE (USD BILLION), 2020-2029
TABLE 70 AUSTRALIA MICRO EVS MARKET BY BATTERY TYPE (THOUSAND UNITS), 2020-2029
TABLE 71 AUSTRALIA MICRO EVS MARKET BY APPLICATION (USD BILLION), 2020-2029
TABLE 72 AUSTRALIA MICRO EVS MARKET BY APPLICATION (THOUSAND UNITS), 2020-2029
TABLE 73 SOUTH EAST ASIA MICRO EVS MARKET BY BATTERY TYPE (USD BILLION), 2020-2029
TABLE 74 SOUTH EAST ASIA MICRO EVS MARKET BY BATTERY TYPE (THOUSAND UNITS), 2020-2029
TABLE 75 SOUTH EAST ASIA MICRO EVS MARKET BY APPLICATION (USD BILLION), 2020-2029
TABLE 76 SOUTH EAST ASIA MICRO EVS MARKET BY APPLICATION (THOUSAND UNITS), 2020-2029
TABLE 77 REST OF ASIA PACIFIC MICRO EVS MARKET BY BATTERY TYPE (USD BILLION), 2020-2029
TABLE 78 REST OF ASIA PACIFIC MICRO EVS MARKET BY BATTERY TYPE (THOUSAND UNITS), 2020-2029
TABLE 79 REST OF ASIA PACIFIC MICRO EVS MARKET BY APPLICATION (USD BILLION), 2020-2029
TABLE 80 REST OF ASIA PACIFIC MICRO EVS MARKET BY APPLICATION (THOUSAND UNITS), 2020-2029
TABLE 81 EUROPE MICRO EVS MARKET BY BATTERY TYPE (USD BILLION), 2020-2029
TABLE 82 EUROPE MICRO EVS MARKET BY BATTERY TYPE (THOUSAND UNITS), 2020-2029
TABLE 83 EUROPE MICRO EVS MARKET BY APPLICATION (USD BILLION), 2020-2029
TABLE 84 EUROPE MICRO EVS MARKET BY APPLICATION (THOUSAND UNITS), 2020-2029
TABLE 85 EUROPE MICRO EVS MARKET BY COUNTRY (USD BILLION), 2020-2029
TABLE 86 EUROPE MICRO EVS MARKET BY COUNTRY (THOUSAND UNITS), 2020-2029
TABLE 87 GERMANY MICRO EVS MARKET BY BATTERY TYPE (USD BILLION), 2020-2029
TABLE 88 GERMANY MICRO EVS MARKET BY BATTERY TYPE (THOUSAND UNITS), 2020-2029
TABLE 89 GERMANY MICRO EVS MARKET BY APPLICATION (USD BILLION), 2020-2029
TABLE 90 GERMANY MICRO EVS MARKET BY APPLICATION (THOUSAND UNITS), 2020-2029
TABLE 91 UK MICRO EVS MARKET BY BATTERY TYPE (USD BILLION), 2020-2029
TABLE 92 UK MICRO EVS MARKET BY BATTERY TYPE (THOUSAND UNITS), 2020-2029
TABLE 93 UK MICRO EVS MARKET BY APPLICATION (USD BILLION), 2020-2029
TABLE 94 UK MICRO EVS MARKET BY APPLICATION (THOUSAND UNITS), 2020-2029
TABLE 95 FRANCE MICRO EVS MARKET BY BATTERY TYPE (USD BILLION), 2020-2029
TABLE 96 FRANCE MICRO EVS MARKET BY BATTERY TYPE (THOUSAND UNITS), 2020-2029
TABLE 97 FRANCE MICRO EVS MARKET BY APPLICATION (USD BILLION), 2020-2029
TABLE 98 FRANCE MICRO EVS MARKET BY APPLICATION (THOUSAND UNITS), 2020-2029
TABLE 99 ITALY MICRO EVS MARKET BY BATTERY TYPE (USD BILLION), 2020-2029
TABLE 100 ITALY MICRO EVS MARKET BY BATTERY TYPE (THOUSAND UNITS), 2020-2029
TABLE 101 ITALY MICRO EVS MARKET BY APPLICATION (USD BILLION), 2020-2029
TABLE 102 ITALY MICRO EVS MARKET BY APPLICATION (THOUSAND UNITS), 2020-2029
TABLE 103 SPAIN MICRO EVS MARKET BY BATTERY TYPE (USD BILLION), 2020-2029
TABLE 104 SPAIN MICRO EVS MARKET BY BATTERY TYPE (THOUSAND UNITS), 2020-2029
TABLE 105 SPAIN MICRO EVS MARKET BY APPLICATION (USD BILLION), 2020-2029
TABLE 106 SPAIN MICRO EVS MARKET BY APPLICATION (THOUSAND UNITS), 2020-2029
TABLE 107 RUSSIA MICRO EVS MARKET BY BATTERY TYPE (USD BILLION), 2020-2029
TABLE 108 RUSSIA MICRO EVS MARKET BY BATTERY TYPE (THOUSAND UNITS), 2020-2029
TABLE 109 RUSSIA MICRO EVS MARKET BY APPLICATION (USD BILLION), 2020-2029
TABLE 110 RUSSIA MICRO EVS MARKET BY APPLICATION (THOUSAND UNITS), 2020-2029
TABLE 111 REST OF EUROPE MICRO EVS MARKET BY BATTERY TYPE (USD BILLION), 2020-2029
TABLE 112 REST OF EUROPE MICRO EVS MARKET BY BATTERY TYPE (THOUSAND UNITS), 2020-2029
TABLE 113 REST OF EUROPE MICRO EVS MARKET BY APPLICATION (USD BILLION), 2020-2029
TABLE 114 REST OF EUROPE MICRO EVS MARKET BY APPLICATION (THOUSAND UNITS), 2020-2029
TABLE 115 MIDDLE EAST AND AFRICA MICRO EVS MARKET BY BATTERY TYPE (USD BILLION), 2020-2029
TABLE 116 MIDDLE EAST AND AFRICA MICRO EVS MARKET BY BATTERY TYPE (THOUSAND UNITS), 2020-2029
TABLE 117 MIDDLE EAST AND AFRICA MICRO EVS MARKET BY APPLICATION (USD BILLION), 2020-2029
TABLE 118 MIDDLE EAST AND AFRICA MICRO EVS MARKET BY APPLICATION (THOUSAND UNITS), 2020-2029
TABLE 119 MIDDLE EAST AND AFRICA MICRO EVS MARKET BY COUNTRY (USD BILLION), 2020-2029
TABLE 120 MIDDLE EAST AND AFRICA MICRO EVS MARKET BY COUNTRY (THOUSAND UNITS), 2020-2029
TABLE 121 UAE MICRO EVS MARKET BY BATTERY TYPE (USD BILLION), 2020-2029
TABLE 122 UAE MICRO EVS MARKET BY BATTERY TYPE (THOUSAND UNITS), 2020-2029
TABLE 123 UAE MICRO EVS MARKET BY APPLICATION (USD BILLION), 2020-2029
TABLE 124 UAE MICRO EVS MARKET BY APPLICATION (THOUSAND UNITS), 2020-2029
TABLE 125 SAUDI ARABIA MICRO EVS MARKET BY BATTERY TYPE (USD BILLION), 2020-2029
TABLE 126 SAUDI ARABIA MICRO EVS MARKET BY BATTERY TYPE (THOUSAND UNITS), 2020-2029
TABLE 127 SAUDI ARABIA MICRO EVS MARKET BY APPLICATION (USD BILLION), 2020-2029
TABLE 128 SAUDI ARABIA MICRO EVS MARKET BY APPLICATION (THOUSAND UNITS), 2020-2029
TABLE 129 SOUTH AFRICA MICRO EVS MARKET BY BATTERY TYPE (USD BILLION), 2020-2029
TABLE 130 SOUTH AFRICA MICRO EVS MARKET BY BATTERY TYPE (THOUSAND UNITS), 2020-2029
TABLE 131 SOUTH AFRICA MICRO EVS MARKET BY APPLICATION (USD BILLION), 2020-2029
TABLE 132 SOUTH AFRICA MICRO EVS MARKET BY APPLICATION (THOUSAND UNITS), 2020-2029
TABLE 133 REST OF MIDDLE EAST AND AFRICA MICRO EVS MARKET BY BATTERY TYPE (USD BILLION), 2020-2029
TABLE 134 REST OF MIDDLE EAST AND AFRICA MICRO EVS MARKET BY BATTERY TYPE (THOUSAND UNITS), 2020-2029
TABLE 135 REST OF MIDDLE EAST AND AFRICA MICRO EVS MARKET BY APPLICATION (USD BILLION), 2020-2029
TABLE 136 REST OF MIDDLE EAST AND AFRICA MICRO EVS MARKET BY APPLICATION (THOUSAND UNITS), 2020-2029
LIST OF FIGURES
FIGURE 1 MARKET DYNAMICS
FIGURE 2 MARKET SEGMENTATION
FIGURE 3 REPORT TIMELINES: YEARS CONSIDERED
FIGURE 4 DATA TRIANGULATION
FIGURE 5 BOTTOM-UP APPROACH
FIGURE 6 TOP-DOWN APPROACH
FIGURE 7 RESEARCH FLOW
FIGURE 8 GLOBAL MICRO EVS MARKET BY BATTERY TYPE, USD BILLION, 2020-2029
FIGURE 9 GLOBAL MICRO EVS MARKET BY APPLICATION, USD BILLION, 2020-2029
FIGURE 10 GLOBAL MICRO EVS MARKET BY REGION, USD BILLION, 2020-2029
FIGURE 11 PORTER’S FIVE FORCES MODEL
FIGURE 12 GLOBAL MICRO EVS MARKET BY BATTERY TYPE, USD BILLION, 2021
FIGURE 13 GLOBAL MICRO EVS MARKET BY APPLICATION, USD BILLION, 2021
FIGURE 14 GLOBAL MICRO EVS MARKET BY REGION, USD BILLION, 2021
FIGURE 15 MARKET SHARE ANALYSIS
FIGURE 16 ALTA ZERO EMISSIONS SOLUTIONS INC.: COMPANY SNAPSHOT
FIGURE 17 AYRO INC.: COMPANY SNAPSHOT
FIGURE 18 BAYERISCHE MOTOREN WERKE AG: COMPANY SNAPSHOT
FIGURE 19 BINTELLI ELECTRIC VEHICLES: COMPANY SNAPSHOT
FIGURE 20 BYD ELECTRONIC CO. LTD.: COMPANY SNAPSHOT
FIGURE 21 ELECTRAMECCANICA VEHICLES CORP.: COMPANY SNAPSHOT
FIGURE 22 ELIO MOTORS INC.: COMPANY SNAPSHOT
FIGURE 23 G H VARLEY PTY LTD.: COMPANY SNAPSHOT
FIGURE 24 HYUNDAI MOTOR CO.: COMPANY SNAPSHOT
FIGURE 25 CLUB CAR: COMPANY SNAPSHOT
DOWNLOAD FREE SAMPLE REPORT
License Type
SPEAK WITH OUR ANALYST
Want to know more about the report or any specific requirement?
WANT TO CUSTOMIZE THE REPORT?
Our Clients Speak
We asked them to research ‘ Equipment market’ all over the world, and their whole arrangement was helpful to us. thehealthanalytics.com insightful analysis and reports contributed to our current analysis and in creating a future strategy. Besides, the te
Yosuke Mitsui
Senior Associate Construction Equipment Sales & Marketing
We asked them to research ‘Equipment market’ all over the world, and their whole arrangement was helpful to us. thehealthanalytics.com insightful analysis and reports contributed to our current analysis and in creating a future strategy. Besides, the te


