

Base Year Value ()
x.x %
x.x %
CAGR ()
x.x %
x.x %
Forecast Year Value ()
x.x %
x.x %
Historical Data Period
Largest Region
Forecast Period
Mercato delle navi per il rifornimento di GNL per tipo (camion-nave, porto-nave, nave-nave e cisterne mobili), tipo di nave (traghetti, navi da crociera, flotte di merci alla rinfusa e merci varie, navi di supporto offshore) e settore di utilizzo finale (flotta di petroliere, flotta di container, flotta di merci varie, traghetti e OSV) e regione, tendenze globali e previsioni dal 2022 al 2029.
Instant access to hundreds of data points and trends
- Market estimates from 2014-2029
- Competitive analysis, industry segmentation, financial benchmarks
- Incorporates SWOT, Porter's Five Forces and risk management frameworks
- PDF report or online database with Word, Excel and PowerPoint export options
- 100% money back guarantee
Panoramica - Mercato delle navi per il rifornimento di GNL
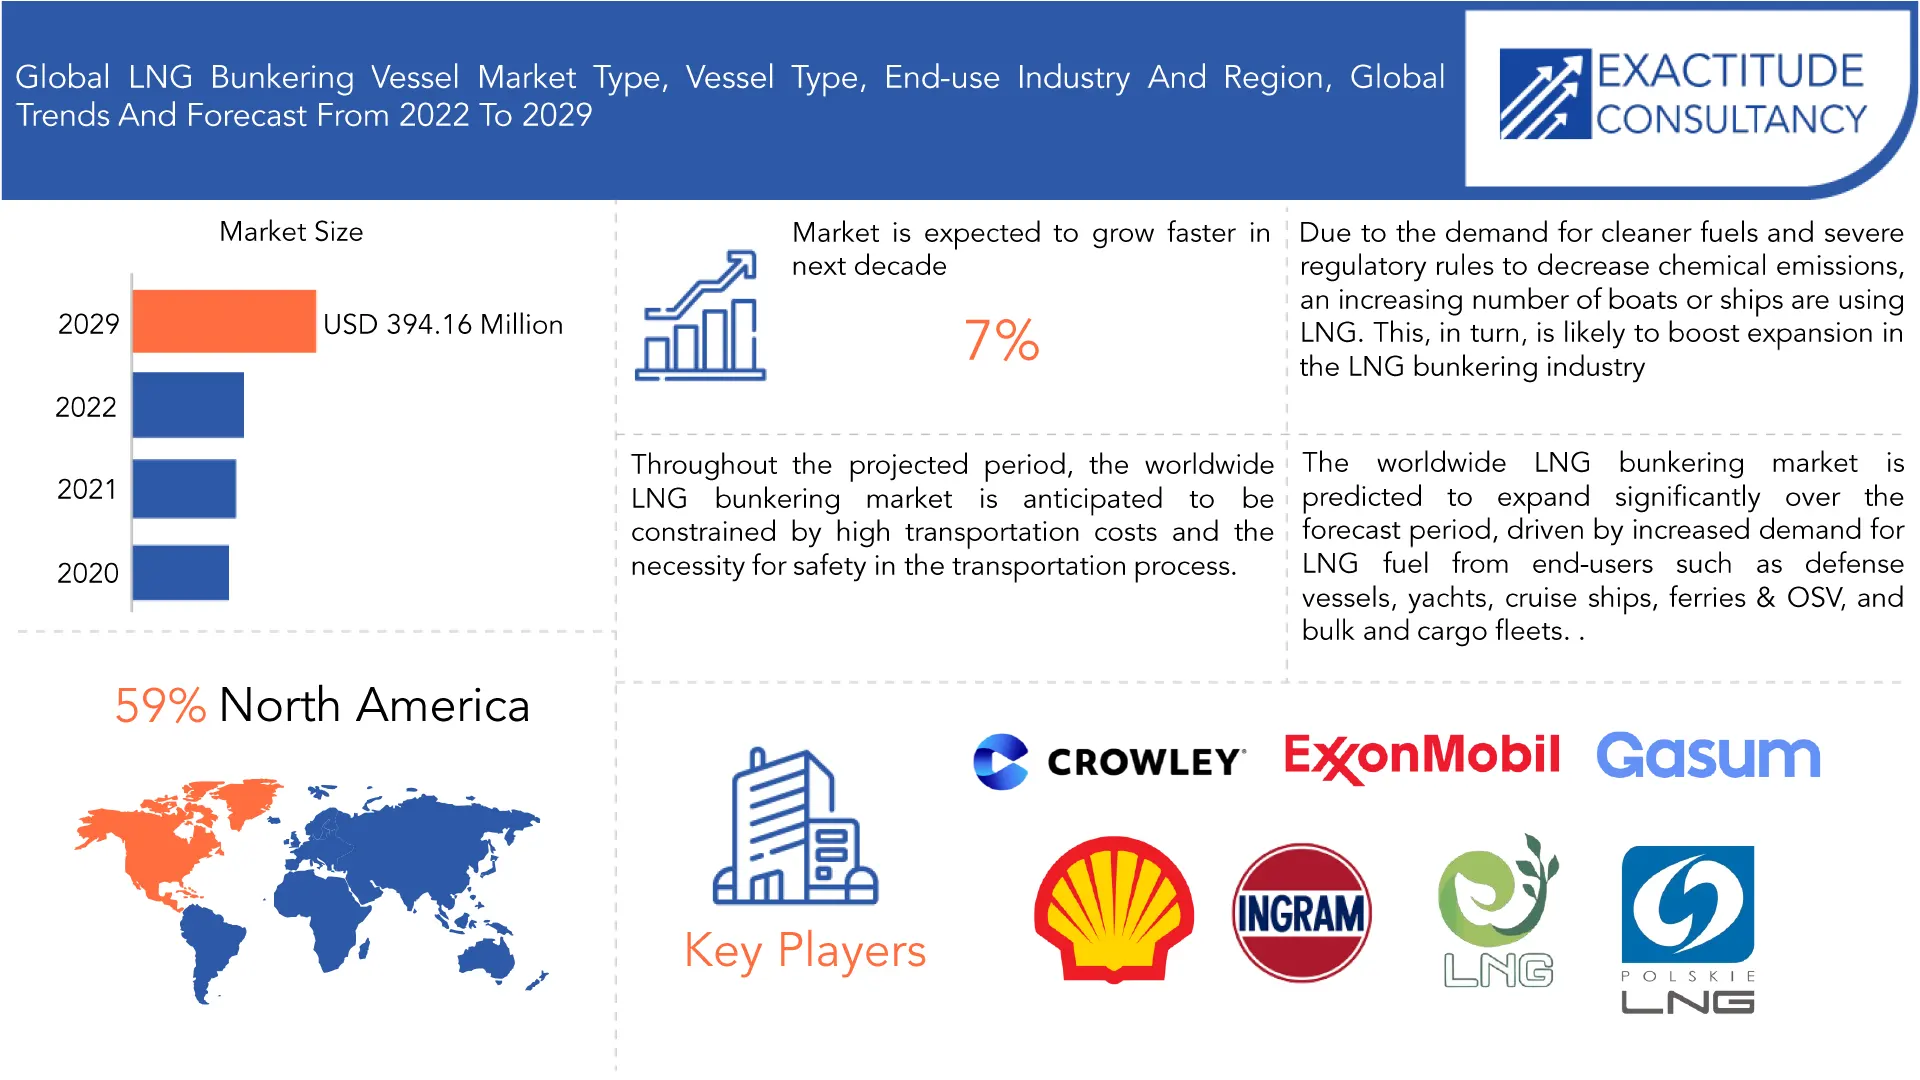
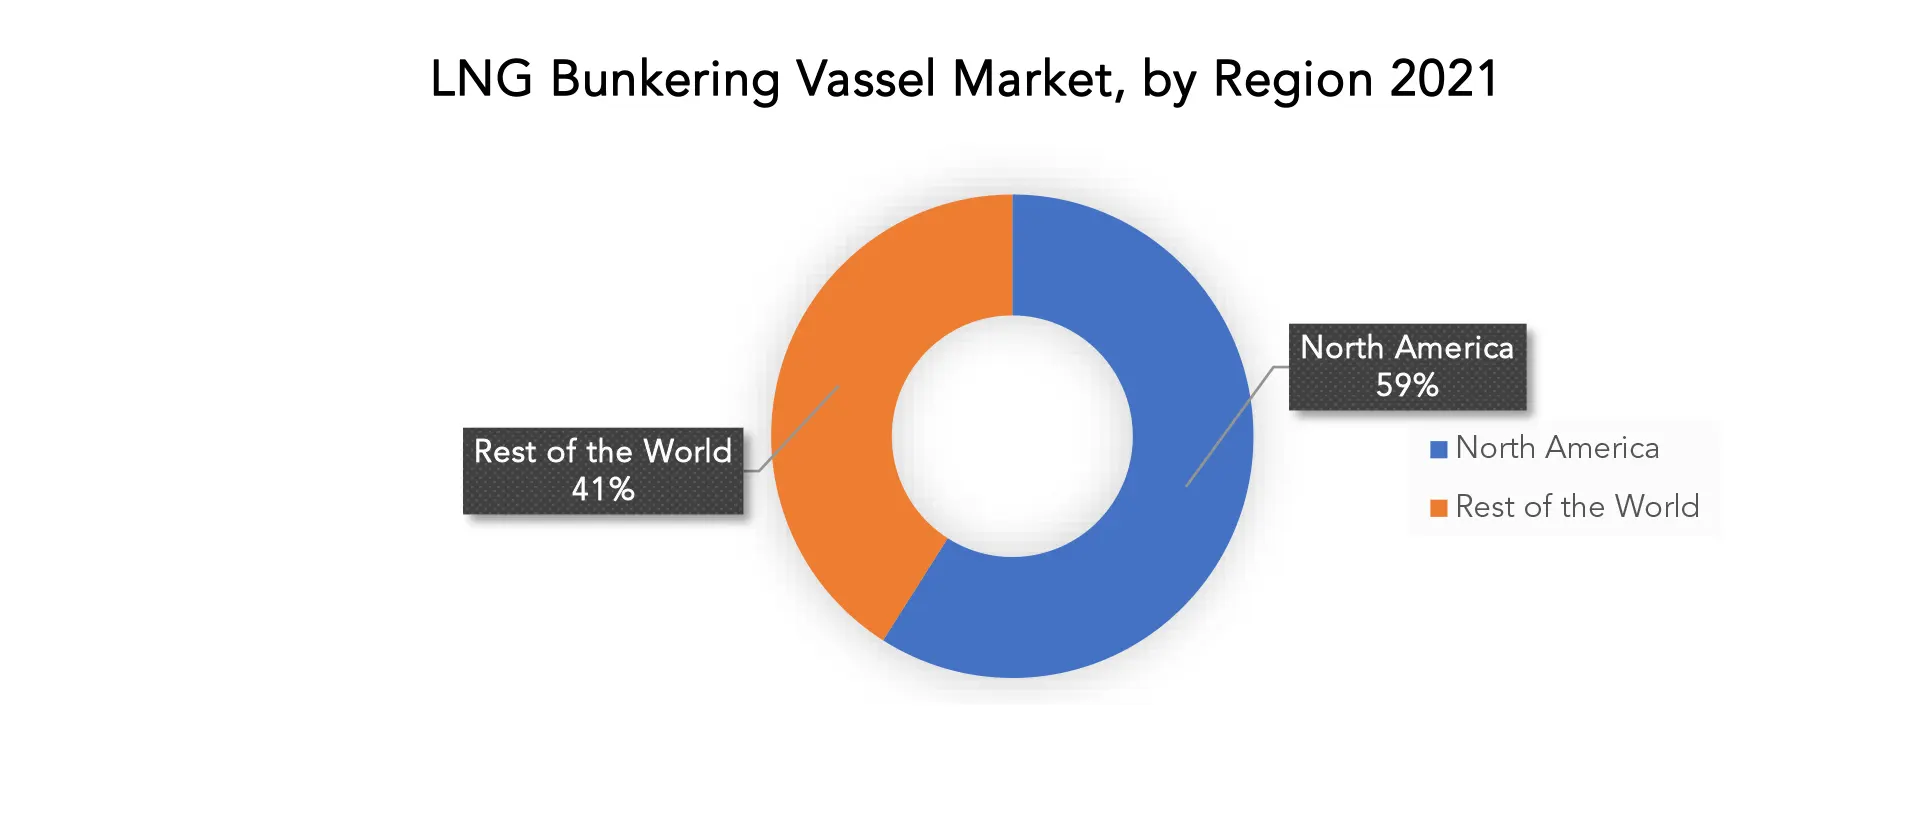
Si prevede che il mercato globale delle navi per il rifornimento di GNL crescerà al 7% di CAGR dal 2022 al 2029. Si prevede che raggiungerà oltre 394,16 milioni di USD entro il 2029 dai 245,46 milioni di USD del 2022.
Il trasferimento di GNL su una nave per il suo utilizzo è una pratica nota come rifornimento di GNL. Meno emissioni di spedizione , costi operativi e di carico più bassi, sicurezza, non tossicità e altri vantaggi sono alcuni dei vantaggi dell'utilizzo del GNL come combustibile marino nel settore delle spedizioni. Il principale motore dell'espansione nel settore del trasporto navale sarà probabilmente la rigida legislazione ambientale relativa all'inquinamento creato dalle navi. Le principali forze alla base dell'espansione del settore mondiale del rifornimento di GNL sono la restrizione IMO sul contenuto di zolfo nel combustibile marino e l'aumento delle operazioni di esplorazione e produzione di gas. Tuttavia, il problema principale che impedisce l'espansione del settore mondiale è lo squilibrio tra domanda e offerta nel rifornimento di GNL. Si prevede che si presenteranno opportunità nel mercato mondiale man mano che aumenta l'interesse per il GNL come combustibile marittimo alternativo. [caption id="allegato_27716" align="aligncenter" width="1920"]
| ATTRIBUTO | DETTAGLI |
| Periodo di studio | 2022-2029 |
| Anno base | 2021 |
| Anno stimato | 2022 |
| Anno previsto | 2022-2029 |
| Periodo storico | 2018-2022 |
| Unità | Valore (milioni di USD), (migliaia di unità) |
| Segmentazione | Per tipo, tipo di imbarcazione, settore dell'utente finale e regione. |
| Per tipo |
|
| Per materiale |
|
| Per settore dell'utente finale |
|
| Per regione |
|
Frequently Asked Questions
• What is the worth of the global LNG bunkering vessel market?
The global LNG bunkering vessel market is expected to grow at 7% CAGR from 2022 to 2029. It is expected to reach above USD 394.16 million by 2029 from USD 245.46 million in 2022.
• What are some of the market's driving forces?
The main driver of expansion in the ship transportation industry is likely to be strict environmental legislation regarding pollution created by ships. The main forces behind the expansion of the worldwide LNG bunkering industry are the IMO restriction on sulfur content in marine fuel and the rise in gas exploration and production operations.
• Which are the top companies to hold the market share in the LNG bunkering vessel market?
The LNG bunkering vessel market’s key players include Crowley Maritime Corporation, Exxon Mobil Corporation, Gasum Oy, Harvey Gulf International Marine, Klaw LNG, Korea Gas Corporation, Petroleum Nasional Berhad (Petronas), Polskie LNG S.A., Royal Dutch Shell, Royal Dutch Shell, Royal Dutch Shell, Total SE, PLC, SHV Energy.
• What is the leading Application of the LNG bunkering vessel market?
Transferring LNG to a ship for its use is a practice known as LNG bunkering. Less shipping emissions, cheaper operation & cargo costs, safety, non-toxic, and other benefits are some of the benefits of utilizing LNG as a marine fuel in the shipping sector.
• Which is the largest regional market for LNG bunkering vessel market?
The Market’s largest share is in the North American region.
Segment Analysis-LNG Bunkering Vessel Market
The product type, application, and geographic segments are used to divide the worldwide LNG bunkering market. The report emphasizes many LNG bunkering product varieties that are offered on the market, including truck-to-ship, port-to-ship, ship-to-ship, and portable tanks. The study's many uses of LNG bunkering, such as those for the container, tankers, cargo, ferries, etc., are also highlighted. Among other inland watercraft. Ship-to-ship had the biggest market share of roughly 60.5% in 2019 and is predicted to retain its dominance throughout the projection period. This is linked to an increase in the number of ships utilizing LNG owing to the demand for cleaner fuel to comply with severe government rules aimed at reducing air pollution and preserving sustainability. Furthermore, as for the benefits. The ship-to-ship LNG bunkering market is predicted to have significant revenue growth throughout the projection period due to factors such as quick transfer operations and a high capacity of 700-7,500 tons. The market is divided into four segments based on end-user: tanker fleet, bulk & general cargo, offshore support vessels & ferries, and others. As of the recent expansion in offshore production operations, the offshore support boats and ferries category enjoys a large market share. years. Exploration activities are being conducted at greater depths and in harsher conditions, which will increase demand for LNG Bunkering. In addition, with a concentration on offshore production at deeper depths, the usage of FPSO (floating production storage and offloading) units has expanded in recent years. [caption id="attachment_27748" align="aligncenter" width="1920"]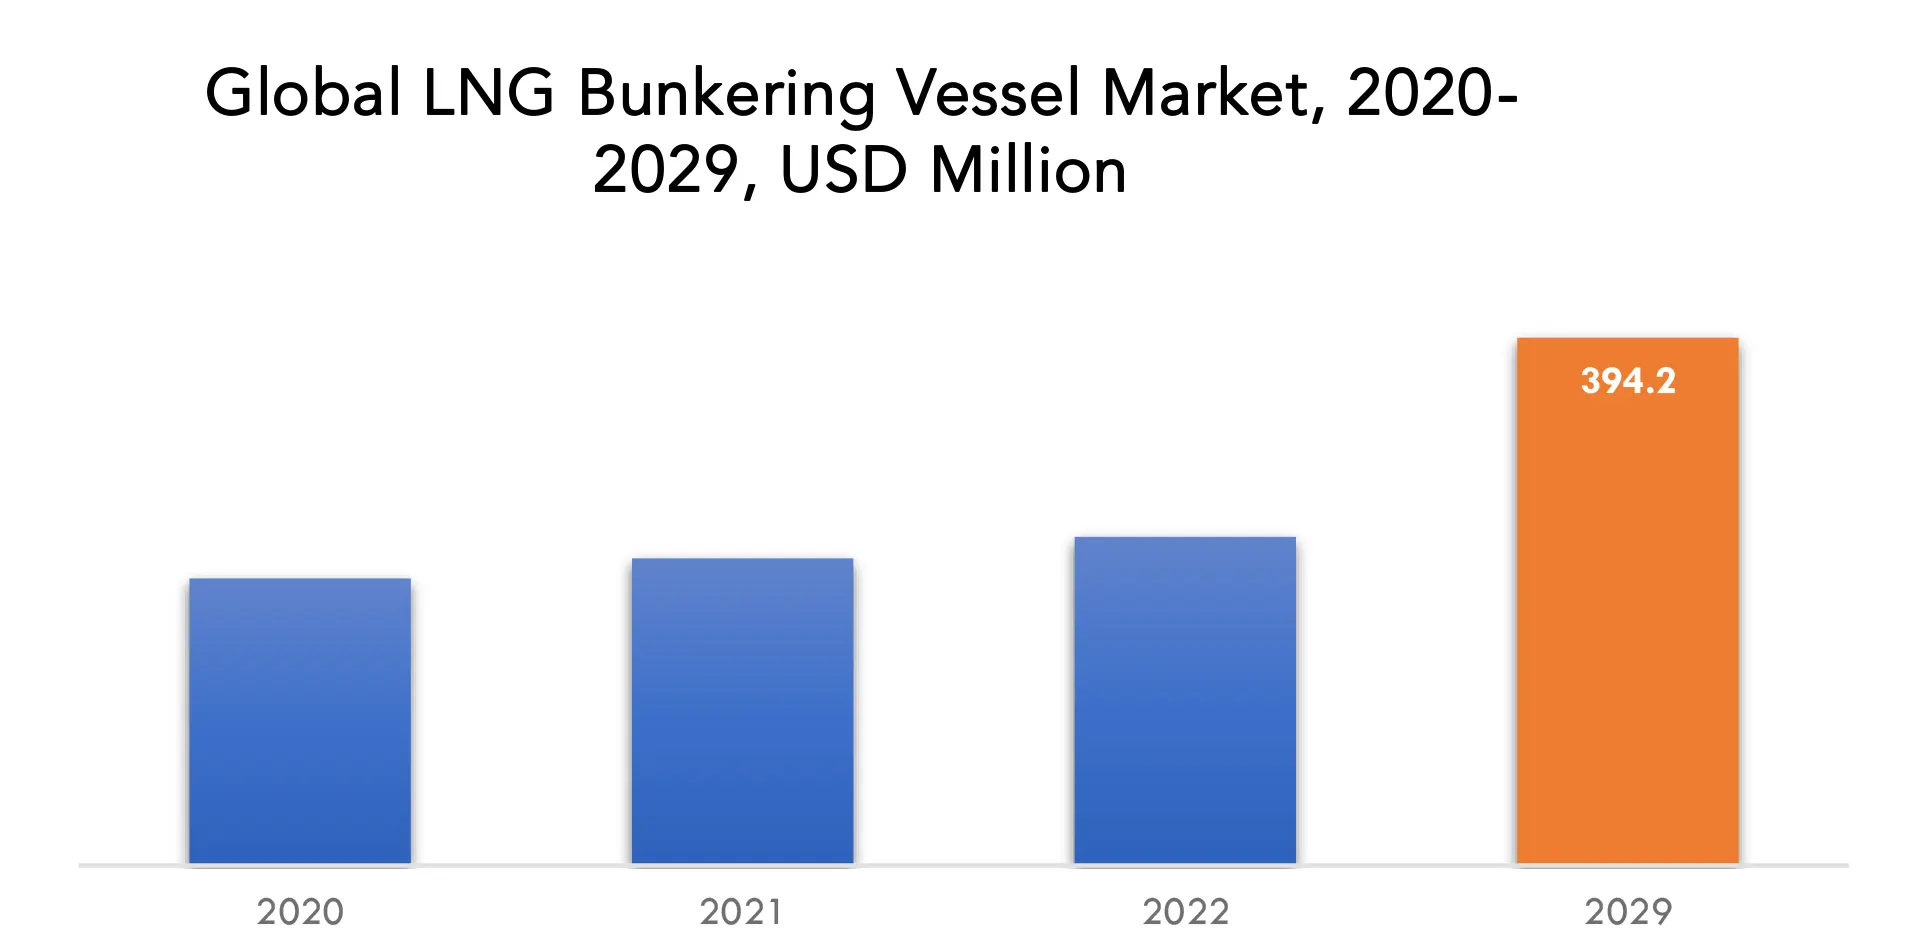
Market Players-LNG Bunkering Vessel Market
The LNG bunkering vessel market’s key players include Crowley Maritime Corporation, Exxon Mobil Corporation, Gasum Oy, Harvey Gulf International Marine, Klaw LNG, Korea Gas Corporation, Petroleum Nasional Berhad (Petronas), Polskie LNG S.A., Royal Dutch Shell, Total SE, PLC, SHV Energy. For corporate expansion, these key leaders are implementing strategic formulations such as new product development and commercialization, commercial expansion, and distribution agreements. Moreover, these participants are substantially spending on product development, which is fueling revenue generation. Recent Developments:- December 2021 - Crowley had been committed to achieving net-zero carbon gas emissions in all areas by 2050, following a path consistent with the most recent climate science to prevent global warming to 1.5 degrees Celsius.
- April 2023 - Crowley invested in REPOWR to accelerate supply chain sustainability. A platform for asset sharing and a network optimization solution will help logistics providers.
- April 2023 - Crowley's First Innovation Expo Nurtures Next-Generation Ideas was to Support Successful Ventures.
Who Should Buy? Or Key stakeholders
- Investors
- Food and Beverage industry
- Medical Technology Companies
- Healthcare and personal care firms
- Research Organizations
- Regulatory Authorities
- Institutional & retail players
- Others
Regional Analysis-LNG Bunkering Vessel Market
The LNG bunking vessel market by region includes North America, Asia-Pacific (APAC), Europe, South America, and Middle East & Africa (MEA).- North America: includes the US, Canada, Mexico
- Asia Pacific: includes China, Japan, South Korea, India, Australia, ASEAN, and Rest of APAC
- Europe: includes the UK, Germany, France, Italy, Spain, Russia, and the Rest of Europe
- South America: includes Brazil, Argentina, and Rest of South America
- Middle East & Africa: includes Turkey, UAE, Saudi Arabia, South Africa, and the Rest of MEA
Key Market Segments: LNG Bunkering Vessel Market
LNG BUNKERING VESSEL MARKET BY TYPE, 2020-2029, (USD MILLION), (THOUSAND UNITS)- TRUCK-TO-SHIP
- SHIP-TO-SHIP
- PORTABLE TANKS
- FERRIES
- CRUISE-SHIP
- GENERAL CARGO FLEET
- OFFSHORE VESSELS
- TANKER FLEET
- CONTAINER FLEET
- GENERAL CARGO FLEET
- OSV
- NORTH AMERICA
- ASIA PACIFIC
- EUROPE
- SOUTH AMERICA
- MIDDLE EAST AND AFRICA
Exactitude Consultancy Services Key Objectives:
- Increasing sales and market share
- Developing new technology
- Improving profitability
- Entering new markets
- Enhancing brand reputation
Key Question Answered
- What is the expected growth rate of the LNG bunkering vessel market over the next 7 years?
- What are the end-user industries driving demand for the market and what is their outlook?
- What are the opportunities for growth in emerging markets such as Asia-Pacific, the Middle East, and Africa?
- How is the economic environment affecting the LNG bunkering vessel market, including factors such as interest rates, inflation, and exchange rates?
- What is the expected impact of government policies and regulations on the LNG bunkering vessel market?
- What are the key drivers of growth in the LNG bunkering vessel market?
- Who are the market’s major players, and what is their market share?
- What are the LNG bunkering vessel market's distribution channels and supply chain dynamics?
- What are the technological advancements and innovations in the LNG bunkering vessel market and their impact on product development and growth?
- What are the regulatory considerations and their impact on the market?
- What are the challenges faced by players in the LNG bunkering vessel market and how are they addressing these challenges?
- What are the opportunities for growth and expansion in the LNG bunkering vessel market?
- What are the market's product offerings/ service offerings and specifications of leading players?
- What is the pricing trend of LNG bunkering vessels in the market and what is the impact of raw material prices on the price trend?
- INTRODUZIONE
- DEFINIZIONE DI MERCATO
- SEGMENTAZIONE DEL MERCATO
- TEMPI DI RICERCA
- ASSUNZIONI E LIMITAZIONI
- METODOLOGIA DI RICERCA
- ESTRAZIONE DATI
- RICERCA SECONDARIA
- RICERCA PRIMARIA
- PARERI DEGLI ESPERTI IN MATERIA
- CONTROLLI DI QUALITÀ
- RECENSIONE FINALE
- TRIANGOLAZIONE DEI DATI
- APPROCCIO DAL BASSO VERSO L'ALTO
- APPROCCIO TOP-DOWN
- FLUSSO DI RICERCA
- FONTI DEI DATI
- ESTRAZIONE DATI
- SINTESI
- PANORAMICA DEL MERCATO
- PROSPETTIVE DEL MERCATO GLOBALE DELLE NAVI PER IL BUNKERAGGIO DI GNL
- FATTORI DI MERCATO
- LIMITAZIONI DI MERCATO
- OPPORTUNITÀ DI MERCATO
- IMPATTO DEL COVID-19 SUL MERCATO DELLE NAVI PER IL BUNKERAGGIO DI GNL
- MODELLO DELLE CINQUE FORZE DI PORTER
- MINACCIA DAI NUOVI ENTRANSI
- MINACCIA DA SOSTITUTI
- POTERE CONTRATTUALE DEI FORNITORI
- POTERE CONTRATTUALE DEI CLIENTI
- GRADO DI COMPETIZIONE
- ANALISI DELLA CATENA DEL VALORE DEL SETTORE
- PROSPETTIVE DEL MERCATO GLOBALE DELLE NAVI PER IL BUNKERAGGIO DI GNL
- MERCATO GLOBALE DELLE NAVI PER IL BUNKERAGGIO DI GNL PER TIPOLOGIA, 2020-2029, (MILIONI DI USD), (MIGLIAIA DI UNITÀ)
- DAL CAMION ALLA NAVE
- DA SPEDIZIONE A SPEDIZIONE
- SERBATOI PORTATILI
- MERCATO GLOBALE DELLE NAVI PER IL BUNKERAGGIO DI GNL PER MATERIALE PER TIPO DI NAVE, 2020-2029, (MILIONI DI USD), (MIGLIAIA DI UNITÀ)
- TRAGHETTI
- NAVE DA CROCIERA
- GENERAL CARGO FLEET
- OFFSHORE VESSELS
- GLOBAL LNG BUNKERING VESSEL MARKET BY END-USER INDUSTRY, 2020-2029, (USD MILLION), (THOUSAND UNITS)
- TANKER FLEET
- CONTAINER FLEET
- GENERAL CARGO FLEET
- OSV
- GLOBAL LNG BUNKERING VESSEL MARKET BY REGION, 2020-2029, (USD MILLION), (THOUSAND UNITS)
- NORTH AMERICA
- US
- CANADA
- MEXICO
- SOUTH AMERICA
- BRAZIL
- ARGENTINA
- COLOMBIA
- REST OF SOUTH AMERICA
- EUROPE
- GERMANY
- UK
- FRANCE
- ITALY
- SPAIN
- RUSSIA
- REST OF EUROPE
- ASIA PACIFIC
- INDIA
- CHINA
- JAPAN
- SOUTH KOREA
- AUSTRALIA
- SOUTH-EAST ASIA
- REST OF ASIA PACIFIC
- MIDDLE EAST AND AFRICA
- UAE
- SAUDI ARABIA
- SOUTH AFRICA
- REST OF MIDDLE EAST AND AFRICA
- NORTH AMERICA
- COMPANY PROFILES*
(BUSINESS OVERVIEW, COMPANY SNAPSHOT, PRODUCTS OFFERED, RECENT DEVELOPMENTS)
- CROWLEY MARITIME CORPORATION
- EXXON MOBIL CORPORATION
- GASUM OY
- HARVEY GULF INTERNATIONAL MARINE
- KLAW LNG
- KOREA GAS CORPORATION
- KOREA GAS CORPORATION
- POLSKIE LNG S.A
- ROYAL DUTCH SHELL
- TOTAL SE
- PLC
- SHV ENERGY
*THE COMPANY LIST IS INDICATIVE
LIST OF TABLES
TABLE 1 GLOBAL LNG BUNKERING VESSEL MARKET BY TYPE (USD MILLION) 2020-2029
TABLE 2 GLOBAL LNG BUNKERING VESSEL MARKET BY TYPE (THOUSAND UNITS) 2020-2029
TABLE 3 GLOBAL LNG BUNKERING VESSEL MARKET BY VESSEL TYPE (USD MILLION) 2020-2029
TABLE 4 GLOBAL LNG BUNKERING VESSEL MARKET BY VESSEL TYPE (THOUSAND UNITS) 2020-2029
TABLE 5 GLOBAL LNG BUNKERING VESSEL MARKET BY END USER (USD MILLION) 2020-2029
TABLE 6 GLOBAL LNG BUNKERING VESSEL MARKET BY END USER (THOUSAND UNITS) 2020-2029
TABLE 7 GLOBAL LNG BUNKERING VESSEL MARKET BY REGION (USD MILLION) 2020-2029
TABLE 8 GLOBAL LNG BUNKERING VESSEL MARKET BY REGION (THOUSAND UNITS) 2020-2029
TABLE 9 NORTH AMERICA LNG BUNKERING VESSEL MARKET BY COUNTRY (USD MILLION) 2020-2029
TABLE 10 NORTH AMERICA LNG BUNKERING VESSEL MARKET BY COUNTRY (THOUSAND UNITS) 2020-2029
TABLE 11 NORTH AMERICA LNG BUNKERING VESSEL MARKET BY TYPE (USD MILLION) 2020-2029
TABLE 12 NORTH AMERICA LNG BUNKERING VESSEL MARKET BY TYPE (THOUSAND UNITS) 2020-2029
TABLE 13 NORTH AMERICA LNG BUNKERING VESSEL MARKET BY VESSEL TYPE (USD MILLION) 2020-2029
TABLE 14 NORTH AMERICA LNG BUNKERING VESSEL MARKET BY VESSEL TYPE (THOUSAND UNITS) 2020-2029
TABLE 15 NORTH AMERICA LNG BUNKERING VESSEL MARKET BY END USER (USD MILLION) 2020-2029
TABLE 16 NORTH AMERICA LNG BUNKERING VESSEL MARKET BY END USER (THOUSAND UNITS) 2020-2029
TABLE 17 US LNG BUNKERING VESSEL MARKET BY TYPE (USD MILLION) 2020-2029
TABLE 18 US LNG BUNKERING VESSEL MARKET BY TYPE (THOUSAND UNITS) 2020-2029
TABLE 19 US LNG BUNKERING VESSEL MARKET BY VESSEL TYPE (USD MILLION) 2020-2029
TABLE 20 US LNG BUNKERING VESSEL MARKET BY VESSEL TYPE (THOUSAND UNITS) 2020-2029
TABLE 21 US LNG BUNKERING VESSEL MARKET BY END USER (USD MILLION) 2020-2029
TABLE 22 US LNG BUNKERING VESSEL MARKET BY END USER (THOUSAND UNITS) 2020-2029
TABLE 23 CANADA LNG BUNKERING VESSEL MARKET BY TYPE (USD MILLION) 2020-2029
TABLE 24 CANADA LNG BUNKERING VESSEL MARKET BY TYPE (THOUSAND UNITS) 2020-2029
TABLE 25 CANADA LNG BUNKERING VESSEL MARKET BY VESSEL TYPE (USD MILLION) 2020-2029
TABLE 26 CANADA LNG BUNKERING VESSEL MARKET BY VESSEL TYPE (THOUSAND UNITS) 2020-2029
TABLE 27 CANADA LNG BUNKERING VESSEL MARKET BY END USER (USD MILLION) 2020-2029
TABLE 28 CANADA LNG BUNKERING VESSEL MARKET BY END USER (THOUSAND UNITS) 2020-2029
TABLE 29 MEXICO LNG BUNKERING VESSEL MARKET BY TYPE (USD MILLION) 2020-2029
TABLE 30 MEXICO LNG BUNKERING VESSEL MARKET BY TYPE (THOUSAND UNITS) 2020-2029
TABLE 31 MEXICO LNG BUNKERING VESSEL MARKET BY VESSEL TYPE (USD MILLION) 2020-2029
TABLE 32 MEXICO LNG BUNKERING VESSEL MARKET BY VESSEL TYPE (THOUSAND UNITS) 2020-2029
TABLE 33 MEXICO LNG BUNKERING VESSEL MARKET BY END USER (USD MILLION) 2020-2029
TABLE 34 MEXICO LNG BUNKERING VESSEL MARKET BY END USER (THOUSAND UNITS) 2020-2029
TABLE 35 SOUTH AMERICA LNG BUNKERING VESSEL MARKET BY COUNTRY (USD MILLION) 2020-2029
TABLE 36 SOUTH AMERICA LNG BUNKERING VESSEL MARKET BY COUNTRY (THOUSAND UNITS) 2020-2029
TABLE 37 SOUTH AMERICA LNG BUNKERING VESSEL MARKET BY TYPE (USD MILLION) 2020-2029
TABLE 38 SOUTH AMERICA LNG BUNKERING VESSEL MARKET BY TYPE (THOUSAND UNITS) 2020-2029
TABLE 39 SOUTH AMERICA LNG BUNKERING VESSEL MARKET BY VESSEL TYPE (USD MILLION) 2020-2029
TABLE 40 SOUTH AMERICA LNG BUNKERING VESSEL MARKET BY VESSEL TYPE (THOUSAND UNITS) 2020-2029
TABLE 41 SOUTH AMERICA LNG BUNKERING VESSEL MARKET BY END USER (USD MILLION) 2020-2029
TABLE 42 SOUTH AMERICA LNG BUNKERING VESSEL MARKET BY END USER (THOUSAND UNITS) 2020-2029
TABLE 43 BRAZIL LNG BUNKERING VESSEL MARKET BY TYPE (USD MILLION) 2020-2029
TABLE 44 BRAZIL LNG BUNKERING VESSEL MARKET BY TYPE (THOUSAND UNITS) 2020-2029
TABLE 45 BRAZIL LNG BUNKERING VESSEL MARKET BY VESSEL TYPE (USD MILLION) 2020-2029
TABLE 46 BRAZIL LNG BUNKERING VESSEL MARKET BY VESSEL TYPE (THOUSAND UNITS) 2020-2029
TABLE 47 BRAZIL LNG BUNKERING VESSEL MARKET BY END USER (USD MILLION) 2020-2029
TABLE 48 BRAZIL LNG BUNKERING VESSEL MARKET BY END USER (THOUSAND UNITS) 2020-2029
TABLE 49 ARGENTINA LNG BUNKERING VESSEL MARKET BY TYPE (USD MILLION) 2020-2029
TABLE 50 ARGENTINA LNG BUNKERING VESSEL MARKET BY TYPE (THOUSAND UNITS) 2020-2029
TABLE 51 ARGENTINA LNG BUNKERING VESSEL MARKET BY VESSEL TYPE (USD MILLION) 2020-2029
TABLE 52 ARGENTINA LNG BUNKERING VESSEL MARKET BY VESSEL TYPE (THOUSAND UNITS) 2020-2029
TABLE 53 ARGENTINA LNG BUNKERING VESSEL MARKET BY END USER (USD MILLION) 2020-2029
TABLE 54 ARGENTINA LNG BUNKERING VESSEL MARKET BY END USER (THOUSAND UNITS) 2020-2029
TABLE 55 COLOMBIA LNG BUNKERING VESSEL MARKET BY TYPE (USD MILLION) 2020-2029
TABLE 56 COLOMBIA LNG BUNKERING VESSEL MARKET BY TYPE (THOUSAND UNITS) 2020-2029
TABLE 57 COLOMBIA LNG BUNKERING VESSEL MARKET BY VESSEL TYPE (USD MILLION) 2020-2029
TABLE 58 COLOMBIA LNG BUNKERING VESSEL MARKET BY VESSEL TYPE (THOUSAND UNITS) 2020-2029
TABLE 59 COLOMBIA LNG BUNKERING VESSEL MARKET BY END USER (USD MILLION) 2020-2029
TABLE 60 COLOMBIA LNG BUNKERING VESSEL MARKET BY END USER (THOUSAND UNITS) 2020-2029
TABLE 61 REST OF SOUTH AMERICA LNG BUNKERING VESSEL MARKET BY TYPE (USD MILLION) 2020-2029
TABLE 62 REST OF SOUTH AMERICA LNG BUNKERING VESSEL MARKET BY TYPE (THOUSAND UNITS) 2020-2029
TABLE 63 REST OF SOUTH AMERICA LNG BUNKERING VESSEL MARKET BY VESSEL TYPE (USD MILLION) 2020-2029
TABLE 64 REST OF SOUTH AMERICA LNG BUNKERING VESSEL MARKET BY VESSEL TYPE (THOUSAND UNITS) 2020-2029
TABLE 65 REST OF SOUTH AMERICA LNG BUNKERING VESSEL MARKET BY END USER (USD MILLION) 2020-2029
TABLE 66 REST OF SOUTH AMERICA LNG BUNKERING VESSEL MARKET BY END USER (THOUSAND UNITS) 2020-2029
TABLE 67 ASIA-PACIFIC LNG BUNKERING VESSEL MARKET BY COUNTRY (USD MILLION) 2020-2029
TABLE 68 ASIA-PACIFIC LNG BUNKERING VESSEL MARKET BY COUNTRY (THOUSAND UNITS) 2020-2029
TABLE 69 ASIA-PACIFIC LNG BUNKERING VESSEL MARKET BY TYPE (USD MILLION) 2020-2029
TABLE 70 ASIA-PACIFIC LNG BUNKERING VESSEL MARKET BY TYPE (THOUSAND UNITS) 2020-2029
TABLE 71 ASIA-PACIFIC LNG BUNKERING VESSEL MARKET BY VESSEL TYPE (USD MILLION) 2020-2029
TABLE 72 ASIA-PACIFIC LNG BUNKERING VESSEL MARKET BY VESSEL TYPE (THOUSAND UNITS) 2020-2029
TABLE 73 ASIA-PACIFIC LNG BUNKERING VESSEL MARKET BY END USER (USD MILLION) 2020-2029
TABLE 74 ASIA-PACIFIC LNG BUNKERING VESSEL MARKET BY END USER (THOUSAND UNITS) 2020-2029
TABLE 75 INDIA LNG BUNKERING VESSEL MARKET BY TYPE (USD MILLION) 2020-2029
TABLE 76 INDIA LNG BUNKERING VESSEL MARKET BY TYPE (THOUSAND UNITS) 2020-2029
TABLE 77 INDIA LNG BUNKERING VESSEL MARKET BY VESSEL TYPE (USD MILLION) 2020-2029
TABLE 78 INDIA LNG BUNKERING VESSEL MARKET BY VESSEL TYPE (THOUSAND UNITS) 2020-2029
TABLE 79 INDIA LNG BUNKERING VESSEL MARKET BY END USER (USD MILLION) 2020-2029
TABLE 80 INDIA LNG BUNKERING VESSEL MARKET BY END USER (THOUSAND UNITS) 2020-2029
TABLE 81 CHINA LNG BUNKERING VESSEL MARKET BY TYPE (USD MILLION) 2020-2029
TABLE 82 CHINA LNG BUNKERING VESSEL MARKET BY TYPE (THOUSAND UNITS) 2020-2029
TABLE 83 CHINA LNG BUNKERING VESSEL MARKET BY VESSEL TYPE (USD MILLION) 2020-2029
TABLE 84 CHINA LNG BUNKERING VESSEL MARKET BY VESSEL TYPE (THOUSAND UNITS) 2020-2029
TABLE 85 CHINA LNG BUNKERING VESSEL MARKET BY END USER (USD MILLION) 2020-2029
TABLE 86 CHINA LNG BUNKERING VESSEL MARKET BY END USER (THOUSAND UNITS) 2020-2029
TABLE 87 JAPAN LNG BUNKERING VESSEL MARKET BY TYPE (USD MILLION) 2020-2029
TABLE 88 JAPAN LNG BUNKERING VESSEL MARKET BY TYPE (THOUSAND UNITS) 2020-2029
TABLE 89 JAPAN LNG BUNKERING VESSEL MARKET BY VESSEL TYPE (USD MILLION) 2020-2029
TABLE 90 JAPAN LNG BUNKERING VESSEL MARKET BY VESSEL TYPE (THOUSAND UNITS) 2020-2029
TABLE 91 JAPAN LNG BUNKERING VESSEL MARKET BY END USER (USD MILLION) 2020-2029
TABLE 92 JAPAN LNG BUNKERING VESSEL MARKET BY END USER (THOUSAND UNITS) 2020-2029
TABLE 93 SOUTH KOREA LNG BUNKERING VESSEL MARKET BY TYPE (USD MILLION) 2020-2029
TABLE 94 SOUTH KOREA LNG BUNKERING VESSEL MARKET BY TYPE (THOUSAND UNITS) 2020-2029
TABLE 95 SOUTH KOREA LNG BUNKERING VESSEL MARKET BY VESSEL TYPE (USD MILLION) 2020-2029
TABLE 96 SOUTH KOREA LNG BUNKERING VESSEL MARKET BY VESSEL TYPE (THOUSAND UNITS) 2020-2029
TABLE 97 SOUTH KOREA LNG BUNKERING VESSEL MARKET BY END USER (USD MILLION) 2020-2029
TABLE 98 SOUTH KOREA LNG BUNKERING VESSEL MARKET BY END USER (THOUSAND UNITS) 2020-2029
TABLE 99 AUSTRALIA LNG BUNKERING VESSEL MARKET BY TYPE (USD MILLION) 2020-2029
TABLE 100 AUSTRALIA LNG BUNKERING VESSEL MARKET BY TYPE (THOUSAND UNITS) 2020-2029
TABLE 101 AUSTRALIA LNG BUNKERING VESSEL MARKET BY VESSEL TYPE (USD MILLION) 2020-2029
TABLE 102 AUSTRALIA LNG BUNKERING VESSEL MARKET BY VESSEL TYPE (THOUSAND UNITS) 2020-2029
TABLE 103 AUSTRALIA LNG BUNKERING VESSEL MARKET BY END USER (USD MILLION) 2020-2029
TABLE 104 AUSTRALIA LNG BUNKERING VESSEL MARKET BY END USER (THOUSAND UNITS) 2020-2029
TABLE 105 SOUTH-EAST ASIA LNG BUNKERING VESSEL MARKET BY TYPE (USD MILLION) 2020-2029
TABLE 106 SOUTH-EAST ASIA LNG BUNKERING VESSEL MARKET BY TYPE (THOUSAND UNITS) 2020-2029
TABLE 107 SOUTH-EAST ASIA LNG BUNKERING VESSEL MARKET BY VESSEL TYPE (USD MILLION) 2020-2029
TABLE 108 SOUTH-EAST ASIA LNG BUNKERING VESSEL MARKET BY VESSEL TYPE (THOUSAND UNITS) 2020-2029
TABLE 109 SOUTH-EAST ASIA LNG BUNKERING VESSEL MARKET BY END USER (USD MILLION) 2020-2029
TABLE 110 SOUTH-EAST ASIA LNG BUNKERING VESSEL MARKET BY END USER (THOUSAND UNITS) 2020-2029
TABLE 111 REST OF ASIA PACIFIC LNG BUNKERING VESSEL MARKET BY TYPE (USD MILLION) 2020-2029
TABLE 112 REST OF ASIA PACIFIC LNG BUNKERING VESSEL MARKET BY TYPE (THOUSAND UNITS) 2020-2029
TABLE 113 REST OF ASIA PACIFIC LNG BUNKERING VESSEL MARKET BY VESSEL TYPE (USD MILLION) 2020-2029
TABLE 114 REST OF ASIA PACIFIC LNG BUNKERING VESSEL MARKET BY VESSEL TYPE (THOUSAND UNITS) 2020-2029
TABLE 115 REST OF ASIA PACIFIC LNG BUNKERING VESSEL MARKET BY END USER (USD MILLION) 2020-2029
TABLE 116 REST OF ASIA PACIFIC LNG BUNKERING VESSEL MARKET BY END USER (THOUSAND UNITS) 2020-2029
TABLE 117 EUROPE LNG BUNKERING VESSEL MARKET BY COUNTRY (USD MILLION) 2020-2029
TABLE 118 EUROPEE LNG BUNKERING VESSEL MARKET BY COUNTRY (THOUSAND UNITS) 2020-2029
TABLE 119 EUROPE LNG BUNKERING VESSEL MARKET BY TYPE (USD MILLION) 2020-2029
TABLE 120 EUROPE LNG BUNKERING VESSEL MARKET BY TYPE (THOUSAND UNITS) 2020-2029
TABLE 121 EUROPE LNG BUNKERING VESSEL MARKET BY VESSEL TYPE (USD MILLION) 2020-2029
TABLE 122 EUROPE LNG BUNKERING VESSEL MARKET BY VESSEL TYPE (THOUSAND UNITS) 2020-2029
TABLE 123 EUROPE LNG BUNKERING VESSEL MARKET BY END USER (USD MILLION) 2020-2029
TABLE 124 EUROPE LNG BUNKERING VESSEL MARKET BY END USER (THOUSAND UNITS) 2020-2029
TABLE 125 GERMANY LNG BUNKERING VESSEL MARKET BY TYPE (USD MILLION) 2020-2029
TABLE 126 GERMANY LNG BUNKERING VESSEL MARKET BY TYPE (THOUSAND UNITS) 2020-2029
TABLE 127 GERMANY LNG BUNKERING VESSEL MARKET BY VESSEL TYPE (USD MILLION) 2020-2029
TABLE 128 GERMANY LNG BUNKERING VESSEL MARKET BY VESSEL TYPE (THOUSAND UNITS) 2020-2029
TABLE 129 GERMANY LNG BUNKERING VESSEL MARKET BY END USER (USD MILLION) 2020-2029
TABLE 130 GERMANY LNG BUNKERING VESSEL MARKET BY END USER (THOUSAND UNITS) 2020-2029
TABLE 131 UK LNG BUNKERING VESSEL MARKET BY TYPE (USD MILLION) 2020-2029
TABLE 132 UK LNG BUNKERING VESSEL MARKET BY TYPE (THOUSAND UNITS) 2020-2029
TABLE 133 UK LNG BUNKERING VESSEL MARKET BY VESSEL TYPE (USD MILLION) 2020-2029
TABLE 134 UK LNG BUNKERING VESSEL MARKET BY VESSEL TYPE (THOUSAND UNITS) 2020-2029
TABLE 135 UK LNG BUNKERING VESSEL MARKET BY END USER (USD MILLION) 2020-2029
TABLE 136 UK LNG BUNKERING VESSEL MARKET BY END USER (THOUSAND UNITS) 2020-2029
TABLE 137 FRANCE LNG BUNKERING VESSEL MARKET BY TYPE (USD MILLION) 2020-2029
TABLE 138 FRANCE LNG BUNKERING VESSEL MARKET BY TYPE (THOUSAND UNITS) 2020-2029
TABLE 139 FRANCE LNG BUNKERING VESSEL MARKET BY VESSEL TYPE (USD MILLION) 2020-2029
TABLE 140 FRANCE LNG BUNKERING VESSEL MARKET BY VESSEL TYPE (THOUSAND UNITS) 2020-2029
TABLE 141 FRANCE LNG BUNKERING VESSEL MARKET BY END USER (USD MILLION) 2020-2029
TABLE 142 FRANCE LNG BUNKERING VESSEL MARKET BY END USER (THOUSAND UNITS) 2020-2029
TABLE 143 ITALY LNG BUNKERING VESSEL MARKET BY TYPE (USD MILLION) 2020-2029
TABLE 144 ITALY LNG BUNKERING VESSEL MARKET BY TYPE (THOUSAND UNITS) 2020-2029
TABLE 145 ITALY LNG BUNKERING VESSEL MARKET BY VESSEL TYPE (USD MILLION) 2020-2029
TABLE 146 ITALY LNG BUNKERING VESSEL MARKET BY VESSEL TYPE (THOUSAND UNITS) 2020-2029
TABLE 147 ITALY LNG BUNKERING VESSEL MARKET BY END USER (USD MILLION) 2020-2029
TABLE 148 ITALY LNG BUNKERING VESSEL MARKET BY END USER (THOUSAND UNITS) 2020-2029
TABLE 149 SPAIN LNG BUNKERING VESSEL MARKET BY TYPE (USD MILLION) 2020-2029
TABLE 150 SPAIN LNG BUNKERING VESSEL MARKET BY TYPE (THOUSAND UNITS) 2020-2029
TABLE 151 SPAIN LNG BUNKERING VESSEL MARKET BY VESSEL TYPE (USD MILLION) 2020-2029
TABLE 152 SPAIN LNG BUNKERING VESSEL MARKET BY VESSEL TYPE (THOUSAND UNITS) 2020-2029
TABLE 153 SPAIN LNG BUNKERING VESSEL MARKET BY END USER (USD MILLION) 2020-2029
TABLE 154 SPAIN LNG BUNKERING VESSEL MARKET BY END USER (THOUSAND UNITS) 2020-2029
TABLE 155 RUSSIA LNG BUNKERING VESSEL MARKET BY TYPE (USD MILLION) 2020-2029
TABLE 156 RUSSIA LNG BUNKERING VESSEL MARKET BY TYPE (THOUSAND UNITS) 2020-2029
TABLE 157 RUSSIA LNG BUNKERING VESSEL MARKET BY VESSEL TYPE (USD MILLION) 2020-2029
TABLE 158 RUSSIA LNG BUNKERING VESSEL MARKET BY VESSEL TYPE (THOUSAND UNITS) 2020-2029
TABLE 159 RUSSIA LNG BUNKERING VESSEL MARKET BY END USER (USD MILLION) 2020-2029
TABLE 160 RUSSIA LNG BUNKERING VESSEL MARKET BY END USER (THOUSAND UNITS) 2020-2029
TABLE 161 REST OF EUROPE LNG BUNKERING VESSEL MARKET BY TYPE (USD MILLION) 2020-2029
TABLE 162 REST OF EUROPE LNG BUNKERING VESSEL MARKET BY TYPE (THOUSAND UNITS) 2020-2029
TABLE 163 REST OF EUROPE LNG BUNKERING VESSEL MARKET BY VESSEL TYPE (USD MILLION) 2020-2029
TABLE 164 REST OF EUROPE LNG BUNKERING VESSEL MARKET BY VESSEL TYPE (THOUSAND UNITS) 2020-2029
TABLE 165 REST OF EUROPE LNG BUNKERING VESSEL MARKET BY END USER (USD MILLION) 2020-2029
TABLE 166 REST OF EUROPE LNG BUNKERING VESSEL MARKET BY END USER (THOUSAND UNITS) 2020-2029
TABLE 167 MIDDLE EAST AND AFRICA LNG BUNKERING VESSEL MARKET BY COUNTRY (USD MILLION) 2020-2029
TABLE 168 MIDDLE EAST AND AFRICA LNG BUNKERING VESSEL MARKET BY COUNTRY (THOUSAND UNITS) 2020-2029
TABLE 169 MIDDLE EAST AND AFRICA LNG BUNKERING VESSEL MARKET BY TYPE (USD MILLION) 2020-2029
TABLE 170 MIDDLE EAST AND AFRICA LNG BUNKERING VESSEL MARKET BY TYPE (THOUSAND UNITS) 2020-2029
TABLE 171 MIDDLE EAST AND AFRICA LNG BUNKERING VESSEL MARKET BY VESSEL TYPE (USD MILLION) 2020-2029
TABLE 172 MIDDLE EAST AND AFRICA LNG BUNKERING VESSEL MARKET BY VESSEL TYPE (THOUSAND UNITS) 2020-2029
TABLE 173 MIDDLE EAST AND AFRICA LNG BUNKERING VESSEL MARKET BY END USER (USD MILLION) 2020-2029
TABLE 174 MIDDLE EAST AND AFRICA LNG BUNKERING VESSEL MARKET BY END USER (THOUSAND UNITS) 2020-2029
TABLE 175 UAE LNG BUNKERING VESSEL MARKET BY TYPE (USD MILLION) 2020-2029
TABLE 176 UAE LNG BUNKERING VESSEL MARKET BY TYPE (THOUSAND UNITS) 2020-2029
TABLE 177 UAE LNG BUNKERING VESSEL MARKET BY VESSEL TYPE (USD MILLION) 2020-2029
TABLE 178 UAE LNG BUNKERING VESSEL MARKET BY VESSEL TYPE (THOUSAND UNITS) 2020-2029
TABLE 179 UAE LNG BUNKERING VESSEL MARKET BY END USER (USD MILLION) 2020-2029
TABLE 180 UAE LNG BUNKERING VESSEL MARKET BY END USER (THOUSAND UNITS) 2020-2029
TABLE 181 SAUDI ARABIA LNG BUNKERING VESSEL MARKET BY TYPE (USD MILLION) 2020-2029
TABLE 182 SAUDI ARABIA LNG BUNKERING VESSEL MARKET BY TYPE (THOUSAND UNITS) 2020-2029
TABLE 183 SAUDI ARABIA LNG BUNKERING VESSEL MARKET BY VESSEL TYPE (USD MILLION) 2020-2029
TABLE 184 SAUDI ARABIA LNG BUNKERING VESSEL MARKET BY VESSEL TYPE (THOUSAND UNITS) 2020-2029
TABLE 185 SAUDI ARABIA LNG BUNKERING VESSEL MARKET BY END USER (USD MILLION) 2020-2029
TABLE 186 SAUDI ARABIA LNG BUNKERING VESSEL MARKET BY END USER (THOUSAND UNITS) 2020-2029
TABLE 187 SOUTH AFRICA LNG BUNKERING VESSEL MARKET BY TYPE (USD MILLION) 2020-2029
TABLE 188 SOUTH AFRICA LNG BUNKERING VESSEL MARKET BY TYPE (THOUSAND UNITS) 2020-2029
TABLE 189 SOUTH AFRICA LNG BUNKERING VESSEL MARKET BY VESSEL TYPE (USD MILLION) 2020-2029
TABLE 190 SOUTH AFRICA LNG BUNKERING VESSEL MARKET BY VESSEL TYPE (THOUSAND UNITS) 2020-2029
TABLE 191 SOUTH AFRICA LNG BUNKERING VESSEL MARKET BY END USER (USD MILLION) 2020-2029
TABLE 192 SOUTH AFRICA LNG BUNKERING VESSEL MARKET BY END USER (THOUSAND UNITS) 2020-2029
TABLE 193 REST OF MIDDLE EAST AND AFRICA LNG BUNKERING VESSEL MARKET BY TYPE (USD MILLION) 2020-2029
TABLE 194 REST OF MIDDLE EAST AND AFRICA LNG BUNKERING VESSEL MARKET BY TYPE (THOUSAND UNITS) 2020-2029
TABLE 195 REST OF MIDDLE EAST AND AFRICA LNG BUNKERING VESSEL MARKET BY VESSEL TYPE (USD MILLION) 2020-2029
TABLE 196 REST OF MIDDLE EAST AND AFRICA LNG BUNKERING VESSEL MARKET BY VESSEL TYPE (THOUSAND UNITS) 2020-2029
TABLE 197 REST OF MIDDLE EAST AND AFRICA LNG BUNKERING VESSEL MARKET BY END USER (USD MILLION) 2020-2029
TABLE 198 REST OF MIDDLE EAST AND AFRICA LNG BUNKERING VESSEL MARKET BY END USER (THOUSAND UNITS) 2020-2029
LIST OF FIGURES
FIGURE 1 MARKET DYNAMICS
FIGURE 2 MARKET SEGMENTATION
FIGURE 3 REPORT TIMELINES: YEARS CONSIDERED
FIGURE 4 DATA TRIANGULATION
FIGURE 5 BOTTOM-UP APPROACH
FIGURE 6 TOP-DOWN APPROACH
FIGURE 7 RESEARCH FLOW
FIGURE 8 GLOBAL LNG BUNKERING VESSEL MARKET BY TYPE, USD MILLION, 2020-2029
FIGURE 9 GLOBAL LNG BUNKERING VESSEL MARKET BY VESSEL TYPE, USD MILLION, 2020-2029
FIGURE 10 GLOBAL LNG BUNKERING VESSEL MARKET BY END USER, USD MILLION, 2020-2029
FIGURE 11 GLOBAL LNG BUNKERING VESSEL MARKET BY REGION, USD MILLION, 2020-2029
FIGURE 12 PORTER’S FIVE FORCES MODEL
FIGURE 13 GLOBAL LNG BUNKERING VESSEL MARKET BY TYPE, USD MILLION, 2021
FIGURE 14 GLOBAL LNG BUNKERING VESSEL MARKET BY VESSEL TYPE USD MILLION, 2021
FIGURE 15 GLOBAL LNG BUNKERING VESSEL MARKET BY END USER USD MILLION, 2021
FIGURE 16 LNG BUNKERING VESSEL MARKET BY REGION USD MILLION, 2021
FIGURE 17 MARKET SHARE ANALYSIS
FIGURE 18 CROWLEY MARITIME CORPORATION: COMPANY SNAPSHOT
FIGURE 19 EXXON MOBIL CORPORATION: COMPANY SNAPSHOT
FIGURE 20 GASUM OY: COMPANY SNAPSHOT
FIGURE 21 HARVEY GULF INTERNATIONAL MARINE: COMPANY SNAPSHOT
FIGURE 22 KLAW LNG: COMPANY SNAPSHOT
FIGURE 23 KOREA GAS CORPORATION: COMPANY SNAPSHOT
FIGURE 24 PETROLEUM NASIONAL BERHAD: COMPANY SNAPSHOT
FIGURE 25 POLSKIE LNG S.A: COMPANY SNAPSHOT
FIGURE 26 ROYAL CUTCH SHELL: COMPANY SNAPSHOT
DOWNLOAD FREE SAMPLE REPORT
License Type
SPEAK WITH OUR ANALYST
Want to know more about the report or any specific requirement?
WANT TO CUSTOMIZE THE REPORT?
Our Clients Speak
We asked them to research ‘ Equipment market’ all over the world, and their whole arrangement was helpful to us. thehealthanalytics.com insightful analysis and reports contributed to our current analysis and in creating a future strategy. Besides, the te
Yosuke Mitsui
Senior Associate Construction Equipment Sales & Marketing
We asked them to research ‘Equipment market’ all over the world, and their whole arrangement was helpful to us. thehealthanalytics.com insightful analysis and reports contributed to our current analysis and in creating a future strategy. Besides, the te


